PAPER
Cite this:Lab Chip, 2019, 19, 3815
Received 3rd July 2019, Accepted 4th October 2019
DOI: 10.1039/c9lc00641a
rsc.li/loc
Real-time impedimetric droplet measurement (iDM)
†‡
Abtin Saateh,
Ali Kalantarifard,
Oguz Tolga Celik, Mohammad Asghari,
Murat Serhatlioglu
and Caglar Elbuken
*
Droplet-based microfluidic systems require a precise control of droplet physical properties; hence, mea-suring the morphological properties of droplets is critical to obtain high sensitivity analysis. The ability to perform such measurements in real-time is another demand which has not been addressed yet. In this study, we used coplanar electrodes configured in the differential measurement mode for impedimetric measurement of size and velocity. To obtain the size of the droplets, detailed 3D finite element simulations of the system were performed. The interaction of the non-uniform electric field and the droplet was inves-tigated. Electrode geometry optimization steps were described and design guideline rules were laid out. User-friendly software was developed for real-time observation of droplet length and velocity together within situ statistical analysis results. A comparison between impedimetric and optical measurement tools is given. Finally, to illustrate the benefit of having real-time analysis, iDM was used to synthesize particles with a predefined monodispersity limit and to study the response times of syringe pump and pressure pump driven droplet generation devices. This analysis allows one to evaluate the ‘warm-up’ time for a droplet generator system, after which droplets reach the desired steady-state size required by the applica-tion of interest.
Introduction
Droplet-based microfluidics has proven itself to be one of the major sub-categories of microfluidics thanks to its ability to en-capsulate the working material into segmented droplets in a carrying fluid. Microdroplet systems are used in a vast range of applications from drug delivery and discovery1,2 to cellular studies,3–5 material synthesis6 and studying chemical reactions.7–9 The main motivations of performing a study in microdroplet form are the need for high throughput, low sam-ple volume, automation and precision of the analytical out-put.10All of these features require the monitoring of droplets especially during the system development phase, where droplet formation and microchannel design are optimized. This study was inspired by the recently published work on automated droplet measurement systems using image processing tech-niques.11,12These droplet measurement tools are used by tens of laboratories all across the world. After using these systems for several droplet biochemical assays, we came to the conclu-sion that there is a need for real-time droplet measurement since it alleviates the cumbersome steps of high-resolution
video recording and post-processing, which significantly in-crease the analysis time. Additionally, a real-time droplet mea-surement tool can be used to study the system dynamics that have an effect on droplet physical properties.
Several optical and electrical detection methods have been utilized for microfluidic droplet studies. The optical droplet detection method involves the integration of a light source and detection unit into a microfluidic chip to measure drop-let size, size distribution, shape, frequency, velocity and composition.13–22 De Saint Vincent et al. presented a real-time droplet detection system to measure droplet length, ve-locity and frequency using two photodiodes.18 Although re-cent optical systems are usually on-chip and do not require bench-top hardware, they have low reproducibility due to the stringent alignment procedure between the light source and photodiodes. The use of waveguides and apertures is a com-mon practice to avoid the misalignment issues that lead to signal deterioration.17,19,23
For electrical droplet detection, Niu et al. reported a capacitive detection method for counting droplets and for droplet size, velocity and composition detection.24 Elbuken et al. made non-contact planar microelectrodes to measure microfluidic droplet size and velocity using an application-specific integrated circuit (ASIC).25 Dong et al. utilized a multi-connection interdigital electrode design to vary the size of the sensor to obtain a higher capacitance change for in-creasing droplet size.26 Yakdi et al. investigated both plug-like and slug-plug-like droplets to detect their size and velocity.27
Institute of Materials Science and Nanotechnology, National Nanotechnology Research Center (UNAM), Bilkent University, Ankara 06800, Turkey. E-mail: [email protected]
† Electronic supplementary information (ESI) available. See DOI: 10.1039/ c9lc00641a
‡ iDM can be obtained online: www.impedimetric-droplet.weebly.com. Further development of iDM is possible by contacting the corresponding authors.
View Article Online
Fu et al. developed a capacitive droplet detection unit as part of a closed-loop control system to obtain a precise droplet size. They verified their electrical droplet detection results against those of an image-processing method.28 Moiseeva et al. investigated both two-electrode and three-electrode de-tection mechanisms.29It was stated that a three-electrode dif-ferential measurement scheme eliminates the background drift. Additionally, since the size and velocity mutually affect the detection signal, these two parameters cannot be resolved using a two-electrode system.
Currently, the most popular microfluidic droplet analysis tools are based on image-processing due to their simplicity and availability. Some studies used the ImageJ software to measure the properties of a limited number of droplets.30–32 To overcome the limitations of software development for spe-cific droplet-based applications, Basu developed an image-processing software program, droplet morphometry and velocimetry (DMV), based on Matlab that is extensively equipped for droplet studies. DMV analyzes the various prop-erties of droplets using bright-field microscopy videos.11 Sim-ilarly, Chong et al. developed an image-processing tool, named automated droplet measurement (ADM), with the same functionality as DMV but with minimal inputs required from the user.12 From a user point-of-view, ADM is an en-hanced and automated version of DMV. Although both tools are satisfactory for post-analysis of droplet physical proper-ties, they do not function in real-time limiting their applica-bility for a range of studies. The performance of DMV and
ADM depends on the quality of the cameras, microscope lenses and illumination. Precision in these systems is obtained by increasing the resolution and the frame rate of the recorded video at the expense of computational cost.
This study presents a real-time impedimetric droplet anal-ysis system with high precision and reproducibility. The sys-tem overview with the experimental setup and the geometry used in the simulations are given in Fig. 1. We first analyze the 3D design of a droplet and the impedimetric signal obtained using planar microelectrodes by computational sim-ulations. Based on these results, electrode design optimiza-tion is performed and design guidelines are derived. Then, the real-time detection system is explained and the results are provided. The experimental results obtained from the impedimetric detection system are compared with the ones obtained by image-processing analyses. Finally, the real-time droplet measurement tool is used to synthesize monodis-perse polymeric particles and to evaluate the performance of a syringe pump and a pressure pump in generating droplets. These examples demonstrate the importance of having a real-time automated droplet measurement tool.
Methods
Computational model
A 3D model of a droplet and a multilayer structure of the microfluidic channel including gold electrodes and a passiv-ation layer is prepared to investigate the response of the
Fig. 1 Schematic of the impedimetric droplet measurement (iDM) setup consisting of a PDMS microfluidic chip equipped with three electrodes. The coplanar electrodes are coated with a passivation layer to prevent electrode deterioration due to direct contact of electrodes and droplets. An AC signal is applied through the middle electrode. A transimpedance amplifier is used to obtain the voltage signal, which is fed to the lock-in amplifier.
droplet sensor. Finite element simulations are performed using the electrostatics module of COMSOL Multiphysics software. The side-view schematic of the droplet model is shown in Fig. 2. In this model, the droplet leading and reced-ing faces are considered as rounded with a constant radius of curvature. In the simulations, silicone oil (σ = 1 S m−1, εr=
2.5) and water (σ = 5.5 × 10⁻⁶S m−1,εr= 80) are used as the
continuous phase and dispersed phase, respectively. There are three electrodes designated as left, middle and right. An electrical current study was performed by applying a 1 V, 1 MHz bias voltage to the middle electrode with respect to the side electrodes. Differential electrical measurement is performed by using the left and right electrodes to compen-sate for sensor drift. This gives a characteristic double peak signal for each droplet as shown in Fig. 2(b). The motivation behind the simulations was to correlate the droplet position with the corresponding real-time signal. Then, by analyzing
the real-time signal, we determine the length and velocity of the droplet using simple algebraic equations.
Simulation results
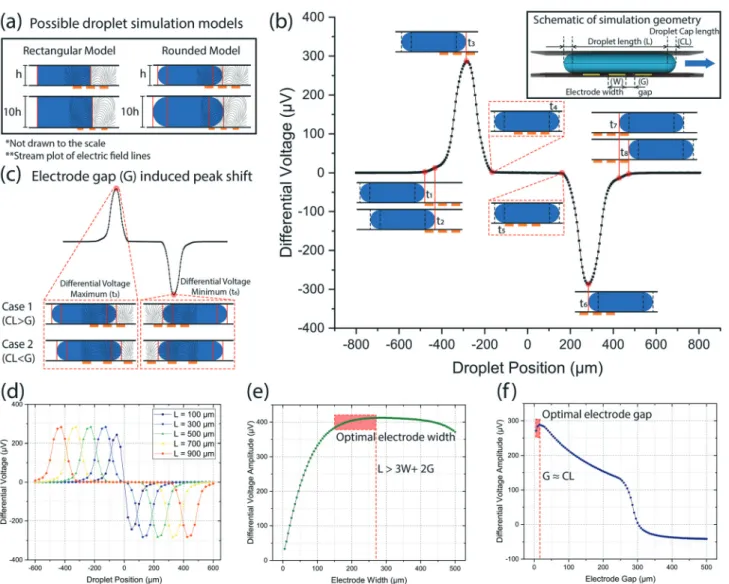
Microchannel height affects the impedance response of the droplet. To demonstrate the difference between rectangular and rounded droplets, we prepared a schematic explanation in Fig. 2(a). We first simulated electric field lines for empty chan-nels of heights h and 10h. Then, rectangular and rounded droplets were overlaid on the figure. Increasing the micro-channel height does not make a difference in the electric fields covered by the droplet. However, it is evident that as the chan-nel height increases, the rounded droplet covers less electric field lines. Therefore, changing the channel height affects the characteristic signal (t1 to t8) shown in Fig. 2(b). Since the
ac-tual droplet shape is more similar to the rounded model than
Fig. 2 Simulations of the impedimetric droplet sensor. (a) The schematic of rectangular and rounded droplet models for two different microchannel heights. (b) Differential voltage result as the droplet position is swept for case 1, usingL = 600 μm, CL = 40 μm, G = 25 μm and W = 75 μm. The current measured was read over a 1 kΩ resistor (1 nA × 1 kΩ = 1 μV). (c) The effect of electrode gap distance on the absolute maximum and minimum of the differential voltage signal. (d) Droplet length sweep for case 1 (electrode configuration isW = 75 μm and G = 25 μm). (e) Electrode width sweep for a droplet geometry ofL = 600 μm and CL = 40 μm. (f) Electrode gap sweep for a droplet geometry of L = 600 μm and CL = 40 μm.
the cuboid one, the rounded droplet model is adapted for this study. Note that a microchannel height of 80μm is used in all the following studies to match the experimental results.
Fig. 2(b) shows the simulated signal when the droplet moves over the electrodes towards the outlet at a constant ve-locity. To obtain this plot, the droplet was held stationary in a microchannel segment (length = 4000μm, width = 300 μm, height = 80μm) while the electrodes were moved in the oppo-site direction and the parametric position sweep method was applied. This method is an alternative to the finite element modelling of two-phase flow using the level-set method33,34 that is a computationally-costly and slow method. The results are obtained in a 3D geometry which matches the experimen-tal conditions (Fig. 1 channel inset); hence, they represent the time domain signal obtained from the electrical detection signal. Assuming a constant droplet velocity, the x-axis can be considered as the time scale. Therefore, the critical points on this position sweep plot are marked as t1, t2,…, t8, which
are used in the calculations given at the end of this section. When a droplet enters into the sensing region, the voltage starts to increase at t1until t3, at which the droplet completely
covers the electric field between the left and middle electrodes. On-going droplet motion toward the right electrode puts the droplet into the differential sensor region that in turn de-creases the voltage until point t4. The region between t4and t5
is where the droplet entirely covers the symmetric electric fields of the sensing and differential electrodes; hence, no net voltage change is observed. The following region from t6to t8
is the reciprocal of the region from t1to t3.
The distance between the electrodes, the gap (G), is another parameter to be considered. Herein, the simulation results are classified into two possible cases depending on the droplet cap length (CL) and gap (G) as depicted in Fig. 2(c): CL> G and CL< G. Although the characteristic signal shape in both cases is the same, there is a difference between case 1 and 2 stemming from the different droplet positions corresponding to points t3(max) and t6(min) of the signal. The maximum of
the signal occurs either when the droplet leading edge enters the right electrode region in case 1 or when it fully covers the middle electrode as in case 2 (electric field lines obtained for an empty channel). Since case 1 gives a higher amplitude, resulting in a better signal-to-noise ratio, this study contin-ued all the following analyses using case 1. For the channel height of 80 μm, we used a cap length of 40 μm. The electrode gap was set as 25μm to be in the case 1 domain.
Eight points of interest are marked in Fig. 2(b). Matching the droplet positions and the corresponding electrical signal level, three linear equations with three unknowns, L, CL and V, can be written as follows:
V(t7− t2) = L + 3W + 2G
V(t6− t3) = L + 2CL− W − 2G
V(t5− t4) = L− 3W − 2G (1)
In this set of equations, t4and t5 play a significant role in
the droplet measurement that is investigated by analyzing the
simulation results for changing the droplet length as illus-trated in Fig. 2(d). As the droplet length increases from L = 100μm to 900 μm, the peak voltage and the signal width re-main constant whereas the duration from t4 to t5 increases.
Another conclusion drawn from these results is that L = 100 μm is too small for the chosen geometry since points t4and t5
are indistinguishable in the electrical signal. Thus, there is a minimum droplet length limit for the above equations to be applicable.
Optimization
After the analysis of the characteristic signal, we studied the electrode configuration (width and gap) numerically to achieve a high signal-to-noise ratio. The electrode width sweep in Fig. 2(e) shows that the amplitude of the differential voltage increases uniformly with the increase of electrode width; however, if the length of the sensing region (3W + 2G) exceeds the droplet length (L), the maximum voltage de-creases. The suggested electrode width region to obtain a high signal-to-noise ratio is specified in Fig. 2(e). The electrode width should be maximized such that the electric field lines span a larger portion of the channel depth as long as the sensing region fits the droplet length.
As demonstrated in Fig. 2(f), the maximum differential voltage uniformly decreases with increasing electrode gap as long as the gap is not smaller than the droplet cap length. Also, there is a sudden drop in differential voltage at G> 250 μm due to the electrode sensing region exceeding the droplet size, which is beyond the detection range of our sensor. As shown in Fig. 2(f), at G = CL = 40 μm, the peak differential voltage amplitude is obtained. Therefore, the optimal gap size is equal to the droplet cap length (G≈ CL).
Design guide
We investigated the optimized electrode dimensions for droplets in the range of 300 μm to 1500 μm. The purpose of the simulation (provided in ESI.S1.†) is to provide electrode design guidelines to obtain a high differential volt-age. The simulation sweeps the droplet length (L) from 300 μm to 1500 μm with steps of 100 μm, the electrode width (W) from 50 μm to 250 μm with steps of 5 μm and the electrode gap (G) from 20 μm to 40 μm with steps of 5 μm. The results show that it is required to decrease the gap and increase the width as long as the droplet can cover all three electrodes. The following boundary condition should be preserved:
Lmin> 3W + 2G (2)
where Lminis the minimum droplet length. The droplet
spac-ing should also be larger than the width of the sensspac-ing re-gion (3W + 2G). iDM does not impose a limit on the maxi-mum droplet length.
Once the above condition is met, the width should be maximized and the gap must be minimized until
approximately the droplet cap length (G≈ CL). In the region, when W> 200 μm and L > 500 μm, the droplet size has neg-ligible effect on the maximum differential voltage and in-creasing the electrode width yields a less than 5% increase.
Experimental
Fabrication process
The microfluidic device was fabricated in three steps. (I) Initially, coplanar electrodes were fabricated on a glass slide using photolithography and a lift-off process. The electrodes were patterned using a glass/chrome mask with UV exposure (EVG®620 Mask Alignment System). The mask design, needed for microfluidic channels and electrodes, was prepared in the Tanner L-Edit software (Mentor) based on finite element method simulations. Afterwards, using a thermal evaporator (Vaksis MiDAS PVD 3T), 15 nm-thick Cr and 50 nm-thick Au coatings were applied. Finally, a lift-off process was applied in acetone. (II) Second, a passivation layer of 15 nm-thick SiO2 was deposited onto the surface
using an e-beam evaporator (Vaksis MiDAS PVD 1eB). (III) Finally, PDMS (polydimethylsiloxane) microchannels were fabricated using the standard soft-lithography process and bonded to glass using oxygen plasma. The microfluidic chip design is schematically illustrated in Fig. 1. We used a T-junction geometry for droplet generation (channel width = 300 μm, height = 80 μm). We preferred an electrode gap of 60 μm and an electrode width of 100 μm to use the microfluidic device for a wider range of droplet lengths. Deionized water droplets in silicone oil (50 mPa s, Sigma-Aldrich) were generated using a pressure source controller (Elveflow OB1).
iDM for real-time signal processing
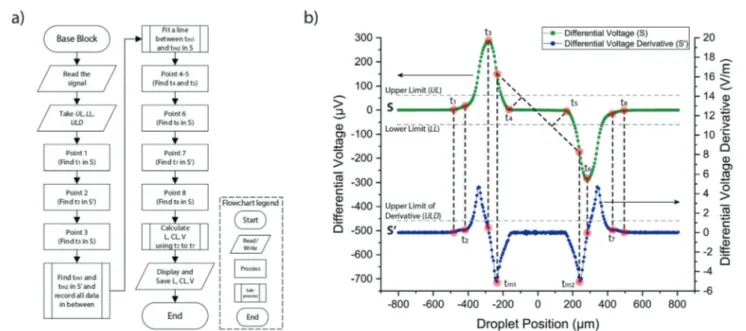
We developed iDM as a LabVIEW 2017 (National Instru-ments) based tool to control and process differential electri-cal signals obtained with a lock-in detection system. Specifi-cally, we used a DC– 50 MHz lock-in amplifier with a 128-bit digital signal processing unit (HF2LI, Zurich Instruments), and the input parameters of which are controlled through the iDM interface. The excitation signal was applied from the mid-dle electrode; the left and right electrodes were used as sens-ing and reference electrodes as shown in Fig. 1. iDM can mea-sure the droplet physical properties such as length (L), cap length (CL), and velocity (V) in real-time. In addition, it can be expanded to study droplet electrical properties such as conduc-tivity and the dielectric constant. The characteristic double peak signal is preserved for varying electrical properties of droplets as can be seen from the experimental results provided in ESI.S2.† The details of the algorithm are given in the supple-mentary document as ESI.S3.† Briefly, the characteristic signal obtained from a droplet was analyzed in real-time and the time points corresponding to eight critical points were deter-mined. These points were determined sequentially as shown in Fig. 3. Afterwards, using the set of equations (eqn (1)), iDM can determine L, CL and V. We have calculated the theoretical throughput of iDM to be approximately 1500 droplets/s using iDM's data processing rate and data transfer rate, and the real-time sampling rate of the lock-in amplifier. The details of this calculation are given in ESI.S4.†
iDM interface and features
iDM provides a user-friendly interface with few input require-ments from the user (Fig. 4). iDM consists of two main parts
Fig. 3 iDM algorithm for the detection oft1,t2,…, t8to determineL, CL and V. (a) Simplified flowchart of the iDM algorithm. (b) Differential
voltage signal (S) used for the detection of t1,t3,t4,t5,t6, andt8and its derivative (S′) used for the detection of t2,tm1,tm2, andt7. The signal (S) is
named‘Configuration’ and ‘Results’. After running the soft-ware, the signal and its derivative can be observed in the con-figuration part. This section allows the user to control the ex-citation voltage, frequency, and sampling rate. The user is required to set three limits,‘Upper Limit’ (UL), ‘Lower Limit’ (LL), and ‘Upper Limit of Derivative’ (ULD), which are explained in detail in ESI.S3.† It is recommended to use 10– 15% above and below the baseline signal (S) level as UL and LL, respectively. Similarly, the recommended ULD value is 10–15% above the S′ baseline signal. Sample limit values are shown in Fig. 3b in the simulated droplet signal. These limits can be determined by the user after visualizing the real-time droplet signal for the first few droplets shown in the ‘Config-uration’ tab. Finally, after entering the microelectrode dimen-sions (W and G), iDM is ready for real-time signal processing. The second part of iDM, called‘Results’, displays the three physical parameters of the droplets (length, cap length, and velocity) as output. The user can simultaneously monitor these parameters for the last detected droplet, as shown in Fig. 4. Also, the user can monitor the histogram, minimum, maximum, mean, standard deviation, and coefficient of varia-tion of all these parameters in real-time. The number of total droplets detected by the electrodes and the ones that are suc-cessfully analyzed with iDM are given in the upper left sec-tion. The average droplet generation frequency and droplet spacing are also shown.
Results and applications
Verification of iDM results
Image-processing based software packages are currently the mainstream microfluidic droplet analysis research tools. DMV11is a commonly used dedicated tool for droplet
analy-sis. Using the Bland–Altman method,35–37we determined the limits of agreement between iDM and DMV; also, we investi-gated the interchangeability of the methods.
Size is the most important property of droplets to be mon-itored and controlled. Having a reliable system for size analy-sis in real-time can significantly improve droplet-based microfluidics studies. We used over 1811 droplets formed in 15 min for comparison of iDM and DMV as depicted in Fig. 5. For a conclusive analysis, it is critical to keep the num-ber of data points above the suggested least sample size, which is reported to be over 100 by the Clinical & Laboratory Standards Institute.38 Our results in Fig. 5(a) indicate Pearson's r value between iDM and DMV to be 0.90, which is accepted as a very high correlation.39 Altman and Bland stated that the Pearson correlation is inadequate to conclude the interchangeability of methods.35Not too surprisingly, the two methods measuring the same parameter would yield a correlation. Fig. 5(b) shows the Bland–Altman plot of the same data given in Fig. 5(a). The two methods have a con-stant bias of 78.1μm. Differences between the two methods increase linearly as the droplet size increases, which is an in-dicator of increasing random error with increasing droplet size. The most important conclusion of the Bland–Altman analysis is the interchangeability of the methods, which is de-termined based on the limits of agreement, ±1.96 SD bound-aries, and tolerance. The limits of agreement in Fig. 5(b) are 58.5μm and 97.7 μm that yield a 39.2 μm difference. There-fore, whenever the tolerance is over 39.2 μm, iDM and DMV can be used interchangeably. The details of our comparison can be seen in ESI.S5.†
Although, DMV provides droplet velocity results, there is a subtle difference between the velocity measurements performed in image processing methods and iDM. DMV
Fig. 4 iDM‘Results’ tab user interface displaying the droplet morphological properties and the corresponding statistics including histogram, minimum, maximum, mean, standard deviation and coefficient of variation (CV) values in real-time.
measures the velocity by analyzing successive frames that capture the droplet under test within the region of interest and provides an average velocity for the corresponding frames. However, iDM provides a more instantaneous-like ve-locity measurement. The measurement domain of iDM is de-fined by the electrode sensing region, which is much shorter. For pressure-driven flow systems, droplets are subjected to varying velocities primarily due to pressure fluctuations dur-ing droplet formation.40–42 Since the instantaneous velocity of droplets varies, we cannot verify our velocity results using any other detection tool.
DMV does not provide cap length measurements. Hence, to verify our cap length measurements, we made a detailed numerical verification using COMSOL simulations. We used 3D droplets with ellipsoidal edges, with a minor radius of 50 μm and a varying major radius (cap length) that was swept from 0 (cuboid) to 200 μm with 40 μm steps. Then, the position sweeping procedure explained in the Simulation results section was used to simulate the detection signals. These signals were imported by iDM and the algorithm was applied to determine the morphological properties. The re-sults are given in ESI.S5.† We have obtained a good agree-ment (less than 5% error) for CL values up to 80 μm. The increasing error for higher CL is due to divergence from the rounded droplet assumption used in the theoretical model (CL = H/2).
iDM application 1: monodisperse particle synthesis
iDM can be utilized for particle synthesis applications, where flow rate optimization is required to obtain a desired mono-dispersity. Using iDM, one can monitor the monodispersity in real-time and can start the synthesis after the parameters are optimized and stable droplet generation is observed. It is also possible to combine iDM with a downstream droplet sorting unit to filter out undesired droplets (droplets with a large size variation). As a demonstration of particle synthesis
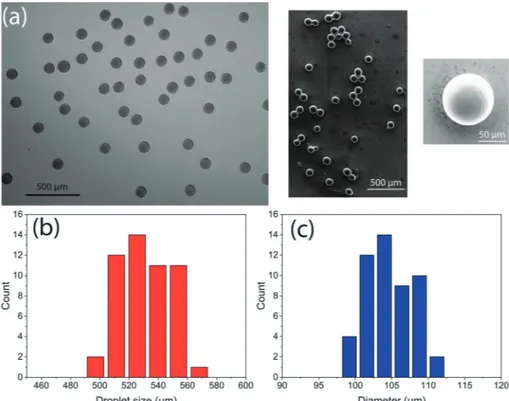
with a specified monodispersity, we produced polyethylene glycol (PEG) particles. The experimental details and the microchip design are given in ESI.S6.† After detection with iDM, the droplets were transferred into a Petri dish, where UV photo-polymerization was performed that formed spheri-cal particles. The shape of the particles was confirmed by SEM analysis. The diameter of the particles was measured using an optical microscope and the images are shown in Fig. 6(a). The coefficient of variation (CV) for the diameter measurement of 50 PEG particles was 2.8%. iDM measured the CV of droplet size (L + 2CL) as 3.3% for these particles. The histograms are given in Fig. 6(b) and (c) for the droplet size distribution obtained with iDM and for the polymer sphere diameter obtained by optical microscopy image analy-sis, respectively. During photo-polymerization, we observed a diameter shrinkage of 53%, which is similar to the ones reported in the literature.43The two histograms are in agree-ment confirming the use of iDM for real-time droplet moni-toring. iDM not only monitors the size and speed of droplets inside the microchannel, but it also measures the size distri-bution in real-time, which requires a post-characterization step in most other systems. Additionally, for applications that require a certain value of monodispersity, the desired mono-dispersity value can be given to iDM by the user as input and the synthesis can be initiated after that threshold value is reached (the user is warned by visual and audio effects). For the screenshot image shown in Fig. 4, after the desired monodispersity value of 5% is obtained, a green light is turned on. Thus, iDM guarantees the production of PEG par-ticles with less than 5% monodispersity.
iDM application 2: response time of syringe pumpvs. pressure pump
To demonstrate the use of iDM for real-time droplet forma-tion analysis, we compared the response time of systems driven with syringe and pressure pumps. Unarguably, syringe
Fig. 5 Comparison of droplet sizes measured with iDM and DMV. (a) Scatter plot of the data to check the evaluation of similarity. (b) Bland– Altman plot of the same data for evaluation of agreement analysis.
(displacement) and pressure pumps are the two most com-monly used pumps in microfluidic systems.
It is shown that a syringe pump has periodic fluctuations mainly due to the stepper motor which pushes the plunger.44
Two of the parameters determining the oscillation periodicity of a syringe pump driven flow are the syringe diameter and
flow rate.44Flow fluctuations also affect the pump response
time which leads to various response times ranging from about two minutes to nearly one hour, as reported by differ-ent studies.40,44,45 A pressure pump has generally yielded a
shorter response time and lower volumetric flow fluctuations in comparison to a syringe pump.44,45Deciphering the cause
Fig. 6 (a) Optical (left) and electron (right) microscopy images of polyethylene glycol (PEG) particles synthesized with the droplet-based micro-fluidic system; (b) histogram of droplet sizes measured with iDM; (c) histogram of PEG particle diameters measured by optical image processing.
Fig. 7 Droplet generation in different droplet length scales using different flow suppliers. (a) A pressure pump is used for both the continuous phase and dispersed phase. (b) A pressure pump and syringe pump are used for the continuous phase and dispersed phase, respectively.
of parameters affecting the response time of the system re-mains difficult due to the lack of a real-time analysis tool.
For the comparison of response times, we used a high-end syringe pump (KDScientific 270) and pressure pump (Elveflow OB1). The schematics of the two setups are given in Fig. 7. For ease of comparison, we supplied the continuous phase using the pressure pump for both experiments. For the first scenario, the dispersed phase was introduced using the pressure pump. The droplet size was modified by gradually increasing the pressure levels (Pcand Pd) which gave a
step-wise droplet length response as a function of time, as shown in Fig. 7(a). The corresponding pressure levels and the mean droplet length for each setting are displayed in the figure. For each level, we formed 200 droplets and measured their lengths in real-time using iDM after which the input pressure levels are changed. As seen from the results, when a pressure pump is used, the response time is measured to be around 12 s for a system with approximately a 1 Hz droplet genera-tion rate.
A similar experiment was performed when the dispersed phase was supplied with the syringe pump. The continuous phase pressure (Pc) was kept fixed at 55 mbar, whereas the
sy-ringe pump flow rate (Qd) is increased gradually from 1 to 1.5
μl min−1to match the droplet lengths obtained in the first
ex-periment. As seen from the results given in Fig. 7(b), we ob-served an order of magnitude increase in the response time, which is around 100 s. It is important to note that we ana-lyzed more than 1500 droplets for each set due to the much longer response time of the syringe pump.
We have obtained similar results using two other models of syringe pumps and concluded that the response times of sy-ringe pumps are markedly longer than that of the pressure pump. Obtaining the same droplet length for multiple experi-ments was extremely challenging and we needed to tailor the pump settings while observing the real-time droplet length measured with iDM. During those experiments, iDM has proven its practicality as a unique system for monitoring drop-let physical properties in real-time. One of the most common uses of droplet-based microfluidic systems is biochemical analysis, where repetitive experiments are a necessity. In such scenarios, iDM will be an enabling tool due to its real-time droplet measurement capability, which can allow researchers to fine tune their systems and easily differentiate between the warm-up and the steady-state droplet generation regimes.
Conclusions
iDM offers the ability to conduct real-time droplet morphol-ogy measurements of microdroplets in microfluidic systems using impedimetric measurements and three microfabricated electrodes. Droplet length, cap length, and velocity are de-rived from the analysis of electrical signals using numerical analysis. The optimized electrode geometry and more impor-tantly the design procedures were developed for a large range of droplet lengths. An algorithm was developed to process the differential lock-in amplifier measurements in real-time.
A comparative study with an image-processing based detec-tion method for droplet length yielded a 0.90 Pearson's corre-lation coefficient r and 39.2μm tolerance for interchangeabil-ity of the two methods. Thanks to the real-time droplet size analysis, polymeric particles were synthesized with a pre-specified monodispersity value set by the user. Syringe pump and pressure pump response times were compared using iDM that showed an order of magnitude difference for stable droplet generation in favour of the pressure pump. iDM pro-vides a practical method for label-free droplet analysis, inte-grated with an easy-to-use program capable of performing real-time signal processing. The analysis of the electrical properties of droplets is a potential extension of the system to widen its applicability.
Author contributions
A. S. and C. E. conceived the project. C. E. supervised the pro-ject. A. S., A. K., and C. E. designed the experiments. A. S. and A. K. performed the experiments. A. S. developed the iDM al-gorithm and LabVIEW interface. O. T. C. performed COMSOL simulations with M. A. and A. S.'s assistance. A. S. and M. S. performed the microfabrication and impedance measure-ments. A. S. prepared the figures and drafted the manuscript. All authors edited and revised the manuscript.
Conflicts of interest
There are no conflicts to declare.
Acknowledgements
This project was supported by the Scientific and Technological Research Council of Turkey (TÜBİTAK, Project No. 215E086). The authors acknowledge support from Dr. Bülend Ortaç for particle synthesis experiments.
References
1 R. Riahi, A. Tamayol, S. A. M. Shaegh, A. M. Ghaemmaghami, M. R. Dokmeci and A. Khademshosseini, Curr. Opin. Chem. Eng., 2015, 7, 101–112.
2 P. S. Dittrich and A. Manz, Nat. Rev. Drug Discovery, 2006, 5, 210–218.
3 M. Zagnoni and J. M. Cooper, Methods Cell Biol., 2011, 102, 23–48.
4 H. N. Joensson and H. Andersson Svahn, Angew. Chem., Int. Ed., 2012, 51, 12176–12192.
5 M. Takinoue and S. Takeuchi, Anal. Bioanal. Chem., 2011, 400, 1705–1716.
6 S. Xu, Z. Nie, M. Seo, P. Lewis, E. Kumacheva, H. A. Stone, P. Garstecki, D. B. Weibel, I. Gitlin and G. M. Whitesides, Angew. Chem., Int. Ed., 2005, 44, 724–728.
7 H. Song, D. L. Chen and R. F. Ismagilov, Angew. Chem., Int. Ed., 2006, 45, 7336–7356.
8 T. S. Kaminski and P. Garstecki, Chem. Soc. Rev., 2017, 46, 6210–6226.
9 L. Shang, Y. Cheng and Y. Zhao, Chem. Rev., 2017, 117, 7964–8040.
10 A. Kalantarifard, A. Saateh and C. Elbuken, Chemosensors, 2018, 6, 23.
11 A. S. Basu, Lab Chip, 2013, 13, 1892–1901.
12 Z. Z. Chong, S. B. Tor, A. M. Gañán-Calvo, Z. J. Chong, N. H. Loh, N. T. Nguyen and S. H. Tan, Microfluid. Nanofluid., 2016, 20, 1–14.
13 N. T. Nguyen, S. Lassemono and F. A. Chollet, Sens. Actuators, B, 2006, 117, 431–436.
14 Y. W. Hsieh, A. B. Wang, X. Y. Lu and L. A. Wang, Sens. Actuators, B, 2016, 237, 841–848.
15 C. Kunstmann-Olsen, M. M. Hanczyc, J. Hoyland, S. Rasmussen and H. G. Rubahn, Sens. Actuators, B, 2016, 229, 7–13. 16 P. K. Shivhare, A. Prabhakar and A. K. Sen, J. Micromech.
Microeng., 2017, 27, 35003.
17 S. U. Hassan, A. M. Nightingale and X. Niu, Micromachines, 2017, 8, 1–10.
18 M. R. De Saint Vincent, S. Cassagnére, J. Plantard and J. P. Delville, Microfluid. Nanofluid., 2012, 13, 261–271.
19 S.-u. Hassan, A. M. Nightingale and X. Niu, Biomed. Microdevices, 2018, 20, 92.
20 W. Engl, M. Roche, A. Colin, P. Panizza and A. Ajdari, Phys. Rev. Lett., 2005, 95, 1–4.
21 R. Revellin, V. Dupont, T. Ursenbacher, J. R. Thome and I. Zun, Int. J. Multiphase Flow, 2006, 32, 755–774.
22 S. Jakiela, S. Makulska, P. M. Korczyk and P. Garstecki, Lab Chip, 2011, 11, 3603–3608.
23 G. Bettella, R. Zamboni, G. Pozza, A. Zaltron, C. Montevecchi, M. Pierno, G. Mistura, C. Sada, L. Gauthier-Manuel and M. Chauvet, Sens. Actuators, B, 2019, 282, 391–398.
24 X. Niu, M. Zhang, S. Peng, W. Wen and P. Sheng, Biomicrofluidics, 2007, 1, 44101.
25 C. Elbuken, T. Glawdel, D. Chan and C. L. Ren, Sens. Actuators, A, 2011, 171, 55–62.
26 T. Dong and C. Barbosa, Sensors, 2015, 15, 2694–2708. 27 N. E. Yakdi, D. Bricault, F. Huet and K. Ngo, Procedia Eng.,
2016, 168, 1466–1470.
28 H. Fu, W. Zeng, S. Li and S. Yuan, Sens. Actuators, A, 2017, 267, 142–149.
29 E. V. Moiseeva, A. A. Fletcher and C. K. Harnett, Sens. Actuators, B, 2011, 155, 408–414.
30 M. Chabert and J.-L. Viovy, Proc. Natl. Acad. Sci. U. S. A., 2008, 105, 3191–3196.
31 M. Zantow, R. Dendere and T. S. Douglas, Proceedings of the Annual International Conference of the IEEE Engineering in Medicine and Biology Society, EMBS, 2013, pp. 1776–1779. 32 A. G. Teixeira, M.-C. Tsai and J. Frampton, Microfluidics,
BioMEMS, and Medical Microsystems XVI, 2018, p. 15. 33 E. Bjørklund, Comput. Fluids, 2009, 38, 358–369.
34 Y. Li, M. Jain and K. Nandakumar, COMSOL Conference Proceeding, 2012, pp. 1–6.
35 D. G. Altman and J. M. Bland, Journal of The Royal Statistical Society Series D-The Statistician, 1983, 32, 307–317.
36 J. Martin Bland and D. G. Altman, Lancet, 1986, 327, 307–310. 37 J. M. Bland and D. G. Altman, Stat. Methods Med. Res.,
1999, 8, 135–160.
38 J. R. Budd, A. P. Durham, T. E. Gwise, B. Iriarte, A. Kallner, K. Linnet, R. Magari and J. E. Vaks, Measurement procedure comparison and bias estimation using patient samples : approved guideline, Clinical and Laboratory Standards Institute (CLSI), Wayne, PA, 3rd edn, 2013.
39 D. E. Hinkle, W. Wiersma and S. G. Jurs, Applied statistics for the behavioral sciences, Houghton Mifflin, 2002.
40 T. Glawdel and C. L. Ren, Microfluid. Nanofluid., 2012, 13, 469–480. 41 N. R. Beer, K. A. Rose and I. M. Kennedy, Lab Chip, 2009, 9,
838–840.
42 V. van Steijn, M. T. Kreutzer and C. R. Kleijn, Chem. Eng. J., 2007, 135, 159–165.
43 W. C. Jeong, J. M. Lim, J. H. Choi, J. H. Kim, Y. J. Lee, S. H. Kim, G. Lee, J. D. Kim, G. R. Yi and S. M. Yang, Lab Chip, 2012, 12, 1446–1453.
44 P. M. Korczyk, O. Cybulski, S. Makulska and P. Garstecki, Lab Chip, 2011, 11, 173–175.
45 W. Zeng, I. Jacobi, D. J. Beck, S. Li and H. A. Stone, Lab Chip, 2015, 15, 1110–1115.