2015/1 33 Nazlı HOŞAL AKMAN**
Can SİMGA MUGAN***
Orhan AKIŞIK****
ABSTRACT
Effect of corporate ownership concentration on firm performance has been researched in various fields. We investigate the effect of family and foreign ownership on firm performance – both market and accounting- for companies listed on the Istanbul Stock Exchange-Turkey- from 2005 to 2009. We find a positive relationship between family and foreign ownership and market per-formance during the period. Our results also show that foreign ownership con-centration loses its effect on market performance during 2008-2009 – a period marked by the economic crisis, which might be attributed to the global source of the crisis. Interestingly, effects of family and foreign ownership concentra-tion on firm performance diminish, and even disappear, when performance is measured by using accounting data.
Keywords: Family ownership, foreign ownership, firm performance;
ROA, Tobin’s q,
JEL Classification: M10, M40
TÜRKİYE’DE ORTAKLIK YOĞUNLAŞMASININ ŞİRKET PER-FORMANSINA ETKİSİ
ÖZ
Ortaklık yapısının şirket performansı üzerindeki etkisine ilişkin çeşit-li alanlarda araştırmalar yapılmıştır. Bu araştırmada aile ve yabancı ortaklık paylarının şirket performansı üzerindeki etkileri, 2005-2009 yılları arasında İstanbul Menkul Kıymetler Borsasında işlem gören şirketler için incelenmiştir. Araştırma döneminde piyasa performansı ile aile ve yabancı ortaklık payı
ara-* Makale gönderim tarihi: 18.12.2014; kabul tarihi: 17.02.2015
** Bilkent University, Faculty of Business Administration, Ankara, Turkey, [email protected] *** Corresponding author, Izmir University of Economics, Faculty of Business Administration, Balcova,
Izmir, Turkey, [email protected]
**** University of Massachusetts Amherst,Isenberg School of Management, Isenberg Building 323, USA, [email protected]
Muhasebe Bilim Dünyası Dergisi Mart 2015; 17 (1): 33-56
2015/1 34
sında pozitif ilişki saptanmıştır. Ayrıca sonuçlar, ekonomik kriz dönemi olan 2008-2009 yıllarında yabancı ortaklık yoğunlaşmasının piyasa performansı üzerindeki etkisinin azaldığını da göstermektedir ki bu da krizin küresel nite-likte olmasına bağlanabilir. Araştırmanın dikkate değer bir başka sonucu ise, aile ve yabancı ortaklık yoğunlaşması etkilerinin, performans muhasebe veri-leri kullanılarak ölçüldüğünde azalması ve hatta etkiveri-lerin ortadan kalkmasıdır.
Anahtar Kelimeler: Aile ortaklık yapısı, yabancı ortaklık, şirket
perfor-mansı, varlık getirisi, Tobin’s q.
JEL Sınıflandırması: M10, M40
1. INTRODUCTION
Ownership structure and concentration has attracted considerable attention since the seminal work of Berle and Means (1932), and it has been vastly investigated within the economics and business literatu-re. The ownership concentration notion is used to define and describe, as well as to reflect and measure agency costs (Schleifer and Vishny 1997; Fama and Jensen 1983; Burkartand others 2003, among others); to determine the relation between managers and owners; to investigate the conflicts between and among the managers and major and minor shareholders (Denis and Denis 1994; Morckand others 1988; Schleifer and Vishny 1997; La Portaand others 1999; Andersen and Reeb 2003; Morck and Yeung 2003, among others); and to investigate the effect of ownership concentration on firm performance (Demsetz and Lehn 1985; Denis and Denis 1994; McConnell and Servaes 1990).
Prior researchprovides support for both positive and negative effects of ownership concentration, and thus there is no consensus on the effect yet. It is argued that ownership concentration is a response to weak pro-tection of minority shareholders by the legal system. Code Law countri-es do not provide as much protection to minority shareholders as Com-mon Law countries do (La Portaand others 1999; Shleifer and Vishny 1997, Grant and Kirshmaier 2004). Therefore, minority shareholders seek to protect their investments through large shareholders who can monitor managers’ behavior (Shleifer and Vishny 1986; La Portaand others 1999; Franks and others 2009). However, even if ownership con-centration leads to better monitoring of managerial behavior, it does not eliminate agency problems entirely.Majority shareholders may still ext-ract firms’ resources in order to increase their wealth at the expense of minority shareholders (Bennedsenand others 2010, p. 376; Surroca and Tribo 2008; Bechtand others 2003; Bianco and Casavola 1999; Shliefer
2015/1 35
and Vishny 1997 and 1986; Hausmann 1996, p. 59).
Similar to other Code Law countries such France, Spain and Italy, most companies in Turkey are family owned (Grant and Kirshmaier 2004; Gursoy 2004). Prior research indicates that most Turkish firms have a concentrated ownership structure with majority shareholders who belong to families (Ararat and Ugur 2003; Yurtoglu 2000 and 2003). Usually, the founding family member is both the chairman and the CEO, a case which is different than the developed country examp-les. Furthermore, a pyramidal ownership structure, in which one group or entrepreneur controls many firms, is also dominant in Turkish firms (Demirag and Serter 2003; Claessensand others 2000). Currently, there are about 950001 corporations in Turkey, of which approximately
bet-ween 300 to 340 are publicly traded on the Istanbul Stock Exchange (ISE), though this number changes over time.
This present study extends prior findings and examines how con-centrated ownership – family or foreign – affects the market and ac-counting performance of publicly traded companies in Turkey- for the period 2005 through 2009 within which considerable institutional de-velopments (e.g. adoption of corporate governance disclosures and In-ternational Financial Reporting Standards-IFRS) took place. The study further examines the effect of ownership concentration during pre-crisis and crisis periods by dividing the analysis period into 2005-2007 and 2008-2009 sub-periods because of the economic crisis that started in 2008 and lasted in 2009. Firm performance is measured by Tobin’s q to determine market performance whilst return on assets (ROA) measures the accounting performance.
In general we find that higher family and foreign ownership have a positive effect on market performance. Family ownership concentrati-on especially increases market performance during the crisis, whereas foreign ownership effect dematerializes in the crisis period. Besides, family and foreign ownership concentration do not have any effect on accounting performance. The results show that ROA is associated po-sitively with the size of the firm and negatively with the degree of le-verage.
The remainder of this paper is organized as follows: Section 2 sum-marizes the literature review and Section 3 outlines the data and met-hodology. Section 4 provides the analyses and results and Section 5 concludes.
2015/1 36
2. LITERATURE REVIEW AND HYPOTHESIS DEVE-LOPMENT
2.1. Family Shareholder Concentration
Since the pivotal work of Jensen and Meckling (1976) on agency costs, conflicts between major and minor shareholders and professional managers in dispersed ownership have attracted considerable attenti-on (Holderness 2003). Cattenti-onflicts that may arise from the relatiattenti-onships among management and various shareholder groups are resolved via institutional factors prevalent in the environment of the company. Such factors refer to laws and regulations, as well as other written or unw-ritten procedures and practices within each company’s environment, which can be at a global, national or firm level (North 1990).
In the Anglo-Saxon model of corporate governance, which offers the strongest protection for minority shareholders, the founder hires professional managers to run the firm but then sells off the entire firm in the stock market if the benefits of keeping control in the firm are not large enough. In such a system, the agency problem is between minority shareholders and the manager. On the other hand, if the legal protection for minority shareholders is moderate, the founder still hires a profes-sional manager, but the founder or his children keep their controlling shares to monitor the manager. In this case, conflicts can exist not only between the manager and majority shareholders, but also between the manager and minority shareholders and between majority and minority shareholders. In a system that offers the weakest protection for minority shareholders, there is no separation of management and ownership, and the founding family has controlling shares and runs the firm. The foun-ding family may allow a professional manager to run the firm usually if she or he becomes a family member. The Turkish case is an excellent example of the weakest protection referred to above.
When institutional factors are strong, then minority owners are well protected, and family and minority owners benefit from the control the family has over the management, as the cost of monitoring is low – es-pecially with a family member on the board (Burkartand others 2003). Burkartand others (2003) also argue that the separation of management and ownership leads to more efficient corporate governance. On the other hand, in a weak institutional environment, a majority owner – fa-mily or foreign – may have incentives to enjoy the benefits of exprop-riation and exploitation of control. According to the Principal-Principal (PP) model of corporate governance, which centers on conflicts bet-ween controlling and minority shareholders, concentrated ownership
2015/1 37
and control is an indication of weak governance, lower firm valuations, lower levels of dividend payout and expropriation of minority sharehol-ders (Young and others 2008). However, shared benefits of control can still exist in this environment; e.g., the majority exerts more pressure on managers to improve the performance of the firm and all shareholders benefit. In an unprotected and underdeveloped environment, small in-vestors’ interests may be in congruence with the major owner’s (family or foreign) interests, who enjoys private benefits of control to increase the longevity and performance of a company (Castaneda 2006). Kuz-netsovand others (2008) posit that in such an environment, accounting measures of performance rather than market measures of performance will be more important, due to possible weak and inefficient market conditions.
Studies that examine the relation between corporate ownership and firm performance report mixed results. According to Miller and Breton-Miller (2006), firm value declines after a certain ownership percentage because once a party or family obtains controlling shares it tends to abuse its power by expropriating resources at the expense of minority shareholders. However, Anderson and Reeb (2003) and Villalongo and Amit (2006) find that family firms perform better than non-family firms, and that in S&P 500 firms performance increases if family mem-bers serve as the CEO. Moreover, Andersen and Reeb (2003) indicate that minority shareholders are not adversely affected by family owners-hip. Furthermore, Lee (2006) argues that family firms are likely to grow faster and be more profitable when family members are involved in ma-nagement. Using a sample of 2000 of the largest US firms, Anderson et al. (2009) conclude that founder or heir firms perform better than
non-family firms if the financial reporting environment is highly transparent and if minority shareholders have strong legal protection. Otherwise,
controlling shareholders use firms’ resources for their private benefit and influence performance adversely.
On the other hand, many authors (Bebchukand others 2000; Morc-kand others2000; Morck and Yeung, 2003; Ali and others2007, among others) provide evidence of severe agency problems in S&P 500 family firms that arise from relations between family members and other sha-reholders. In contrast to Anderson and Reeb (2003), Barth et al. (2005) report that family-owned firms are about 10% less productive than non-family-owned firms. They argue that the productivity gap can be expla-ined by differences in management models. Furthermore, they provide evidence that family-owned firms that are managed by a non-family
2015/1 38
family firms that are managed by a family member are significantly less productive than non-family firms.2 Agency problems may be more
prevalent in family-controlled firms, due to self-control issues and conf-licts of interest within and among owners (Schulze and others 2001). In particular, family members who hold a controlling equity may exprop-riate firms’ resources from minority shareholders (Chang 2003; La Por-taand others 1999). According to Anderson and Reeb (2004), an agency problem of this kind can be resolved when family board representation is balanced by outside professional managers who mitigate conflicts of interest between family and minority shareholders.
In a comparative study, Bloom and Van Reenen (2007) find that US firms display better management practices in terms of higher produc-tivity, higher profitability, better Tobin’s q and sales growth than their European counterparts, where poor management practices are likely to be associated with family ownership. Studies in other developed count-ries also display mixed findings. Gedajlovic and Shapiro (2002) report a positive association between ownership concentration and financial performance in Japanese firms. Lehmann and Weigand (2000) examine the relation of ownership concentration and profitability for German corporations from 1991 to 1996 and report that ownership concentra-tion has a significant negative impact on profitability as measured by the return on total assets. Górrizand Fumás (1996) study the relations-hip between ownersrelations-hip and performance among publicly held Spanish firms and find that there is no difference between family and non-family firms in terms of profitability, although they differ from each other in terms of productive efficiency. However, Miguel et al. (2004) document that ownership structure has a non-linear impact on a firm’s value in Spanish public firms. They point out that a higher percentage of ow-nership concentration in Spanish firms (as compared to US and UK firms) would make it easier for controlling shareholders to expropriate profits. Sacristan-Navarro et al. (2011) report that it is not the family ownership but the family control that affects profitability in Spanish firms. Using a sample of 1672 non-financial firms from Western Eu-ropean countries, Maury (2006) finds that active family ownership, in which family members hold at least one of the top two officer positi-ons, improves profitability. On the other hand, passive family owners-hip does not affect the profitability of family-controlled firms compared with non-family firms.
2 Even if the results obtained by Anderson and Reeb (2003) and Barth et al. (2005) contradict each other at first sight, Barth et al. argue that Anderson and Reeb’s finding is related to percentage of ownership, and firm performance decreases when percentage of ownership increases.
2015/1 39
Ownership studies in the emerging economies are similar to deve-loped economy results. Lauterbach and Vaninsky (1999) examine the effect of ownership structure on firm performance in Israeli firms and reveal that firms with diffuse ownership and non-owner managers are more efficient in generating net income. However, in a study of 175 Greek firms listed on the Athens Stock Exchange, Kapopoulos and La-zaretou (2007) find that a more concentrated ownership structure is po-sitively related to higher firm profitability and that management is better monitored and more disciplined. A more recent study by Kowalewski et al. (2010) examines the impact of family involvement in management and ownership on firm performance in Poland. Their results indicate that family ownership has a positive and significant influence on firm performance as measured by return on assets, return on equity and ope-rating income. However, this positive effect disappears above a certain level of ownership, suggesting an inverted U-shaped relationship bet-ween family ownership and firm performance. Moreover, they provide evidence that firm performance is positively and significantly affected by family CEOs. Martinez et al. (2007) provide evidence that public family firms perform better than public non-family firms in Chile.
2.2. Foreign Shareholder Concentration
For emerging economies, foreign direct investment, i.e., foreign ow-nership is another feature of corporate owow-nership structure. Studies that investigate the effect of foreign ownership on firm performance find that foreign ownership has a favorable effect on performance, contrary to the results of family ownership studies. Douma et al. (2006) adopt a multi-theoretic perspective in explaining firm performance in emer-ging markets by integrating agency-, institutional- and resource-based theories. They propose that if the shareholders are outsiders, concentra-ted, foreign and have strategic resources, then firm performance will be enhanced. In emerging economies, then, foreign direct investments are expected to bring additional financial support, technology, know-how and best management practices. Their study confirms their expectations and reveals that Indian public firms that have foreign shareholders with strategic interests perform better, as measured by ROA and Tobin’s q. Huang and Shiu (2009) report a positive impact of foreign ownership on firm performance by using accounting and market performance me-asures in Taiwan. Likewise, Bjuggren et al. (2007) find that foreign ownership has a positive impact on performance, as measured by mar-ginal q in Swedish firms. Similarly, Sueyoshiand others (2010), provide that foreign shareholding increases firm operating efficiency, however, there is a non-linear relationship between foreign shareholding
percen-2015/1 40
tage and operating efficiency and the efficiency declines after a certain threshold of foreign ownership.
The Turkish business environment is characterized by concentra-ted ownership, generally in the form of family-owned business groups (Gursoy 2004; Ararat and Uğur 2003). Families own the majority sha-res of a holding company, which in turn owns the shasha-res of other com-panies, giving rise to a pyramidal ownership structure (Gursoy 2004; Gursoy and Aydogan 2003 and Yurtoğlu 2000). As of the end of 2010, around 49% of the publicly traded companies on the ISE have family ownership.Family owners had more than 50% of the controlling shares in 40% of these companies.3 In addition to family-owned firms, foreign
direct investments in the form of concentrated foreign owners are also present in Turkey. As of the end of 2010, about 22% of publicly traded firms on the ISE had foreign direct investments, with an average foreign shareholding of 47.8%.
Several studies investigate the effect of family and foreign owners-hip on Turkish firm performance. According to Yurtoglu (2000), con-centrated ownership characterized by family shareholdings has a nega-tive impact on firm performance, as assessed by ROA, ratio of market to book value and dividend payout ratios. On the other hand, Gursoy and Aydogan (2003) report that, although not statistically significant, family ownership has a positive effect on accounting performance but a significant and negative effect on market performance. Gursoy and Aydogan (2003) also investigate the impact of foreign ownership on firm performance and find that although foreign ownership positively affects accounting and market performance, the results are not statisti-cally significant.
2.3. Hypotheses Development
The above discussions demonstrate that there is no consensus among previous research regarding the effect of family ownership concentra-tion on different company performance attributes for either the develo-ped or emerging economies. Although family control reduces agency problems between owners and managers, it may lead to conflicts betwe-en minority shareholders and family members in countries with low le-gal protection.However, the findings of studies on foreign ownership in emerging markets demonstrate to some extent that foreign investment has positive effects on market performance and operating performance, as measured by Tobin’s q and ROA, respectively (Weiand others 2005). 3 Calculated based on data obtained from www.imkb.org.tr and www.kap.gov.tr
2015/1 41
Hence, our main hypotheses, in alternative form, follow:
H1A: There is a close association between ownership concentration in the form of family and foreign ownership and market firm perfor-mance, though its sign may be positive or negative.
H2A: There is a close association between ownership concentration in the form of family and foreign ownership and accounting firm per-formance, though its sign may be positive or negative.
3. DATA AND METHODOLOGY 3.1. Sample
Our data consist of companies quoted on the ISE and included in the ISE Composite Index, which covers all quoted companies except for investment funds and insurance companies, for the years 2005 through 2009. We chose to start at 2005, since all publicly traded companies started to use the same set of accounting standards, namely IFRS, in that year. The ISE is the only stock exchange in Turkey; it started its operations in 1986 and has been growing since, despite several national and global economic crises. There were 315 companies listed on the exchange in 2009, with a total market capitalization of 226 billion US dollars. The number of companies included in the sample began at 211 in 2005 and increased to 224 by 2009, due to the initial public offerings that occurred during the period. The final number of firm-year observa-tions totals 1094.
3.2. Econometric Model
The objective of the study is to investigate whether family and fore-ign ownership concentration affects firm performance; we use the fol-lowing model to test the relation between ownership structure and firm performance:
Firm Performancei,t =
b0 + b1 (ownership percentagei,t) + b2(board membership proportioni,t) + b3 (family chair of the boardi,t) + b4 (CEOboardi,t) + b5 (sizei,t) + b6 (leveragei,t) + b7 (agei,t) + ei,t,
where
Firm performancei,t = ROA and Ln of Tobin’s q of firm i at time t,
Ownership Percentagei,t= Direct and indirect family shareholding percentage or foreign shareholding percentage of firm i at time t,
2015/1 42
Board Membership Proportioni,t = Proportion of the number of bo-ard members who belong to the family or foreign shareholder to the total number of board members
Family chair of the boardi,t = Dummy variable, 1 if the chair of the board is a family member, 0 if not
CEOboardi,t = Dummy variable, 1 if the CEO is a board member, 0 if not
Sizei,t = Natural logarithm of total assets of firm i at time t,
Leveragei,t = Ratio of total liabilities to total assets of firm i at time t,
Age,t = Natural logarithm of number of years of firmi at time t,
since establishment
All accounting data were hand collected from published financial statements and market data were collected from the ISE web site.
3.3. Performance Measures
We assess firm performance by using market and accounting data. We estimate Tobin’s q as an indicator of market performance, which we calculate by dividing the market value of the firm by the book value of its total assets.4 We employ ROA as the accounting measure of perfor-mance and calculate it by dividing the net income of the period by the total book value of the firm’s assets.
3.4. Family and Foreign Ownership
The family and foreign ownership percentages were hand collected from the ISE Yearbook of Companies (available on the ISE website) for 2005 through 2008 and the platform of company information5 for 2009 and 2010. Ownership percentages were determined by calculating the direct family and foreign shares within the outstanding capital. To de-termine the amount of family ownership in a company, we made sure to include the shares of all family members for each year. When we were not sure of family memberships, we consulted newspapers, commercial gazettes and the internet until all authors agreed on the identification of all family member owners.
3.5. Control Variables
There are three corporate governance measures used as control 4 Tobin’s q was not normally distributed; we transformed it by taking the natural logarithm.
2015/1 43
variables. Board membership proportion represents the proportion of the number of board members who belong to the family or the fore-ign group, to the total number of board members and measures the ad-ditional control brought by the concentration of board membership to the shareholding percentage. The lower proportion is an indication of higher presence of independent directors who are expected to protect the minority rights and prevent expropriation of minority rights by the controlling shareholder group (Andersen and Reeb, 2004). Second va-riable- “family chair of the board” is a dummy variable. If the chair of the board belongs to the controlling family, it takes 1, if not the value of the variable is 0. Similar to the effect of board membership proportion, the presence of a family member as the chair of the board adds a further control of the family over the firm. Third variable- “CEOboard” is also a dummy variable. It takes 1 if the CEO serveson the board of directors, and 0 if not. All corporate governance variables were hand collected from the ISE Yearbook of Companies (available on the ISE website) for 2005 through 2008 and the platform of company information6 for
2009 and 2010.
Prior research demonstrates that firm size and leverage are impor-tant factors that affect firm performance (Lins 2003; Andersen and Reeb 2003; Doumaand others 2006; Villalonga and Amit 2006, among others), hence, were included as control variables in the model.Both total assets and total revenues are used as firm size measures in the lite-rature. We use total assets as the size measure. Leverage is equal to the total liabilities divided by the total assets. Age also is expected to affect firm performance: older firms might enjoy the benefits of experience; however, they might also be less flexible in terms of adaptation to new conditions (Doumaand others2006).
4. ANALYSIS AND RESULTS
Table 1 presents the descriptive statistics of the variables used in the analyses. The most striking figure is Assets, which ranges from 6 mil-lion to 116.3 bilmil-lion TL, and hence has a very high standard deviation, skewed positively and highly leptokurtic. Hence, we used a logarithmic transformation to normalize the data for this variable. For the same re-ason, we transformed Tobin’s q and firm age as well. Distributions of other variables were appropriate to use in a regression model.
2015/1 44
Table 1. Summary Statistics
Mean Median
Standard
Deviation Min Max Tobin's Q 0.82 0.60 0.96 0.03 12.51
ROA 0.04 0.03 0.12 (0.85) 1.50
Family Ownership 39.70 43.70 29.40 - 100.00 Family Board Membership % 25.54 18.18 27.77 - 100.00 Foreign Ownership 13.88 - 26.99 - 99.84 Foreign Board Membership % 13.92 - 25.62 - 100.00 Revenues (million TL) 1,332 206 4,100 - 55,631 Assets (million TL) 3,469 268 12,774 6 116,334 Leverage 0.49 0.47 0.26 0.00 2.00
Age 34.14 35.00 15.26 1.00 85.00
Tobin’s q: Market value of the firm divided by the book value of total assets; ROA: Net income of the period divided by the book value of total assets; Family Ownership:Direct and indirect family shareholding percentage; Family Board Mem-bership %: Proportion of the number of board members who belongs to the family to the total number of board members; Foreign Ownership: Direct and indirect foreign shareholding percentage; Foreign Board Membership %: Proportion of the number of board members who belongs to the foreign shareholder to the total number of board members; Assets: Total assets; Revenues: Total operating revenues; Leverage: Ratio of total liabilities to total assets; Age: Number of years of firm since establishment.
The data reflect the available information for all the companies tra-ded on the ISE from 2005 through 2009, except investment funds and insurance companies. Some observations are dropped because of mis-sing financial statements and/or market capitalization information; the resulting observations total 1087 for Tobin’s q and 1088 observations for ROA.
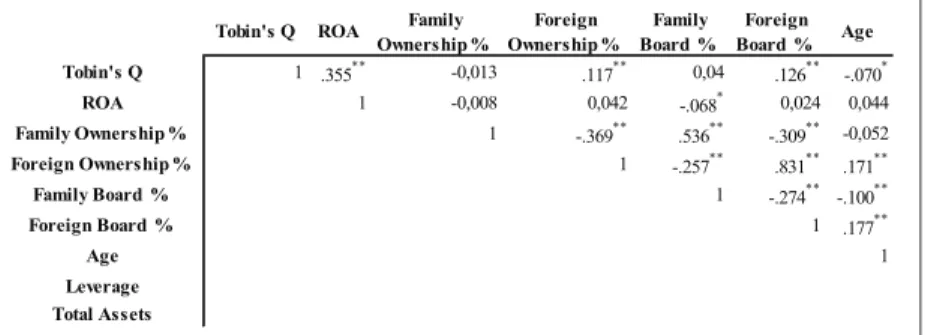
Before performing regression analysis, we investigate the associati-on amassociati-ong the variables. As can be followed from Table 2, the accoun-ting and markeaccoun-ting performance measures don’t have significant corre-lation with shareholding percentages except for the foreign ownership which has a positive correlation with Tobin’s q.
2015/1 45 Table 2. Correlation Matrix for the period 2005-2009
Tobin's Q ROA Ownership %Family Ownership %Foreign Board %Family Board %Foreign Age
Tobin's Q 1 .355** -0,013 .117** 0,04 .126** -.070* ROA 1 -0,008 0,042 -.068* 0,024 0,044 Family Ownership % 1 -.369** .536** -.309** -0,052 Foreign Ownership % 1 -.257** .831** .171** Family Board % 1 -.274** -.100** Foreign Board % 1 .177** Age 1 Leverage Total Assets
Tobin’s q: Ln of market value divided by the book value of total assets; ROA: Net income of the period divided by the book value of total assets; Family Owners-hip %: direct and indirect family shareholding percentage; Foreign OwnersOwners-hip %: direct and indirect foreign shareholding percentage; Family Board %: Proportion of the number of board members who belongs to the family to the total number of board members; Foreign Board %: Proportion of the number of board members who belongs to the foreign shareholder to the total number of board members; Age: Ln of number of years of firm since establishment; Leverage: Ratio of total liabilities to total assets; Size: Ln of total assets.**: Correlation is significant at the 0.01 level (two-tailed)
The relation between performance and size differs according to ROA and Tobin’s q; size is positively correlated with ROA but negati-vely correlated with Tobin’s q. Leverage is negatinegati-vely correlated with ROA and Tobin’s q, implying that highly leveraged companies have lower performance measurements. While there is a negative correlation between family ownership and total assets, there is a positive corre-lation between size and foreign ownership. This finding may suggest that, as in prior literature, foreign investors in Turkey choose firms with growth opportunities, while family owners choose less risky options.
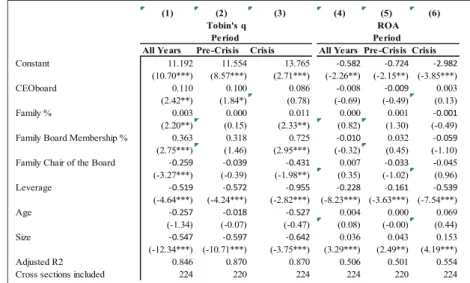
Results of prior literature on the relation between family ownership and firm performance are mixed. Our next analysis employs regression models to determine the significance of the associations we observe in our initial analysis. Table3 presents the results of the panel data reg-ression, cross section fixed effects full model, where all independent and control variables are included.Columns 1-3and columns 4-6 of the table present the results where Tobin’s q and ROA are the dependent variables, respectively. In addition to performing regression for all firm year observations, the analysis period is further divided into 2005-2007 and 2008-2009 sub-periods. The reason for such division of periods was the economic crisis that started in 2008 and lasted in 2009 as also
2015/1 46
evidenced by the annual GDP changes of 0.66% and -4.69% for 2008 and 2009, respectively. We also performed Hausman test to control for potential endogeneity between firm performance and ownership per-centages, and the results do not reveal endogeneity issues.
According to the results of the full model, both family and foreign ownership concentration affect the market performance of the firm po-sitively (p<0.01). Furthermore, the proportion of family members ser-ving on the board also increases the firm market performance (p<0.01) as indicated in prior literature (Maury, 2006 and Kowalowski, 2010). On the other hand, the proportion of foreign board members does not have a significant effect. The presence of CEO on the board also positi-vely affects the performance (<0.05), but if the chairman of the board is a family member, performance is adversely affected (p<0.01). In terms of firm specific control variables, the degree of leverage and the size of the firm negatively affect market performance (p<0.01) while the age of the firm has no significant effect.
Regression results obtained for the accounting performance mea-sure –ROA- are quite different than the market performance results. Accounting performance is affected only by the size and degree of leve-rage (p<0.01), in which the size has positive and leveleve-rage has negative effect. Ownership concentration and corporate governance variables don’t have significant effects on the firm’s accounting performance.
Next we analyze firm performance in the sub-periods. According to the regression results presented in Table 3 column (2), same effects in the full period are observed in the pre-crisis period with the exception of family chair of the board losing its significance.
In the crisis period the results, as presented in Table 3 column (3), are different from the full period, in the sense that foreign ownership concentration doesn’t have any significant effect on market performan-ce although the family ownership conperforman-centration continues its positive effect (p<0.05). Similar results are obtained for the effects of control variables for the crisis period.
Pre-crisis and crisis period results for the accounting performance are presented in Table 3 columns (5) and (6).We observe similar results with the full period as well, except for the positive effect of family ow-nership percentage during the crisis period (p<0.05).
2015/1 47
Table 3. Full Model Regression Results
(1) (2) (3) (4) (5) (6)
All Years Pre-Crisis Crisis All Years Pre-Crisis Crisis
Constant 11,04 11,71 13,76 -0,58 -0,67 -3,00 (10.67 ***) (8.88 ***) (2.70 ***) (-2.25 **) (-1.97 **) (-3.86 ***) CEOboard 0,11 0,10 0,08 -0,01 -0,01 0,00 (2.53 **) (1.94 ***) (0.69) (-0.66) (-0.45) (0.11) Family % 0,01 0,01 0,01 0,00 0,00 0,00 (4.45 ***) (3.47 ***) (2.26 **) (0.80) (2.17 **) (-0.22)
Family Board Membership % 0,28 0,42 0,77 -0,01 0,05 -0,05
(2.07 **) (1.95 **) (2.98 ***) (-0.40) (0.63) (-0.83)
Family Chair of the Board -0,21 -0,01 -0,41 0,01 -0,03 0,05
(-2.65 ***) (-0.15) (-1.84*) (0.38) (-0.94) (0.99)
Foreign % 0,01 0,01 0,00 0,00 0,00 0,00
(3.43 ***) (3.35 ***) (-0.37) (0.01) (1.37) (0.94)
Foreign Board Membership % 0,21 0,29 -0,22 0,01 0,02 -0,05
(-0.15) (1.27) (-0.66) (0.33) (0.29) (-0.64) Leverage -0,51 -0,51 -0,96 -0,23 -0,15 -0,55 (-4.60 ***) (-3.83 ***) (-2.79 ***) (-8.21 ***) (-3.39 ***) (-7.62 ***) Age -0,20 0,03 -0,55 0,00 0,00 0,06 (-1.05) (0.16) (-0.49) (0.09) (-0.01) (0.35) Size -0,56 -0,64 -0,63 0,04 0,04 0,15 (-12.84 ***) (-11.63 ***) (-3.68 ***) (3.25 ***) (2.07 **) (4.23 ***) Adjusted R2 0,85 0,88 0,87 0,51 0,50 0,55
Cross sections included 224,00 220,00 224,00 224,00 220,00 224,00
Period
Tobin's q ROA
Period
Tobin’s q: Ln of market value divided by the book value of total assets; ROA: Net income of the period divided by the book value of total assets; CEO board: Dummy variable,1 if the CEO is a board member, 0 if not; Family %: direct and indirect family shareholding percentage; Family Board Membership %: Proportion of the number of board members who belongs to the family to the total number of board members; Family chair of the board: Dummy variable, 1 if the chair of the bo-ard is a family member, 0 if not; Foreign %: direct and indirect foreign shareholding percentage; Foreign Board Membership %: Proportion of the number of board mem-bers who belongs to the foreign shareholder to the total number of board memmem-bers; Leverage: Ratio of total liabilities to total assets; Age: Ln of number of years of firm since establishment; Size: Ln of total assets.
a. *, ** and *** denote significance at 10%, 5% and 1%, respectively b. t values are presented in parenthesis
In order to separately investigate the effects of family and foreign ownership concentration, we also performed regression analyses by including only family or foreign ownership variables as independent variables along with the control variables.
2015/1 48
Table 4. Reduced Model Regression Results- Family Ownership Con-centration
(1) (2) (3) (4) (5) (6)
All Years Pre-Crisis Crisis All Years Pre-Crisis Crisis
Constant 11.192 11.554 13.765 -0.582 -0.724 -2.982 (10.70***) (8.57***) (2.71***) (-2.26**) (-2.15**) (-3.85***) CEOboard 0.110 0.100 0.086 -0.008 -0.009 0.003 (2.42**) (1.84*) (0.78) (-0.69) (-0.49) (0.13) Family % 0.003 0.000 0.011 0.000 0.001 -0.001 (2.20**) (0.15) (2.33**) (0.82) (1.30) (-0.49)
Family Board Membership % 0.363 0.318 0.725 -0.010 0.032 -0.059
(2.75***) (1.46) (2.95***) (-0.32) (0.45) (-1.10)
Family Chair of the Board -0.259 -0.039 -0.431 0.007 -0.033 -0.045
(-3.27***) (-0.39) (-1.98**) (0.35) (-1.02) (0.96) Leverage -0.519 -0.572 -0.955 -0.228 -0.161 -0.539 (-4.64***) (-4.24***) (-2.82***) (-8.23***) (-3.63***) (-7.54***) Age -0.257 -0.018 -0.527 0.004 0.000 0.069 (-1.34) (-0.07) (-0.47) (0.08) (-0.00) (0.44) Size -0.547 -0.597 -0.642 0.036 0.043 0.153 (-12.34***) (-10.71***) (-3.75***) (3.29***) (2.49**) (4.19***) Adjusted R2 0.846 0.870 0.870 0.506 0.501 0.554
Cross sections included 224 220 224 224 220 224
Tobin's q ROA
Period Period
Tobin’s q: Ln of market value divided by the book value of total assets; ROA: Net income of the period divided by the book value of total assets; CEO board: Dummy variable,1 if the CEO is a board member, 0 if not; Family %: direct and in-direct family shareholding percentage; Family Board Membership %: Proportion of the number of board members who belongs to the family to the total number of board members; Family chair of the board: Dummy variable, 1 if the chair of the board is a family member, 0 if not; Leverage: Ratio of total liabilities to total assets; Age: Ln of number of years of firm since establishment; Size: Ln of total assets.
a. *, ** and *** denote significance at 10%, 5% and 1%, respectively b. t values are presented in parenthesis
The results of family ownership percentage are presented in Table 4. Although the results are similar to those obtained for the full model for the whole research period, they differ for the pre-crisis period, where the family ownership percentage and proportion of family members on the board have no effect on the market performance of the company. The results obtained for crisis period on the other hand show that the family ownership concentration and the presence of family members on the board affect the market performance positively (p<0.05 and p<0.01, respectively) but family chair of the board has significant negative ef-fect (p<0.05). It seems that market values the family presence when there is an adverse economic environment.
2015/1 49
not different from the results of the full model. ROA is affected signi-ficantly only by the size and degree of leverage of the firm (p<0.01).
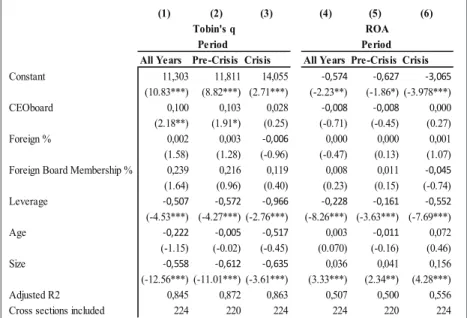
Foreign ownership analyses for the reduced findings are presented in Table 5. In contrast with the full model, the results show that foreig-nownership percentage and proportion of foreign board members don’t have any significant effect on the market performance of the company during the pre-crisis, crisis or the whole research period.
Table 5. Reduced Model Regression Results- Foreign Owners-hip Concentration
(1) (2) (3) (4) (5) (6)
All Years Pre-Crisis Crisis All Years Pre-Crisis Crisis
Constant 11,303 11,811 14,055 -0,574 -0,627 -3,065 (10.83***) (8.82***) (2.71***) (-2.23**) (-1.86*) (-3.978***) CEOboard 0,100 0,103 0,028 -0,008 -0,008 0,000 (2.18**) (1.91*) (0.25) (-0.71) (-0.45) (0.27) Foreign % 0,002 0,003 -0,006 0,000 0,000 0,001 (1.58) (1.28) (-0.96) (-0.47) (0.13) (1.07)
Foreign Board Membership % 0,239 0,216 0,119 0,008 0,011 -0,045
(1.64) (0.96) (0.40) (0.23) (0.15) (-0.74) Leverage -0,507 -0,572 -0,966 -0,228 -0,161 -0,552 (-4.53***) (-4.27***) (-2.76***) (-8.26***) (-3.63***) (-7.69***) Age -0,222 -0,005 -0,517 0,003 -0,011 0,072 (-1.15) (-0.02) (-0.45) (0.070) (-0.16) (0.46) Size -0,558 -0,612 -0,635 0,036 0,041 0,156 (-12.56***) (-11.01***) (-3.61***) (3.33***) (2.34**) (4.28***) Adjusted R2 0,845 0,872 0,863 0,507 0,500 0,556
Cross sections included 224 220 224 224 220 224
Tobin's q ROA
Period Period
Tobin’s q: Ln of market value divided by the book value of total assets; ROA: Net income of the period divided by the book value of total assets; CEO board: Dummy variable,1 if the CEO is a board member, 0 if not; Family %: direct and indirect family shareholding percentage; Family Board Membership %: Proportion of the number of board members who belongs to the family to the total number of board members; Family chair of the board: Dummy variable, 1 if the chair of the bo-ard is a family member, 0 if not; Foreign %: direct and indirect foreign shareholding percentage; Foreign Board Membership %: Proportion of the number of board mem-bers who belongs to the foreign shareholder to the total number of board memmem-bers; Leverage: Ratio of total liabilities to total assets; Age: Ln of number of years of firm since establishment; Size: Ln of total assets.
a. *, ** and *** denote significance at 10%, 5% and 1%, respectively b. t values are presented in parenthesis
2015/1 50
5. CONCLUSION AND DISCUSSION
The results of prior literature on the effects of ownership concent-ration on firm performance are mixed. In this study, we explore the effects of ownership concentration for Turkish listed companies from two different perspectives: family and foreign ownership. Furthermo-re, firm performance is assessed by using both market and accounting performance.
The results suggest that, ROA as the measure of accounting per-formance is not affected by either family or foreign ownership con-centration, and corporate governance control variables. Shareholding structure of the firm in the form of family or foreign concentration is perceived positively in the market but such presence does not add to accounting performance significantly. The results further imply that the strategic benefits that are expected to be brought by foreign sharehol-ders are only marginal in terms of conveying higher returns on asset investments. Size of the firm positively and significantly affects ROA, whereas degree of leverage has a significantly negative effect.Our fin-ding regarfin-ding the accounting performance in most instances deviates from prior results where for example Kapopoulos and Lazaretou (2007) and Kowalewski et al. (2010) posit that ownership concentration leads to higher profitability and return on assets.
Tobin’s q as a measure of performance on the other hand is found to be affected by the family ownership concentration. The results of our analysis posit that family ownership percentage together with the pro-portion of family members on the board significantly increases the mar-ket performance especially during the crisis period. This suggests that the market perceives the presence of family control as a protection aga-inst adverse market conditions.Furthermore, as suggested by Harvey (1999), family businesses may outperform non-family businesses due to the long-term interest on investment decisions of family members as opposed to professional managers. Castaneda’s (2006) argument rela-ting the environment and small investors’ interests conjectures that the latters’ interest may be in congruence with the major owner’s interests who enjoys private benefits of control to increase the longevity and performance of a company. Interestingly, the chairman of the board belonging to the controlling family has a negative relation with Tobin’s q which contradicts with the findings of Andersen and Reeb (2003). According to previous literature, family ownership concentration is expected to enhance firm performance only when there is strong insti-tutional environment and minority shareholder protection (Burkartand
2015/1 51
others2003). Thus, the results of this study provide a different angle on the effect of family control on firm performance in a so-called weak institutional environment by showing that in times of adverse market conditions,close monitoring by the owners enhances the value of the firm. However, it should also be noted that considerable institutional developments are in place, such as the adoption of corporate gover-nance principles and IFRS,which might have increased investor trust in the family companies during the study period. Having the CEO on the board has significant positive effect on market performance before, but not during the crisis. We may tie this finding to the increased effect of family ownership on Tobin’s q as indicated by its increased coeffici-ent. One possible explanation is that market does not want a “one man show” during a crisis period, but values team decision as shown by diminishing effect of CEO and family chairman during the crisis period in the study.
Although, foreign ownership has a significant positive association with Tobin’s q in the full model for the whole research period and the pre-crisis period, the significant relation diminishes in the reduced mo-del and during the crisis period. Comparing the effect of family and foreign ownership on market performance before and during crisis, one salient difference is the loss of the effect of foreign owners on the market performance. The results also differ from the findings of earlier studies on the effect of foreign ownership on performance in which fo-reign ownership is found to improve performance. One plausible reason could be the global nature of the crisis and the expectation in the market regarding the behavior of foreign investors, i.e., the possibility that they may pull their investment from Turkey.
The results of this study can be expanded in the future by extending the research period to include post-crisis information and examine the effects of family and foreign ownership on both market and accounting performance after the crisis. Furthermore, a future study that compares other emerging markets using the same methodology will enhance our understanding of the effects of ownership concentration on firm perfor-mance in such markets as well.
2015/1 52
REFERENCES
Ali, A., T. Y Chen, and S.Rodhakrishnan.2007.“Corporate Disclosures by Fa-mily Firms”Journal of Accounting and Economics, 44 (1-2): 238-286. Anderson, R. C. and D. M. Reeb.2003.“Founding-Family Ownership and Firm
Performance: Evidence from the S&P 500”, The Journal of Finance, 58 (3): 1301-1328.
Anderson, R. C. and D. M. Reeb.2004.”Board Composition: Balancing Family Influence in S&P 500 Firms”, Administrative Science Quarterly, 49 (2): 209-237.
Anderson, R. C., A.Duru, and D. M. Reeb.2009, ”Founders, Heirs, and Opa-city in the United States”, Journal of Financial Economics, 92: 205-222. Ararat, M. and M.Uğur.2003 “Corporate Governance in Turkey: An Overview
and Some Policy Recommendations”, Corporate Governance, 3(1): 58-75. Barth, E., T.Gulbrandsen, and P. Schøne.2005.“Family Ownership and
Produc-tivity: The Role of Owner-Management”, Journal of Corporate Finance, 11: 107-127.
Bebchuk, L. A., R.Kraakman, and G. G. Triantis. 2000 “ Stock Pyramids, Cross Ownership and Dual Class Equity: The Mechanisms and Agency Costs of Separating Control from Cash Flow Rights”, In: R.Morck, (Ed.)
Concentrated Corporate Ownership, Chicago University Press, Chicago,
pp. 295-315.
Becht, M., P.Bolton and A.Roell .2003.”Corporate Governance and Control”, in: G.M. Constantinides and R. Stulz, (eds), Handbook of the Economics
and Finance, Vol.1, Amsterdam: Elsevier, North Holland, pp. 1-109.
Bennedsen, M., F.Perez-Gonzalesand D.Wolfenzon. 2010.“The Governance of Family Firms” in H.K Baker and R. Anderson, (eds), Corporate
Governan-ce, A Synthesis of Theory, Research and Practice.United States of America:
John Wiley & Sons, Inc., pp.371-389.
Berle, A.A.Jr., and G.C Means. 1932.The Modern Corporation and Private
Property, Mac Millan, New York.
Bianco, M. and P.Casavola.1999. “Italian Corporate Governance: Effects on Financial Structure and Firm Performance”, European Economic Review, 43: 1057-169.
Bjuggren, P., J.E.Eklundand D.Wiberg. 2007.”Ownership Structure, Control and Firm Performance: the Effects of Vote-Differentiated Shares”, Applied Financial Economics, 7: 1323-1334.
Bloom, N. and J. Van Reenen.2007.”Measuring and Explaining Management Practices across Firms and Countries”, Quarterly Journal of Economics, 122 (4): 1351-1408.
2015/1 53 Burkart,M., F.Panunziand A.Schleifer . 2003. “Family firms”.Journal of
Finan-ce, 58(5): 2167-2202
Castaneda, G.2006.“Economic Growth and Concentrated Ownership in Stock Markets”.Journal of Economic Behavior and Organization, 59(2): 249-286. Chang, S. J. 2003.“Ownership Structure, Expropriation, and Performance of
Group-Affiliated Companies in Korea”, Academy of Management Journal, 46 (2): 238-253.
Claessens, S., Djankov, S., Fan, J.P.H., and Lang, L.H.P. 2000.“The Separation of Ownership and Control in East Asian Corporations”, Journal of Financi-al Economics, 58 (1): 81-112.
Demirag, I. and Serter, M. 2003.“Ownership Patterns and Control in Turkish Listed Companies”, Corporate Governance, 11 (1):40-51.
Demsetz, H., and Lehn, K. 1985.“The Structure of Corporate Ownership: Cau-ses and Consequences”, Journal of Political Economy, 93: 1155-1177. Denis, D., and Denis, D. 1994.“Majority Owner-Managers and Organizational
Efficiency”.Journal of Corporate Finance,1: 91-118.
Douma, S., George, R. and Kabir, R. 2006.“Foreign and Domestic Ownership, Business Groups, and Firm Performance: Evidence from a Large Emerging Market”, Strategic Management Journal, 27: 637-657.
Fama, E., and Jensen,M.C. 1983.“Separation of Ownership and Control”.Jour-nal of Law and Economics, 26(2): 301-325
Franks, J., Mayer, C. and Rossi, S. 2009.“Ownership: Evolution and Regulati-on”, Review of Financial Studies, 22(10): 4009-4056.
Gedajlovic, E., and Shapiro, D. 2002.“Ownership Structure and Firm Profita-bility in Japan”, Academy of Management Journal, 45: 565-575.
Górriz, C. G., and Fumás, V. S. 1996.“Ownership Structure and Firm Perfor-mance: Some Empirical Evidence from Spain”, Managerial and Decision Economics, 17: 575-586.
Grant, J., and Kirshmaier, T. 2004.“Corporate Ownership Structure and Perfor-mance in Europe”, CEP Discussion Paper, No.631, LSE
Gursoy, G. 2004.“Changing Corporate Ownership in the Turkish Market”, Jo-urnal of Transnational Management, 10(2): 33-48.
Gursoy, G. and Aydogan, K. 2003.“Equity Ownership Structure, Risk Taking and Performance, an Empirical Investigation in Turkish Listed Compani-es”, Emerging Markets Finance and Trade, 38(6): 6-25.
Harvey, S. J. 1999.“Owner as Manager, Extended Horizons and the Family Firm”,International Journal of the Economics of Business, 6(1):41-55. Hausmann, H. 1996.“The Ownership of Enterprise”, Harvard University Press,
2015/1 54
Holderness, C.G. 2003.“A Survey of Blockholders and Corporate Control”, FRBNY Economic Policy Review, April, pp. 51-64
Huang, R.D., Shiu, C. 2009.“Local Effects of Foreign Ownership in an Emer-ging Financial Market: Evidence from Qualified Institutional Investors in Taiwan”, Financial Management, Autumn 2009: 567-602.
Jensen, M.C. and Meckling, W.H. 1976.“Theory of the Firm: Managerial Be-havior, Agency Costs and Ownership Structure”, Journal of Financial Eco-nomics, 3(4): 305-360.
Kapopoulos, P., and Lazaretou, S. 2007.“Corporate Ownership Structure and Firm Performance: Evidence from Greek Firms”, Corporate Governance, 15 (2): 144-158.
Kowalewski, O., Talavera, O., and Stetsyuk, I. 2010.“Influence of Family In-volvement in Management and Ownership on Firm Performance: Evidence from Poland”, Family Business Review, 23 (1): 45-59.
Kuznetsov, A, Kapelyushnikov, R., and Dyomina, N. 2008.“The Performance of Closely Held Firms in Russia: Evidence from Firm-Level Data”, The European Journal of Finance, 14(04): 337 - 358.
La Porta, R., Lopez-de-Silanes, F., and Shleifer, A. 1999.“Corporate Owners-hip Around the World”, Journal of Finance, 54(2): 471-517.
Lauterbach, B., and Vaninsky, A. 1999.“Ownership Structure and Firm Perfor-mance: Evidence from Israel”.Journal of Management and Governance.3: 189-201.
Lee, J. 2006.“Family Firm Performance: Further Evidence”.Family Business Review. 19(2): 103-114.
Lehmann, E., and Weigand, J. 2000.“Does the Governed Corporation Perform Better? Governance Structures and Corporate Performance in Germany”. European Finance Review.4: 157-195.
Lins, Karl V. 2003.“Ownership and Firm Value in Emerging Markets”.The Jo-urnal of Financial and Quantitative Analysis. 38(1): 159-184
Martinez, J. I., Stöhr, B. S., and Quiroga, B. S. 2007.“Family Ownership and Firm Performance: Evidence from Public Companies in Chile”.Family Bu-siness Review.20: 83-94.
Maury, B. 2006.“Family Ownership and Firm Performance: Empirical Eviden-ce from Western European Corporations”.Journal of Corporate FinanEviden-ce.12: 321-341.
McConnel, J.J. and Servaes, H. 1990.“Additional Evidence on Equity Owners-hip and Corporate Value”.Journal of Financial Economics. 27(2): 595-612.
2015/1 55
Miguel, A., Pindado, J. and Torre, C. 2004.“Ownership Structure and Firm Value: New Evidence from Spain”.Strategic Management Journal. 25: pp. 1199-1207.
Miller, D., and Breton-Miller, I. 2006.“Family Governance and Firm Perfor-mance: Agency, Stewardship, and Capabilities”.Family Business Review. 19 (1): 73-87.
Morck, R., and Yeung, B. 2003.“Agency Problems in Large Family Groups”. Entrepreneurship: Theory and Practice.27: 367-382.
Morck, R., Shleifer, A., and Vishny, R. 1988.“Management Ownership and Market Valuation: An Empirical Analysis”.Journal of Financial Econo-mics.20: 293-315.
Morck, R., Stangeland, D. A., and Yeung, B. 2000.“Inherited Wealth, Corpo-rate Control, and Economic Growth: The Canadian Disease”. In: Morck R. (Ed.).Concentrated Corporate Ownership. Chicago: University of Chicago Press, pp. 316-369.
North,D.C. 1990.“Institutions”.Institutional Change and Economic Perfor-mance. Cambridge, Cambridge University Press
Sacristan-Navarro, M., Gomez-Anson, S. and Cabeza-Garcia, L. 2011.“Family Ownership and Control, the Presence of Other Large Shareholders, and Firm Performance: Further Evidence”, Family Business Review, 24(1): 71-93
Schulze, W. S., Lubatkin, M. H., Dino, R. N., and Buchholtz, A. K. 2001.“Agency Relationships in Family Firms: Theory and Evidence”, Or-ganization Science, 12 (2): 99-116.
Shleifer, A., and Vishny, R. W. 1986.“Large Shareholders and Corporate Cont-rol”.Journal of Political Economy, 94(3): 461-488.
Shleifer, A., and Vishny, R. W. 1997.“A Survey of Corporate Governance”, Journal of Finance.52: 737-783.
Sueyoshi, T., Goto, M. and Omi, Y. 2010.“Corporate Governance and Firm Performance: Evidence from Japanese Manufacturing Industries after the Lost Decade”, European Journal of Operational Research, 203: 724-736. Surroca, J. and Tribo, J.A. 2008.“Managerial Entrenchment abd Corporate
So-cial Performance”, Journal of Business Finance and Accounting, 35(5,6): 748-789.
Villalonga, B., and Amit, R. 2006.“How Do Family Ownership, Control and Management Affect Firm Value?”, Journal of Financial Economics,80: 385-417.
2015/1 56
Wei,Z., Xie, F., and Zhang, S. 2005.“Ownership Structure and Firm Value in China’s Privatized Firms: 1991-2001”, Journal of Financial and Quantita-tive Analysis, 40(1): 87-108.
Young, M.N., Peng, M.W., Ahlstrom, D., Bruton, G.D. and Jiang, Y. 2008.“Cor-porate Governance in Emerging Economies: A Review of the Principal-Principal Perspective”, Journal of Management Studies, 45(1): 196-220. Yurtoğlu, B.B. 2000.“Ownership, Control and Performance of Turkish Listed
Firms”, Empirica.27: 193-222.
Yurtoğlu, B.B. 2003.“Corporate Governance and Implications for Minority Shareholders in Turkey”,Corporate Ownership and Control, 1(1): 73-89