İsmail Tuna ARAS
A STUDY ON THE EFFICIENCY OF FOREIGN TRADE BETWEEN TURKEY and EU CUSTOMS UNION: BEFORE and AFTER
Joint Master’s Programme European Studies Master Thesis
İsmail Tuna ARAS
A STUDY ON THE EFFICIENCY OF FOREIGN TRADE BETWEEN TURKEY and EU CUSTOMS UNION: BEFORE and AFTER
Supervisors
Prof. Dr. Esra ÇAYHAN, Akdeniz University Dipl. Philipp WAHNSCHAFFE, Hamburg University
Joint Master’s Programme European Studies Master Thesis
[/,,L
(1"
TezBaghg:
R
St
"\
o^$La,
Cf$blc"c1
of
F".,rig"
ctr.ado.3.t-oo",.
Tr-U.1
A^J
€'U &+1o-s
fjaro.nrBa.t"lo-
anJ
QS.1o;'Onay : Yukandaki imzalann, aft gegen dgetim tiyelerine ait oldugunu onaylanm.
Tez Savunma
Tarihi
:2011720fiMezuniyetTarihi
:0610112011Prof. Dr. Mehmet $EN
LIST OF TABLES ... iii LIST OF FIGURES ... iv ABBREVIATIONS... v ÖZET ... vi SUMMARY ... vii INTRODUCTION ... 1 CHAPTER 1 INTERNATIONAL ECONOMIC UNIFICATIONS THEORIES, CUSTOMS UNION THEORIES, THE ANALYZE OF FOREIGN TRADE BETWEEN TURKEY and EU 1.1 International Economic Unifications Theory... 3
1.2 Types of Economic Integration ... 4
1.3 Customs Union Theory ... 6
1.3.1 Contributions Before Viner ... 6
1.3.2 Contributions During Viner ... 7
1.3.3 Contributions After Viner ... 7
1.4 The Economic Relations Between Turkey and the European Union: Before and After the Customs Union ... 11
1.4.1 The Current Situation of Turkish Foreign Trade ... 13
1.4.2 The Effects of Customs Union on Foreign Trade... 15
CHAPTER 2 INDUSTRIAL RELATIONS and AUTOMOTIVE SECTOR IN TURKEY 2.1 Automotive Sector in Import Substitution for Industrialization ... 30
2.2 Assembly Industry Directive and the Effects on Automotive Industry ... 31
2.3 The Foundation of Tofas and Oyak-Renault Manufacturing Plants ... 31
2.4 The Case of Automotive Sector after Customs Union ... 32
2.5 Strengths and Weaknesses of the Sector ... 35
2.6 Opportunities and Threats of the Sector ... 35
CONCLUSION ... 37
BIBLIOGRAPHY... 41
CURRICULUM VITAE ... 45
LIST OF TABLES
Table 1.1 Foreign Trade of Turkey Between 1967-1995 (million USD) ... 16
Table 1.2 Foreign Trade of Turkey Between 1995-2006 (million USD) ... 17
Table 1.3 Sectoral Breakdown of Turkey-EU Trade (million USD) ... 19
Table 1.4 EU-Turkey Trade (Commodity Groups) (million USD) ... 23
Table 1.5 Turkey’s Trade by Country Groups ... 26
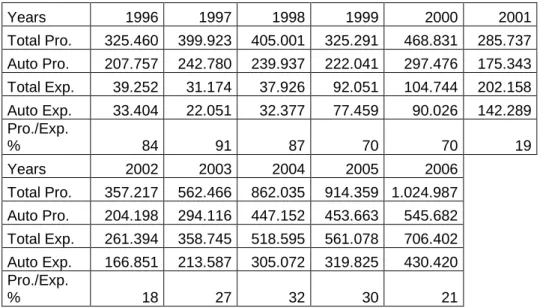
Table 2.1 Automobile Production/Export ... 33
Table 2.2 The Production Capacities of the Companies and the Shares ... 34
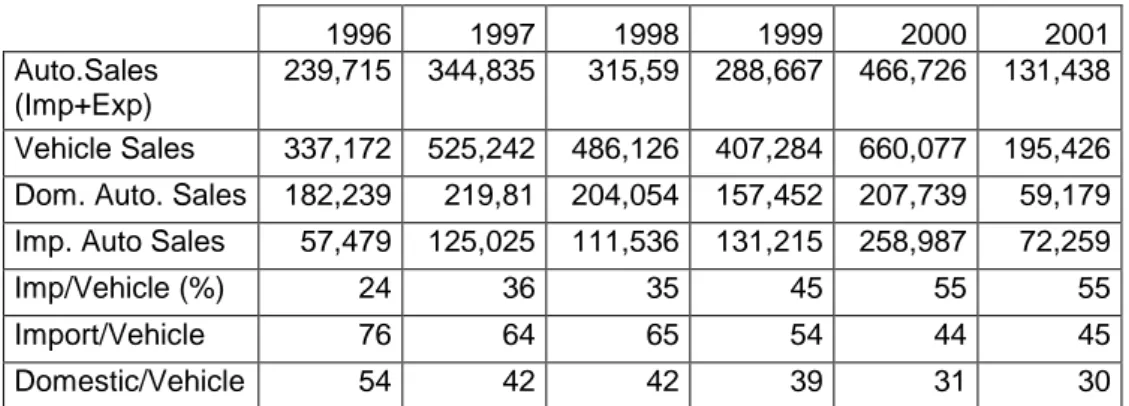
Table 2.3 Automotive Sector Sales in Years ... 34
Table 2.4 Strengths and Weaknesses of the Sector ... 35
LIST OF FIGURES
Figure 1.1 Volume of Foreign Trade in Turkey ... 14 Figure 1.2 Import and Export Volume in Turkey ... 14 Figure 2.1 Automobile Production/Export (1996/2006) ... 33
ABBREVIATIONS
Turkish English
DIE Devlet İstatistik Enstitüsü State Institute of Statistics DTM Dis Ticaret Müstesarligi Under secretariat of the Prime
Ministry for Foreign Trade
ECSC Avrupa Kömür ve Çelik Topluluğu European Coal and Steel Community EFTA Avrupa Serbest Ticaret Birliği European Free Trade Association
EU Avrupa Birliği European Union
MFA Dış İşleri Bakanlığı Ministry of foreign affairs
IKV İktisadi Kalkınma Vakfı Economic Development Foundation TÜSIAD Türk Sanayicileri ve İşadamları Derneği Turkish Industrialists' and
Businessmen's Association OECD Ekonomik İşbirliği ve Kalkınma Teşkilatı Organization for Economic
Cooperation and Development
OSD Otomotiv Sanayi Derneği Automotive Manufacturers
Association ÖTV
ÖZET
Otomotiv sanayi, diğer sanayi dalları ve ekonominin diğer sektörleri ile olan ilişkilerinden dolayı ekonominin lokomotifi kabul görmekte ve aynı zamanda istihdam yaratma gücü, üretim potansiyeli ile dünya ekonomisinde önemli bir yer tutmaktadır. Sektör, demir-çelik, Petro-kimya, lastik gibi temel sanayi dallarında ve başka birçok dallarda başlıca alıcı ve bu sektörlerdeki teknolojik gelişmenin de sürükleyicisidir. Sektör, gerçek ve güvenilir vergi geliri sağlayan sektörlerin başında gelmektedir.
Son 50 yıllık süreçte Türkiye’nin en önemli ulusal hedeflerinden birisi Avrupa Birliği tam üyelik sürecini başarı ile tamamlamaktır. Türkiye ve AB arasındaki bu süreç 1963 yılında Ankara Antlaşması ile başlamıştır. Gümrük Birliği ile ilgili sürecin temelleri 1970 yılında imzalanan ve 1973 yılında yürürlüğe giren katma protokol ile atılmıştır.
AB ile Türkiye arasındaki Gümrük Birliği Antlaşması 1995 yılında imzalanmıştır. Gümrük Birliği üyeliği birçok uzman tarafından tam üyelik sürecinde önemli bir aşama olarak görülmektedir. Burada dikkat edilmesi gerek konu, Türkiye üyelik sürecini tamamlamadan Gümrük Birliği’ne üye olan tek ülkedir.
Bu çalışmanın amacı Gümrük Birliği’nin Türkiye’nin dış ticareti üzerinde etkilerini Türk otomotiv sektörünü temel alarak incelemektir.
SUMMARY
A STUDY ON THE EFFICIENCY OF FOREIGN TRADE BETWEEN TURKEY and EU CUSTOMS UNION: BEFORE and AFTER
In the last 50 years Turkey’s one of the main aim is to reach a full membership in the European Union. The relations between Turkey and European Economic Community (later on European Community (EC) and European Union (EU)) have begun in 1963 with Ankara Agreement. The origins of the custom union were established with Added Protocol, which was signed in 1970 and enacted in 1973.
The Customs Union Agreement between Turkey and EU was signed in 6 March 1995.The membership in Customs Union is realized as an important step for Turkey on the membership to European Union. The key importance about the customs union between Turkey and EU is, Turkey is the first country to be a member of the Customs Union without a membership to the EU.
The aim of this study is to test the effects of Customs Union on general and sectoral (automotive) foreign trade between Turkey and EU member states.
From the results the effectiveness and necessity of the Turkish membership within the Customs Union are examined. Further on we may have the opportunity to answer if the membership of Turkey within the Customs Union was approval before the accession of the country.
Today, with the increasing world trade volume and stronger competition, the companies are aimed to improve their share in the market. To survive in this competition, companies should be successful in international area. Form these situations developed and developing countries started to give more attention to their economic securities. Under globalization process, in international market, the barriers like product and quantity restrictions are reduced and regional integrations become stronger.
In the origin of economic unifications, the aim is to reduce the diversification levels between national economies and supply wider markets to benefit from more opportunities of big production and scale economy.
In the last 50 years Turkey’s one of the main aim is to reach a full membership in the European Union. The relations between Turkey and European Economic Community (later on European Community (EC) and European Union (EU)) have begun in 1963 with Ankara Agreement. The origins of the Customs Union were established with Added Protocol, which was signed in 1970 and enacted in 1973.
The Customs Union Agreement between Turkey and EU was signed in 6 March 1995.The membership in Customs Union is realized as an important step for Turkey on the membership to European Union. The key importance about the customs union between Turkey and EU is, Turkey is the first country to be a member of the Customs Union without a membership to the EU.
EU-Turkey relations have been officially continuing for 46 years. It all started with Turkey’s application for membership to newly founded European Economic Community (EEC). The most important outcome of this relationship, putting aside the decision to start negotiations, was the completion of customs union. It took 32 years from 1963 to 1995 for EU and Turkey to construct the infrastructure. The customs union between EU and Turkey is a unique one among the similes because of two reasons. It is structurally different from a customs union in the classical sense that it is not only elimination of customs duties, quotas and application of common customs levels against third countries but also it includes the harmonization of all the measures that can affect trade directly or indirectly. The second distinction is, Turkey although has to fulfill necessary obligations, does not have the right to
take part in decision-making mechanisms because she is not a full member. The customs union is the last phase of the three-stage integration model foreseen on the Ankara Agreement, which constitutes the legal basis of the partnership between EU and Turkey.
The purpose of this thesis is to study the effects of EU-Turkey Customs Union on Turkish Foreign Trade in terms of selected parameters and to make a general evaluation on whether it is effective for Turkey or not. In the thesis, first, regional integrations and customs union theories are briefly examined, then the development of relations between EU-Turkey is detailed and finally the effects of customs union is discussed, with an additional part covering the effects of customs union on automobile sector.
From these results the effectiveness and necessity of the Turkish membership within the Customs Union are examined. Further on we may have the opportunity to answer if the membership of Turkey within the Customs Union was approval before the accession of the country.
CHAPTER 1
1 INTERNATIONAL ECONOMIC UNIFICATIONS THEORIES, CUSTOMS UNION
THEORIES, THE ANALYZE OF FOREIGN TRADE BETWEEN TURKEY and EU
1.1 International Economic Unifications Theory
Today, with the increasing world trade volume and stronger competition, the companies are aimed to improve their share in the market. To survive in this competition, companies should be successful in international area. From these situations, developed and developing countries started to give more attention to their economic securities. Under globalisation process, in international market, the barriers like product and quantity restrictions are reduced and regional integrations become stronger.
To avoid negative effects of globalization like improved trade volume and international competition, we may see more regional integrations. These unifications can be like World Trade Organization (WTO) on global scale or like European Union, which is a regional formation.
Instead of the basics of economics the publishing of Adam Smith’s “Wealth of Nations” (1776) forms the basis of international trade theory. Smith (1776 – 1937), expresses the free trade and international specialization with the theory of absolute advantage and in basic two country model he clarifies that each country should be specialized with the products that they produce at low cost and should import other products.
Ricardo insists on the differences of production costs of countries so he thinks that to depend on the absolute advantage for international trade will restricts the frame and instead of this approach he refers comparable advantages. To this idea, even a country is strong on all products, with comparison the country can import the products that it produces with more advantages the country may have more welfare. Later on neoclassic economists, without changing the basics of Ricardo model, they revised the model with adding factors like labour costs, which creates a new concept called “alternative cost”
In the beginning of 20th century, the theory of comparative advantages was the common approach in foreign trade theory. But the theory does not insist on the differences occurred in labour productivity and it does not answer the reasons for domestic price differences. That was a subject for Hackscher and Ojlin to give important additions for foreign trade theory. To
Heckscher – Ohlin theory the countries will have this comparative advantage on the products that are used intensively and produced with rich production factor.
In the middle of 20th century Leontief made the cross-industrial economy analyse using 1947 USA’s input-output tables and tested Factor Endowment Theory. At the end of his works, instead of his expectations, a rich capital country USA analysed as a country that imports capital intensive products whereas it exports labour intensive products. This situation was also named as “Leontief Paradox” which caused many theories to be created. At the end of 90’s, economists like Krugman1
(1980), Helpman and Grossman improved the traditional trade theory and improved it with insisting on scale economies and decreasing costs which was named “International Trade Theory”. According to this new theory technological development, qualified labour force and R&D are important assets.
In the origin of economic unifications, the aim is to reduce the diversification levels between national economies and supply wider markets to benefit from more opportunities of big production and scale economy (Uyar2, 2000).Karluk defines the economic unifications as “To provide free movement of service and products between the countries that go for economic unification and to make a common market with abolishing all barriers that bind products and trade.
1.2 Types of Economic Integration Preferential Tariff Agreement
The rates of tariffs on trade among participating countries are lower compared toRate of tariffs on trade charged with third countries.
Free Trade Areas
It is an agreement among countries about the elimination of all tariff and quantitative restrictions on mutual trade. Every participating country retains its own tariff and other regulation of trade with third countries. The basis of this agreement is the rules of origin. These rules prevent trade deflection, which is import of goods from third countries into the area by a country that has a relatively lower external tariff than the partner country, in order to re-export the good to partner country. European Free Trade Area (EFTA) constitutes a good example of free trade areas.
1 Krugman, P.; 1980. “Scale Economies, Product Differentiation, and the Pattern of Trade”, American Economic Review, 70, 950-959
Customs Union
Trade agreement by which a group of countries charges a common set of tariffs to the rest of the world while allowing free trade among them. It is a partial form of economic integration, intermediate between free-trade zones, which allow mutual free trade but lack a common tariff system, and common markets, which both utilize common tariffs and allow free movement of resources including capital and labor between members. Well-known customs unions include the Zollverein, a 19th-century organization formed by several German states under Prussian leadership, and the European Union, which passed through a customs-union stage on the path to fuller economic integration.
Common Market
The idea of a common market grows from the possibilities presented by the adoption of a common external tariff. As trade flows increase and factor inputs imported into the integrating economies begin to circulate freely, production chains crossing the intra-regional national boundaries begin to form. Apart from customs union, free mobility of factors of production exists. Common regulations and/or restrictions on the movement of factors with the third countries are introduced. That is common market consists of an internal market and common external regulation for both products and production factors. The European Community (EC) was an example for common market.
Monetary Union
The currencies of the participating countries are linked through irrevocably fixed exchange rates and are convertible or one common currency circulates in all participating countries. Capital movements within the area are free. The EU is a typical example for monetary union.
Economic Union
An agreement between two or more countries that allows the free movement of capital, labor, and all goods and services, and involves the harmonization and unification of social, fiscal, and monetary policies.
Total Economic Union
It is a partial form of economic integration that offers an intermediate step between free-trade zones (which allow mutual free free-trade but lack a common tariff system) and common markets (which, in addition to the common tariffs, also allow free movement of resources such as capital and labor between member countries).It combines the characteristics of the
economic and the monetary union. There is a single economic policy and supranational government with great economic authority. (Molle3, 1998).
1.3 Customs Union Theory
In the literature of economic integration Jacob Viner is accepted as a milestone. Also instead of the contributions for customs union literature after Viner, we may see previous contributions before Viner. While presenting the Customs Union literature the subject will be divided regarding to Viner.
1.3.1 Contributions Before Viner
In customs union literature the contributions before Viner are seldom mentioned. However like the intellectuals, Smith (1776), Ricardo (1817), McCulloch (1832) and List (1885) were interested in customs unions, they could never reach Viner’s contributions. These classical economists were generally interested in the effects of preferential trade agreements. About the economic integrations, Smith (1776), Ricardo (1817) and McCulloch (1832) insisted on only in Methuen Agreement signed in 1703 about the effects of trade deflection. On the other hand List (1885) suggested that customs unions are tools that protect infant industries.
De Beers (1941) systematically discussed the customs union before Viner. He suggested that federal unions and customs unions look familiar in the matter of international and national trade. According to De Beers, almost all federations, federal unions and similar unions have two objects as economic and political. The economic objects of federal unions also involve the customs union (De Beers4, 1941:49-50).
During the studies of De Beers, it was suggested that customs union would evolve all around the world and at the end the world would be one customs union. To another statement, there was a common idea that customs union was an important step for the trade liberalization around the world. Regarding to that ideology, the increase of customs unions should bring the worldwide trade liberalization (Robson5, 1993).
De Beers (1941) reached some results that were not appropriate for that period’s overruling idea. According to De Beers, while the customs unions are removing the tariffs and
3 Molle, William; 1998 “ The Economics of European Integration”. p. 8-12 4 De Beers, John ; 1941 “Tariff Aspects of a Federal Union,” p. 49-50 5 Robson, P.;1993, “The Economics of International Integration”
barriers; if the restrictions that are applied to the third countries are more than existing ones, the barriers against the world trade will be more instead of expected results (De Beers6, 1941)
Another intellectual before the Viner period was Frank William Taussig. He rather made studies about the tariffs and he mentioned the customs union temporary. Taussig mentioned that in 1800’s, to protect the production, European Countries developed a customs union against their competitors like America and other countries (Taussig7 1903).
Torrens (1844) suggested that multilateral tariff negotiations have negative effects on tariffs so that bilateral tariff negotiations should be preferred instead of multilateral tariff negotiations (Dura and Atik8, 2003).
Also Adam Smith mentioned the benefits of economic integration. According to Smith; if a country binds itself with an agreement that allows the import of a nation’s products from another country or dispense a country from a tax which is applicable to other countries, may benefit from this agreement or at least that country’s favored traders or producers will benefit from it (Smith 1776).
1.3.2 Contributions During Viner
The period before Viner, the overruling idea about customs union was that, it was accepted as a movement towards to the free trade. The idea that free trade would maximize the world’s prosperity causes a result that supports the customs unions. In this connection GATT (former WTO) exempted the free trade areas and customs union from 24. Articleand showed its support to this concept. Viner (1950) and Bye (1950) introduced that customs union is never equal to free trade. Before their studies, it was accepted that free trade areas and customs unions would occur free trade. The studies of Viner and Bye were on the same period but we see that the literature was based on Viner9 (1950).
1.3.3 Contributions After Viner
After Viner, the articles about the critiques and contributions about customs union theory are reasonably wide. Under these circumstances the intellectuals that have more important contributions for this topic were examined.
6 De Beers, John ; 1941 “Tariff Aspects of a Federal Union,” p. 91-92
7 Taussig, William Frank; 1903, “The Enf of Sugar Boundries” The Quarterly Journal of Economics, p.103, 133-134. 8 Dura, Cihan and Atik; 2003, “European Union Customs Union and Turkey”
The first critiques towards to Viner´s studies are that this analyse only insisted on the effects of customs union on production and the no information was given about the effects on consumption. Meade (1955), Gehrels (1956-1957), Lipsey (1957) and (1960), Jonson (1965) and (1974), Cooper and Massel (1965) and by some others this missing part was specified and required contributions were made.
Meade (1955), explained that in Viner´s model the products subjected to trade were intensified on domestic substitute –production effect- and he mentioned that the substitution of products –consumption effect- were not included in the analyse, so that he added the consumption effect to the analyse (Kreinin and Plummer10, 2002).Also, Meade suggested that like standard foreign models, it can´t be always spoken for constant costs on production (Dura and Atik11, 2003:).
However, Lipsey (1960) and Michaely (1965) mentioned that under variable and constant costs customs union may improve the prosperity within the customs union.
Gehrels12 (1956-1957) and Lipsy13 (1957) figured out that even if the trade deficit is higher than the merchandising, customs union may increase the public prosperity. This different approach which is totally contradiction to Viner´s (1950) studies, because of that Viner did not add the consumption effects to his analyse.
One of the most important contradictions after Viner, which is generalised from Meade´s (1955) “second best theory”, belongs to Lancaster and Lipsey (1956).Regarding to this theory, perfect competition and free trade is the “first best policy” to take the world’s prosperity to the highest level. However, in real world, like custom tariffs, there are barriersagainst the free trade. To balance these barriers, other barriers as precaution should be applied for the prosperity of the country. This one is named as “second best policy”. The best second theory introduces the ground for the foundation of the customs union.
10 Kreinin, Mordechai and Plummer; 2002, “Economic Integration and Development” 11 ibid
12 Gehrels, F,; 1957 “Customs Union from Single-Country View-Point” p.61-64 13 ibid
Another subject that is discussed in the literature was that the countries should be competitive or complementary to benefit from the customs union more. Viner (1950) explained that complementary between the members within the customs union probably will cause loss and the competitiveness will cause profit. Makeower and Morton (1953) defined the relation of complementary or competition due to the similarity of demand or costs.The countries that have similar costs are defined as competitive countries, with different costs as complementary countries. Makeower and Morton (1953) based on that definitions and objected the Viner´s explanation. They mentioned, it is so clear that the income will be more if the countries are complementary. In literature, there is no common idea for which union can be more beneficial.
In literature another topic discussed, was the comparison of unilateral tariff discount with customs union. Cooper and Massel14 (1965) compared unilateral tariff discount with customs union and they claimed that at least for a country, unilateral tariff discount is better than customs union. This study caused the discussion whether customs union or unilateral tariff discount would conduce efficient distributions of resources.
Wonnacott and Wonnacott15 (1981), with the 3-country general equilibrium analysis, reached a conclusion which is totally controversial to Cooper and Massel16 (1965).Regarding to their conclusion customs union is more advantageous than unilateral tariff discount.Wonnacott and Wonnacott17 (1981) criticized the previous studies from two perspectives; exaggeration of cost reduction effect caused from the tariff discounts and improvement of the advantages of external markets as less important than it is.
Wonnacott and Wonnacott (1981) criticized that unilateral tariff discounts may sometimes seem above the customs union but sometimes seem weaker. According to Wonnacott and Wonnacott, under the conjuncture where the trade capacities are constant with the rest of the world, unilateral tariff discounts are above than the customs unions.
Conway, Appleyard and Field (1989) emphasized that with the unilaterall tariff discount situation, while the price distortions are removed there is a disclaiming from the income and in case of any trade agreements, common external tariff is protected.
14 Cooper C. And Massel B.; 1965 “A New Look at Customs Union Theory” p.741-747
15 Wonnacott Paul and Ronald; 1981 “Is Unilateral Tariff Reduction Preferable to a Customs Union? The Curious Case of the Missing Foreign Tariffs” p.704-714
16 ibid 17 ibid
However El-Agraa (1999) and (2002), El-Agraaa and Jones (2000a) and (2000b), Kreinin and Plummer emphasized that there are no common custom tariff in Wonnacott and Wonacott (1981)´s customs union models. They evaluate this study as insufficient. In this study in can´t be spoken about the tariffs from the third countries to the customs union and also there are information about the transformation costs.
Another important contribution to the customs unions literature is about the effects of customs union on trade rates. Mundell (1964), Arndt (1968), Vanek (1965) and Wonnacott and Wonnacott18 (1981) analyzed the effects of customs union on trade rates by using offer curve. Petith (1977) analyzed the the trade rates between the EU and rest of the world. He came to a point that the improvement on trades rates are one of the vital economic effect for the European Integration. With this approach Petith (1977) claimed that the effects of integration on the trade rates could be a reason for economic integration - based politics.
Brwon (1987) analysed the literature on the composition of empirical works related to the effects of integration models between the developed and developing countries. In that literature, despite the bad results of trade rates, final results occurred trade creation effects. According to Brown this effect is insufficient regarding limited product diversity. In addition to this, the studies involved in literature have not enough evidence, to confirm the final results of integrations as a support to infant industries.
According to El Agraa (1999), in the beginning the developing countries should produce the products, from which they have competition advantage and which have supplementary role in the customs union. This will improve the trade between the developing countries. However most of these countries could not meet the conditions and the results of their integration caused the effect of trade deflection. As a result, the studies about the economic integration of developing countries showed us the economic integration in developed world and the economic integration in developing world are different matters. The reasons like insufficient market size and different economic structures in developing countries cause to handle economic integration under these conditions.(El Agraa19, 1999).
18 ibid
Viner approach decays the idea which supports the regional integrations as a tool for world wealth improvement, since the trade between member and the third countries is effected from the trade deficit negatively. Kemp and Wan (1976) and Ohyama (1972), pictured that while the third countries are standing at the beginning of the wealth member states can always gain the improvement of wealth with the customs union form Bhagwati and Panagariya20.But this result is only valid if the trade rate does not change after unification.
Instead of trade creation and trade deficit effects of customs union, Corden21 (1972) reached results like cost reduction and trade suppress effects. They have supplemental characteristics for trade creation and trade deficit effects. Corden emphasized that the first effect has more importance and he defined the cost reduction effect that causes increase on demands and price decrease in scale economies to supply the increased demand.
1.4 The Economic Relations Between Turkey and the European Union: Before and After the Customs Union
In the 20th century, countries involved in various economic variations in order to avoid competition brought by globalisation. Turkey joined the Council of Europe after the Second World War and applied EEC for association in 31st July 1959. Following period by the approval of the Council of Ministers, the EU – Turkey Association relations started with Ankara agreement signed in 12th September 1963 (enacted in 1st December 1964).The final objective of association agreement is full membership of Turkey within the European Union. The agreement was composed of three periods as preparation, transition and final period. The Customs Union was planned to be established till end of the transition period. After the preparation period as provided in the agreement, the Added Protocol was signed in 13th November 1970 (enacted in 1973) in order to define the provisions and liabilities of the parties.
During the 70´s, the EU – Turkey relations passed difficult durations regarding to political instability. Turkey couldn´t cope with its provisions from the Ankara Agreement. The relations were stopped due to military coup in 12 September 1980. This situation continued till the second term of 80´s. Later on, under the support of economic and politic developments Turkey applied for the membership in 14th April 1987. Meanwhile the postponed tax convergence and reduction plan was put in process.
20 Ibid
EU Commission confirmed Turkey´s membership proposal and recommended to keep the relations under the Association Agreement till the completion of the union´s deepening process and for the next enlargement. During this period the Commission also recommended to accomplish the customs union process with Turkey. This recommendation was also evaluated positively by the Turkish Government and required preparations were started in order to comply the conditions of customs union, which was anticipated in Added Protocol, till 1995. After 2 years of negotiations regarding to the Association Councils Decision on 5thMarch 1995, the Customs Union between Turkey and the European Union was put in force on 1st January 1996.
As far as the free movement of manufactured goods is concerned, applying the internal market rules constitutes comparatively little change. Due to the existing customs union between Turkey and the EU, trade in manufactured goods is already liberalised to a large extent. Certainly, through the adoption of EU norms and standards by Turkey and the abolishing of still existing impediments to trade, especially in services, the conditions for growing exports and imports between Turkey and the EU will be further improved. But this effect will presumably be small. Moreover, the adoption of EU norms and standards will cause costs for Turkish enterprises, thus hampering their competitiveness at least in the short run. As far as the free movement of capital is concerned, no general rule has impeded flows across the borders between Turkey and EU in recent years. Nevertheless, the potential for foreign direct investment from EU countries seemed to be underused. Thus, through the extension of the internal market to Turkey more legal certainty for investors from EU countries will be created. This will also improve the conditions for an intensified division of labour between the EU and Turkey with positive effects on welfare and income within the integrating area. One very important change caused by the extension of the internal market to Turkey will be the free movement of people. Until now migration between the member states and Turkey is strictly regulated. Abolishing all impediments to cross-border movements of people will mean a substantial change for both Turkey and the member states. However, it is not very probable that the free movement of people will be granted to Turkey at the moment of its accession. In the case of the East European states which joined the EU in 2004, the old member states have been allowed to restrict immigration from these countries for up to seven years. It seems very probable that EU membership of Turkey would include similar regulations for a certain period. If the free movement of people between Turkey and the
incumbent states were generally excluded, a constitutional principle of the internal market would be violated. In this case Turkey probably would not be granted full membership
Before analyzing this relation we have to decide the current position of Turkey in world order. With the records of International Monetary Fund Turkey is considered to be realized as a developing country, which is not welcomed by politicians in the country. Regarding to Jeffrey Garten, who was the undersecretary of commerce under Clinton goverment.In1997 in his book "The Big Ten: The Big Emerging Markets and How They Will Change Our Lives" he considered Turkey as one of these countries. On the other hand Turkey is a candidate country which totally changed its status on the relationship with the EU. We have to look at this relation under customs union. However we should remind that regarding to IMF, Turkey is still a developing country, which may slow down the convergence on Automobile Sector.
Relations between Turkey and the European Community are thus considered in a relatively static manner. Above all, they are the product of and shaped by the international context. Certain analyses factor in the domestic variable, but only capture it from the point of view of an independent variable or structural datum influencing the definition of foreign policy.
1.4.1 The Current Situation of Turkish Foreign Trade
Regarding to the financial results, we may say that customs union was a milestone for Turkish foreign trade. While evaluating the economic indicators, the economic structure of the country and the economic developments in the world should also be added to the interpretation. Otherwise to relate all the changes with the customs union will give unreliable results.
With the 24th January 1980 Decisions Turkey forwarded to export based policy instead of import-substitute policy. With the time exchange of money policy was liberalised and in 1989 with the convertibility financial liberalisation was completed. This process improved the variety and volume of the capital and supported to finance the big increase in importing which caused decays in foreign trade rates. While 1991 Gulf Crisis, 1997-1998 Asia Crisis have affected all world economy, the domestic crisis in Turkey in 1994 and 2001 affected the economy seriously.
Regarding to the followed policies the structure and value of import has been changed. Agricultural products and raw materials were given their place to industrial products with high added value. Since 1990´s, it is seen that the export level to the EU countries is getting higher than the export level to the non EU countries.
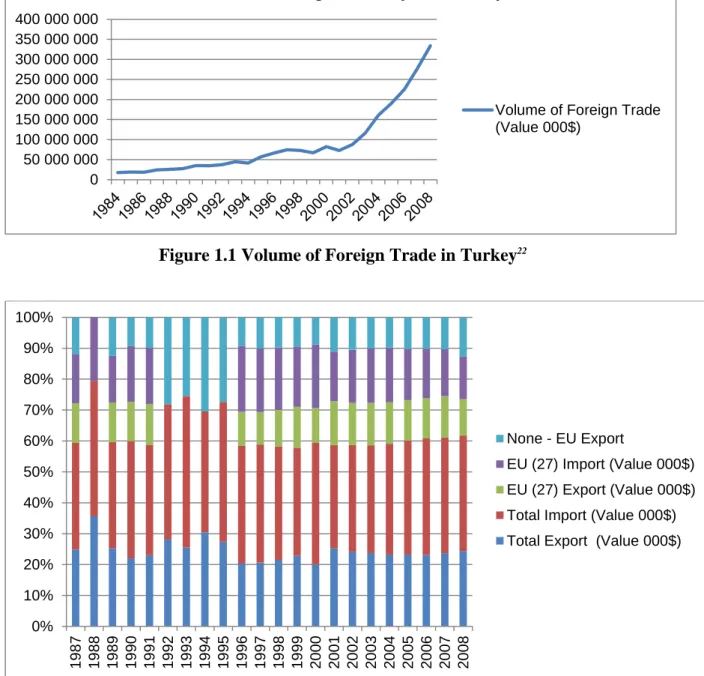
Figure 1.1 Volume of Foreign Trade in Turkey22
Figure 1.2 Import and Export Volume in Turkey23
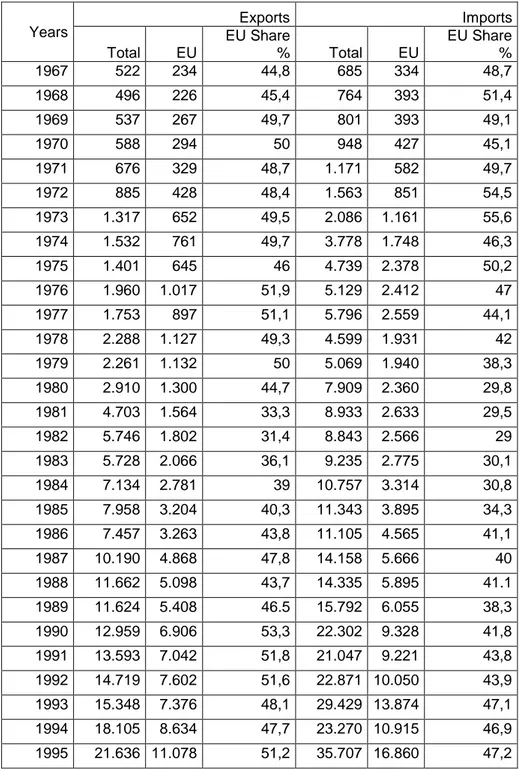
As seen on Figure 1.1 and Figure 1.2 it is proved that customs union cannot overrule the conditions of Turkish Foreign Trade. Before 1996, the import value from EU countries seemed to continue with lower rates than the import from the third countries. But soon as expected after following years of the customs union the opposite situation has been seen, however in final years the old trade affinity has come back.
22
Source: Retrieved September 10.2009 on the World Wide Web. URL:http://www.turkstat.gov.tr 23
Source: Retrieved September 10.2009 on the World Wide Web. URL:http://www.turkstat.gov.tr
0 50 000 000 100 000 000 150 000 000 200 000 000 250 000 000 300 000 000 350 000 000 400 000 000
Volume of Foreign Trade (Value 000$)
Volume of Foreign Trade (Value 000$) 0% 10% 20% 30% 40% 50% 60% 70% 80% 90% 100% 19 87 19 88 19 89 19 90 19 91 19 92 19 93 19 94 1 9 9 5 19 96 19 97 19 98 19 99 20 00 20 01 20 02 20 03 20 04 20 05 20 06 20 07 20 08 None - EU Export EU (27) Import (Value 000$) EU (27) Export (Value 000$) Total Import (Value 000$) Total Export (Value 000$)
1.4.2 The Effects of Customs Union on Foreign Trade
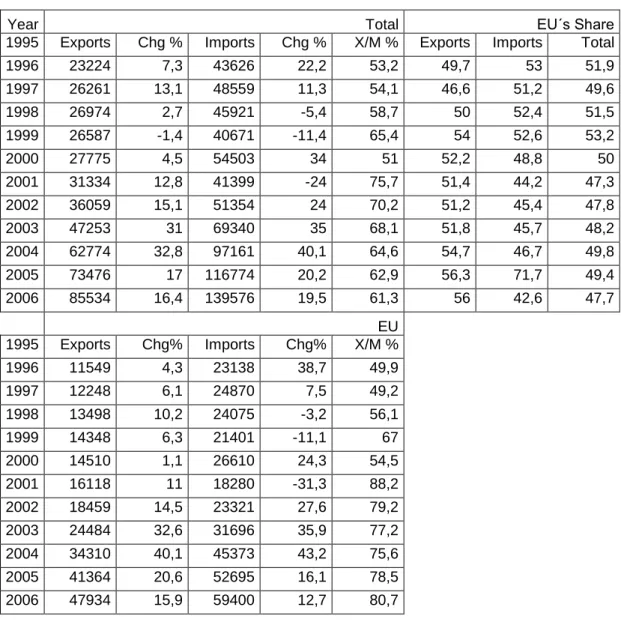
Customs Union integrated Turkish economy to one of the important trade blocks in the world. This integration led Turkey to access the EU market with more favourable conditions compared to other countries. On the other hand Turkey opened her market to the EU‟ s and other countries‟ competition. It has been nearly 15 years that the Customs Union Decision was taken and more than 14 years since it has been entered into force. Within this period some positive and negative effects of customs union have been observed. This part of the paper aims to examine relatively observable and/or measurable results of the customs union from an objective aspect. The EU is the most third crowded land after China and India with 459 million population. The EU is also one of the biggest economies in the world. It is GDP in 2003 was €10.000 billion. The total intra trade volume in 2003 was €1.800 billion.(EC, 2004) The EU had 20% in total world trade in 2002 sharing the first place with the US.(EC, 2004). The most important trade partner for Turkey is the EU, around 40-50% of share in total trade volume. This is not something new; the EU has been Turkey’s most important trade partner not only after 1995, but more than 40 years. Table 1.1, shows the detailed trade figures of Turkey, between 1967 and1995. It shows a persistence increase in both exports and imports between the EU-Turkey. From 1967 to 1995 Turkey’s volume of exports increased by 4.045%, whereas in the same period Turkey’s exports to the EU increased by 4.634%. The situation for imports is 5.113% and 4.948% respectively. The average share of the EU in Turkey’s exports and imports, and total volume of trade during the same period is 47%, 42% and 44% respectively.
Table 1.1 Foreign Trade of Turkey Between 1967-1995 (million USD) 24
Years Exports Imports
Total EU EU Share % Total EU EU Share % 1967 522 234 44,8 685 334 48,7 1968 496 226 45,4 764 393 51,4 1969 537 267 49,7 801 393 49,1 1970 588 294 50 948 427 45,1 1971 676 329 48,7 1.171 582 49,7 1972 885 428 48,4 1.563 851 54,5 1973 1.317 652 49,5 2.086 1.161 55,6 1974 1.532 761 49,7 3.778 1.748 46,3 1975 1.401 645 46 4.739 2.378 50,2 1976 1.960 1.017 51,9 5.129 2.412 47 1977 1.753 897 51,1 5.796 2.559 44,1 1978 2.288 1.127 49,3 4.599 1.931 42 1979 2.261 1.132 50 5.069 1.940 38,3 1980 2.910 1.300 44,7 7.909 2.360 29,8 1981 4.703 1.564 33,3 8.933 2.633 29,5 1982 5.746 1.802 31,4 8.843 2.566 29 1983 5.728 2.066 36,1 9.235 2.775 30,1 1984 7.134 2.781 39 10.757 3.314 30,8 1985 7.958 3.204 40,3 11.343 3.895 34,3 1986 7.457 3.263 43,8 11.105 4.565 41,1 1987 10.190 4.868 47,8 14.158 5.666 40 1988 11.662 5.098 43,7 14.335 5.895 41.1 1989 11.624 5.408 46.5 15.792 6.055 38,3 1990 12.959 6.906 53,3 22.302 9.328 41,8 1991 13.593 7.042 51,8 21.047 9.221 43,8 1992 14.719 7.602 51,6 22.871 10.050 43,9 1993 15.348 7.376 48,1 29.429 13.874 47,1 1994 18.105 8.634 47,7 23.270 10.915 46,9 1995 21.636 11.078 51,2 35.707 16.860 47,2
There are some important subjects that must be taken into account seriously before going into details of the effects of the customs union on the foreign trade of Turkey. First, we cannot ignore the changes in Turkish and world economy. The 1994 crisis and the problems created by devaluation, Asia and Russia crises in world economy in 1997,the stagnation in Turkish
24
economy in 1998, the earthquake in 1999, the crises on November 2000 and February 2001, the positive effects of decrease in inflation and interest rates on costs. All of these directly affect the performance of foreign trade. Second, the harmonization of technical procedure. The precondition of trading with the EU is to apply EU‟ s rules, which covers standards, technical requirements, environment conditions etc. If related legislation is not applied then there is no reason to expect positive progress on trade relation with the EU. Third, it should not be forgotten that Turkey started enjoying tariff free trade, except for some products, in 1971, however the EU started it in 1996 onwards. The amount of exports to the EU increased by 45,6% from 1970 to 1972 and by 158,8% from 1970 to 1974. Keeping in mind these will enable more accurate and objective analysis.
Table 1.2 Foreign Trade of Turkey Between 1995-2006 (million USD) 25
Year Total EU´s Share
1995 Exports Chg % Imports Chg % X/M % Exports Imports Total 1996 23224 7,3 43626 22,2 53,2 49,7 53 51,9 1997 26261 13,1 48559 11,3 54,1 46,6 51,2 49,6 1998 26974 2,7 45921 -5,4 58,7 50 52,4 51,5 1999 26587 -1,4 40671 -11,4 65,4 54 52,6 53,2 2000 27775 4,5 54503 34 51 52,2 48,8 50 2001 31334 12,8 41399 -24 75,7 51,4 44,2 47,3 2002 36059 15,1 51354 24 70,2 51,2 45,4 47,8 2003 47253 31 69340 35 68,1 51,8 45,7 48,2 2004 62774 32,8 97161 40,1 64,6 54,7 46,7 49,8 2005 73476 17 116774 20,2 62,9 56,3 71,7 49,4 2006 85534 16,4 139576 19,5 61,3 56 42,6 47,7 EU 1995 Exports Chg% Imports Chg% X/M % 1996 11549 4,3 23138 38,7 49,9 1997 12248 6,1 24870 7,5 49,2 1998 13498 10,2 24075 -3,2 56,1 1999 14348 6,3 21401 -11,1 67 2000 14510 1,1 26610 24,3 54,5 2001 16118 11 18280 -31,3 88,2 2002 18459 14,5 23321 27,6 79,2 2003 24484 32,6 31696 35,9 77,2 2004 34310 40,1 45373 43,2 75,6 2005 41364 20,6 52695 16,1 78,5 2006 47934 15,9 59400 12,7 80,7 25
Table 1.2 shows the development of trade relations between the EU-Turkey after the customs union. From 1995 to 2006 Turkey’s volume of exports increased by 395%, whereas in the same period Turkey’s exports to the EU increased by 432%. Imports of Turkey and Turkey’s imports from the EU increased by 390% and 356%. The average share of the EU in Turkey’s exports and imports, and total volume of trade during the same period is 52%, 50% and 49% respectively. Total trade volume between the EU-Turkey increased from $27.758 million in 1995 to $107.334 million in 2006 with a 286% change. In 1996, the first year of customs union, the trade deficit between the EU-Turkey was $11.589 million in favor of EU. In 2006, the deficit is $12.006 million in favor of EU. Therefore, it is not correct to claim that customs union created trade deficit over the time. However, the overall foreign trade balance of Turkey without counting the trade with EU, the deficit increased from $8.469 million in 1996 to $42.576 in 2006 with 402% change. Exports of Turkey increased 295% between 1995-2006 from $21.636 million to $85.534 million, the highest amount of export of all times. Particularly from 2001 to 2004, Turkey increased the amount of exports by double. The increase in exports to EU is 210%, from $11.078 million to $47.934 million during between 1995 and 2006. The increase in exports to EU is 112,8% between 2001-2006. Like the general pattern in overall exports of Turkey, exports to the EU increase constantly. The imports on the other hand do not have a regular pattern. There are harsh up and downs, imports decreased in 2001 by 24%, following year increased by 24%. The level of imports is very sensitive to economic situation. All of these are also true for the level of imports from the EU. The amount of imports during 1995-2006 increased to $139.576 million from $35.707 million, with a 293% change. Imports from the EU increased from $16.680 million to $59.400 million. The X/M ratio in 2006 is 61,3% for total trade and 80,7% for trade with EU. The average X/M ratio for the period 1995-2006 is 62,2% and 68,5% respectively. Therefore, customs union did not create extra trade deficit so far; in fact, it improved the trade balance of Turkey. The EU‟ s imports from third countries decreased by 19% between 1995-2000. However, Turkey’s share of 1.7% did not change. In 2003 Turkey was the seventh biggest exporter to the EU with a 2.7% share. In case of exports, Turkey was the sixth biggest market that EU exported with a 3.3% share (EC, 2004)
These figures show Turkey’s exports to the EU increases constantly and rapidly than the general export trend of Turkey. Imports, on the other hand, are linked to the general economic conditions. There is no stable trend, it fluctuates with the economy. From EU‟ s aspect, Turkey’s role in overall EU trade seems to be settled. Import figures from Turkey, shows independent movement from the general economic conditions.
Customs union revealed competition conditions and market entry benefits. This led to a change in production scales and production composition. Finally, these changed the composition of exports of Turkey. Table 1.3 shows the sectorial distribution of exports of Turkey to the EU and imports from the EU between 1996 and 2006.
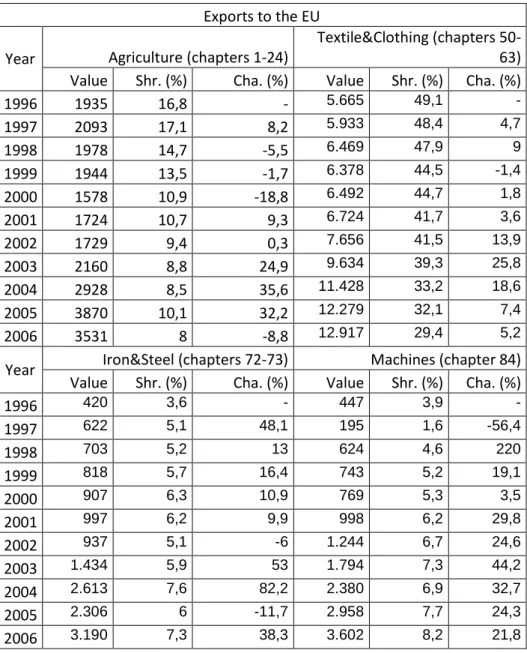
Table 1.3 Sectoral Breakdown of Turkey-EU Trade (million USD) 26 Exports to the EU
Year Agriculture (chapters 1-24)
Textile&Clothing (chapters 50-63) Value Shr. (%) Cha. (%) Value Shr. (%) Cha. (%)
1996 1935 16,8 - 5.665 49,1 - 1997 2093 17,1 8,2 5.933 48,4 4,7 1998 1978 14,7 -5,5 6.469 47,9 9 1999 1944 13,5 -1,7 6.378 44,5 -1,4 2000 1578 10,9 -18,8 6.492 44,7 1,8 2001 1724 10,7 9,3 6.724 41,7 3,6 2002 1729 9,4 0,3 7.656 41,5 13,9 2003 2160 8,8 24,9 9.634 39,3 25,8 2004 2928 8,5 35,6 11.428 33,2 18,6 2005 3870 10,1 32,2 12.279 32,1 7,4 2006 3531 8 -8,8 12.917 29,4 5,2
Year Iron&Steel (chapters 72-73) Machines (chapter 84) Value Shr. (%) Cha. (%) Value Shr. (%) Cha. (%)
1996 420 3,6 - 447 3,9 - 1997 622 5,1 48,1 195 1,6 -56,4 1998 703 5,2 13 624 4,6 220 1999 818 5,7 16,4 743 5,2 19,1 2000 907 6,3 10,9 769 5,3 3,5 2001 997 6,2 9,9 998 6,2 29,8 2002 937 5,1 -6 1.244 6,7 24,6 2003 1.434 5,9 53 1.794 7,3 44,2 2004 2.613 7,6 82,2 2.380 6,9 32,7 2005 2.306 6 -11,7 2.958 7,7 24,3 2006 3.190 7,3 38,3 3.602 8,2 21,8 26
Exports to the EU
Year Electronic Products (chapter 85) Automobiles (chapter 87) Value Shr. (%) Cha. (%) Value Shr. (%) Cha. (%)
1996 777 6,7 - 397 3,4 - 1997 911 7,4 17,2 263 2,1 -33,8 1998 1.325 9,8 45,4 298 2,2 13,3 1999 1.170 8,2 -11,7 948 6,6 218,1 2000 1.346 9,3 15 988 6,8 4,2 2001 1.433 8,9 6,5 1.692 10,5 71,3 2002 2.017 10,9 40,8 2.259 12,2 33,5 2003 2.572 10,5 27,5 3.708 15,1 64,1 2004 3.529 10,2 37,2 6.314 18,3 70,3 2005 3.950 10,3 11,9 7.075 18,4 12,1 2006 4.341 9,9 9,9 9.018 20,5 27,5
Imports from the EU Year Agriculture (chapters 1-24)
Textile&Clothing (chapters 50-63)
Value Shr. (%) Cha. (%) Value Shr. (%) Cha. (%)
1996 758 3,3 - 1.391 6 - 1997 566 2,3 -25,3 1.616 6,5 16,2 1998 535 2,2 -5,5 1.474 6,1 -8,8 1999 533 2,5 -0,4 1.375 6,4 -6,7 2000 526 2 -1,3 1.458 5,5 6 2001 340 1,9 -35,4 1.323 7,2 -9,3 2002 490 2,1 44,1 1.658 7,1 25,3 2003 661 2,1 34,9 1.884 5,9 13,6 2004 801 1,8 21,2 2.230 4,9 18,4 2005 938 1,9 17,1 2.230 4,5 0 2006 1.005 1,9 7,1 2.366 4,4 6,1
Year Iron&Steel (chapters 72-73) Machines (chapter 84) Value Shr. (%) Cha. (%) Value Shr. (%) Cha. (%)
1996 2.081 9 - 6.224 26,9 - 1997 1.872 7,5 -10 6.344 25,5 1,9 1998 1.466 6,1 -21,7 6.107 25,4 -3,7 1999 942 4,4 -35,7 4.320 20,2 -29,3 2000 1.332 5 41,4 5.071 19,1 17,4 2001 1.003 5,5 -24,7 4.003 21,9 -21,1 2002 1.496 6,4 49,2 5.610 24,1 40,1 2003 2.407 7,6 60,9 6.992 22,1 24,6 2004 3.034 6,7 26 8.868 19,5 26,8 2005 3.750 7,6 23,6 10.470 21,3 18,1 2006 4.158 7,7 10,9 11.850 21,5 13,2
Imports from the EU
Year Electronic Products (chapter 85) Automobiles (chapter 87) Value Shr. (%) Cha. (%) Value Shr. (%) Cha. (%)
1996 2.167 9,4 - 2.092 9 - 1997 2.770 11,1 27,8 3.017 12,1 44,2 1998 3.263 13,6 17,8 2.738 11,4 -9,2 1999 4.011 18,7 22,9 2.433 11,4 -11,1 2000 4.648 17,5 15,9 4.585 17,2 88,5 2001 2.749 15 -40,9 1.532 8,4 -66,6 2002 3.143 13,5 14,3 2.013 8,6 31,4 2003 3.654 11,5 16,3 4.646 14,7 130,8 2004 4.915 10,8 34,5 8.501 18,7 83 2005 5.095 10,4 3,7 8.463 17,2 -0,4 2006 5.450 9,9 7 8.957 16,3 5,8
Year Other Industrial Products Total Value Shr. (%) Cha. (%) Value 1996 8.607 37,2 - 23.138 1997 8.925 35,9 3,7 24.870 1998 8.778 36,5 -1,6 24.075 1999 7.998 37,4 -8,9 21.401 2000 9.459 35,5 18,3 26.610 2001 7.751 42,4 -18,1 18.280 2002 9.662 41,4 24,7 23.321 2003 12.603 39,8 30,4 31.695 2004 17.224 37,9 36,7 45.434 2005 18.469 37,5 7,2 49.220 2006 20.690 38,3 12 55.068
The share of agriculture in exports is constantly decreasing. In 1996, the share of agriculture in Turkey’s exports to the EU was 16,8% whereas the share was 8,0% in 2006. Although the share of agriculture is decreasing, the nominal gain from exports is around the same levels, $1.935 million in 1996, and $3.531 million in 2006. Agriculture is also a decreasing component in the composition of imports from the EU. The share decreased from 3,3% to 1,9% during 1996-2006. On the other hand the value of imports increased, from $758 million to $1005 million in the same period. Textile and clothing was biggest supporter of the customs union. Their expectation was that with the removal of quotas exports would accelerate. However, the sector disappointed. The share of textile and clothing went down dramatically from 49,1% to 29,4 % between 1996-2006, although the value of exports increased from $5.665 million to $12.917 million. The increase in the exports of textile and
clothing was a way below the level of increase in overall exports to the EU. The increase in exports of textile and clothing was 128% during 1996-2006, however the increase was 281% for overall exports to the EU. The level of imports in this sector is constant 4-7%, between 1996 and 2006, but the value is steadily increasing from $1.391 million in 1995 to $2.366 million in 2006.
Iron and steel sector’s share in exports to the EU grew to 7,3% from 3,6%. This increase in the share also affected the value, which increased from $420 million to $3.190 million between 1996 and 2006. The Free Trade Agreement on products that are within the jurisdiction of ECSC entered into force in 1996. From 1996 to 2003 the exports of iron and steel to the EU increased by 659%. The share of iron and steel in imports is more moving. The level of share decreased from 9,0% to 4,4% in 1999 and then started to rise, and in 2006, it was 7,7%. The value of iron and steel imports from the EU had a parallel move. It decreased to $942 million from $2.081 million between 1996 and 1999 and become $4.158 million in 2006.
The exports automobile industry products increased by 2171%, a lot higher than the overall 281,2% increase. The share of exports proportionally increased from 3,4% in 1996 to 20,5% in 2006. The value increased to $9.018 million from $397 million. The share of imports also increased. The level of share of automobile industry products was 16,1% in 2006, which was 9% in 1996. The value increased from $2.092 million to $8.957 million during the same period.
The changes in the share of industrial products in the composition of both exports and imports are minor. The share of exports of industrial products was 17,5% in 1996 and 19,3% in 2006. However, the value of exports, with constant growth, increased by 321%, from $2.016 million to $8.491 million. The value of imports of industrial products from the EU was $8.607 million in 1996, which increased to $20.690 million in 2006.
The sectorial composition of Turkey’s exports to the EU changed in favor of chapter 84-85-87, iron and steel and partly industrial products. The consequences are not favorable for agriculture and textile and clothing so far. This shows Turkey’s exports‟ shift from labor intensive, less technological structure to capital intensive, high tech goods, which is favorable. This structural shift is the result of R&D activities parallel to technical harmonization and improvement in quality via the investments on electronics and automobile by foreign firms. Textiles and clothing is labor intensive, which means it is cost oriented. In addition, textile importers are very sensitive to pricing. These two factors make difficult for Turkish textile
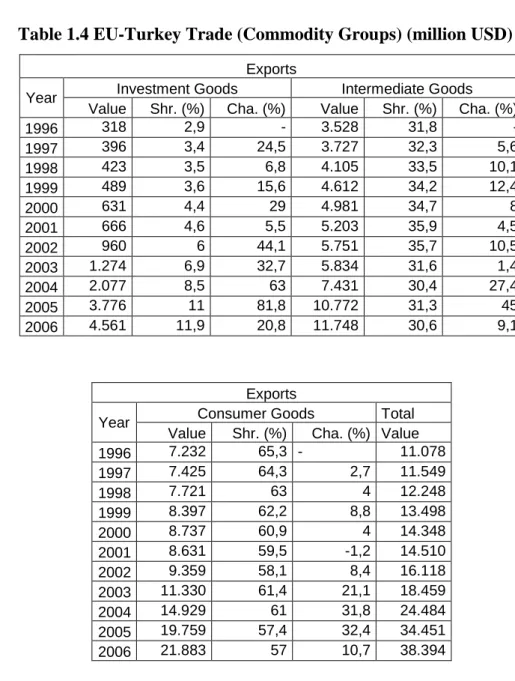
and clothing firms to achieve desired export level. Because of China and Asian countries, Turkish firms become uncompetitive and lose markets, which in turn decrease the level of potential exports. The revaluation of YTL is also often indicated as one of the reasons that blocks textile and clothing sector. Competitiveness figures support the structural change in Turkey’s trade. Turkey’s competitiveness improved after the Customs Union especially in easily imitable research-oriented goods and difficult imitable research-oriented goods on the other hand worsened in labor-intensive goods and raw material intensive goods, between 1996-2000 (Yilmaz and Ergun27, 2008). Table 1.4 shows the distribution of commodity groups in EU-Turkey trade. According to this table, the only group that made a major change in exports is the investment products.
Table 1.4 EU-Turkey Trade (Commodity Groups) (million USD) 28
Exports
Year Investment Goods Intermediate Goods Value Shr. (%) Cha. (%) Value Shr. (%) Cha. (%)
1996 318 2,9 - 3.528 31,8 - 1997 396 3,4 24,5 3.727 32,3 5,6 1998 423 3,5 6,8 4.105 33,5 10,1 1999 489 3,6 15,6 4.612 34,2 12,4 2000 631 4,4 29 4.981 34,7 8 2001 666 4,6 5,5 5.203 35,9 4,5 2002 960 6 44,1 5.751 35,7 10,5 2003 1.274 6,9 32,7 5.834 31,6 1,4 2004 2.077 8,5 63 7.431 30,4 27,4 2005 3.776 11 81,8 10.772 31,3 45 2006 4.561 11,9 20,8 11.748 30,6 9,1 Exports
Year Consumer Goods Total Value Shr. (%) Cha. (%) Value 1996 7.232 65,3 - 11.078 1997 7.425 64,3 2,7 11.549 1998 7.721 63 4 12.248 1999 8.397 62,2 8,8 13.498 2000 8.737 60,9 4 14.348 2001 8.631 59,5 -1,2 14.510 2002 9.359 58,1 8,4 16.118 2003 11.330 61,4 21,1 18.459 2004 14.929 61 31,8 24.484 2005 19.759 57,4 32,4 34.451 2006 21.883 57 10,7 38.394 27
Yilmaz Bahri and Ergun Selim; 2003 “The Foreign Trade Pattern and Foreign Trade Specialization of Candidates of the European Union” p.8-13
28
Imports
Year Investment Goods Intermediate Goods Value Shr. (%) Cha. (%) Value Shr. (%) Cha. (%) 1996 4.831 28,7 - 10.539 62,5 - 1997 7.388 31,9 52,9 12.880 55,7 22,2 1998 7327 29,5 -0,8 14.009 56,3 8,8 1999 7.182 29,8 -2 13.270 55,1 -5,3 2000 6.069 28,4 -15,5 11.823 55,2 -10,9 2001 7.254 27,3 19,5 14.116 53 19,4 2002 4.317 23,6 -40,5 11.168 61,1 -20,9 2003 5.361 23 24,2 14.417 61,8 29,1 2004 6.999 22,1 30,6 19.233 60,7 33,4 2005 10.672 23 52,5 26.819 59 39,4 2006 11.587 24 8,6 29.008 58,9 8,2 Imports
Year Consumer Goods Total Value Shr. (%) Cha. (%) Value 1996 1.491 8,8 - 16.861 1997 2.870 12,4 92,5 23.138 1998 3.535 14,2 23,2 24.870 1999 3.622 15 2,5 24.075 2000 3.525 16,5 -2,7 21.401 2001 5.114 19,2 45,1 26.610 2002 2.595 14,2 -49,3 18.280 2003 3.196 13,7 23,2 23.321 2004 5.147 16,2 61 31.695 2005 7.613 16,8 47,9 45.434 2006 8.044 16,3 5,7 49.220
The share of investment products in Turkey’s exports to the EU increased from 2,9% in 1995 to 11,5% in 2006, in terms of value from $318 million to $5.081 million, a 1.497% increase. Intermediate products on the other hand had a 31,8% share in 1995, which increased to 35,23% in 2006. The value gained from intermediate products‟ exports raised from $3.528 million to $15.492 million. The share of consumption products was 57,4% in 2004, which was 65,3% in 1995. However, value of exports raised $7.232 million to $23.250 million during the same period. The increase in exports of investment products shows that Turkish firms gained a constant share in the market of high value added products.(TÜSIAD, 2006). In case of imports, the distribution of commodity groups shows a change in favor of consumption products. Investment products share in imports from the EU decreased to 22% in 2006 from 28,7% in 1995, the value increased from $4.831 million to $12.186 million. Import of intermediate products‟ share also decreased. It was 62,5% in 1995, which decreased to 59,1% in 2006, the value of imports raised from $10.539 million to $32.567. The share of consumption products increased to 15,9% in 2006 from 8,8% in 1995. The value of imports
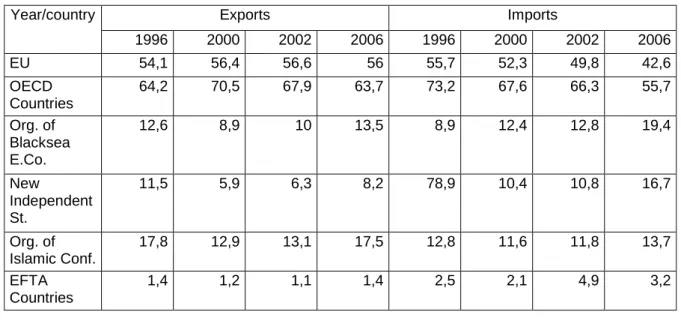
increased by 488% between 1995 and 2006. It rose from $1.491 million to $8.776 million. The average share of commodity groups in Turkey’s imports from the EU between 1995-2006 is 26,1% for investment products, 59,1% for intermediate products, 15,9% for consumption products. The import of investment and intermediate products provides input to the economy. These products create contribution to the economy. The sum of investment and intermediate products is 84,3%, which is very positive. The average share of consumption products is 15,9%. The increase in import of consumption products is mainly due to low interest consumption loans and high internal demand caused by revalued TL. The consumption products imported from the EU, makes Turkish people conscious of quality, standards and consumer rights. As Turkish people gain conscious, they demand same standards from the domestic producers. As domestic producers provide same level, of quality and standards, they can supply it to Turkish people or they can export it to the EU. One other thing is the negative effects of import of consumption products may be balanced with the high taxes levied on luxurious products. (IKV, 2004) Table 1.5 shows the distribution of Turkey’s trade by selected country groups for selected years. In terms of exports, only New Independent States has an important loss as 3,3% The Russian economic crisis was one of the main reasons of decrease in the share of New Independent States‟ . Organization of Islamic Conference’s share is stable and EFTA counties‟ share has not shown a vital change. It can be derived that Turkey’s exports after customs union, with the help of global crisis, shifted to the EU. The increase in the level of exports to the EU despite global crisis, like Russia and Asian, proves that Turkey gained a level of stability in terms of exports.
Table 1.5 Turkey’s Trade by Country Groups29
Year/country Exports Imports
1996 2000 2002 2006 1996 2000 2002 2006 EU 54,1 56,4 56,6 56 55,7 52,3 49,8 42,6 OECD Countries 64,2 70,5 67,9 63,7 73,2 67,6 66,3 55,7 Org. of Blacksea E.Co. 12,6 8,9 10 13,5 8,9 12,4 12,8 19,4 New Independent St. 11,5 5,9 6,3 8,2 78,9 10,4 10,8 16,7 Org. of Islamic Conf. 17,8 12,9 13,1 17,5 12,8 11,6 11,8 13,7 EFTA Countries 1,4 1,2 1,1 1,4 2,5 2,1 4,9 3,2 29
Distribution of imports favored Organization of Black Sea Economic Cooperation and New Independent States by major degrees, from 8,9% and 7,0% share in 1996 to 19,4% and 13,7% in 2006 respectively. The share of Organization of Islamic Conference increased by 1,9% in 2006 respectively. The EFTA countries increased their share to 3,2% in 2006 from 2,5% in 1996. There are also decreases in shares of the EU and the OECD countries. The EU‟ s share decreased from 55,0% in 1996 to 42,6% in 2006 and the OECD‟ s share decreased to 55,7% in 2006 from 73,2% in 1996.
CHAPTER 2
2 INDUSTRIAL RELATIONS and AUTOMOTIVE SECTOR IN TURKEY
In Turkey industrialization started later than Western countries. During the republic the labor relations has been influenced by social and legal environment. The constitution of 1961 provided important rights to employees especially to establish them organizations, and provided strike and lockout rights. On the other hand, Turkey experienced turbulence due to the threat of communism during cold war. For this reason, when military regime came to power in 1980, they initially minimized employees’ rights. Strike and collective bargaining rights have been restrained. After democratization, some of these rights have been resituated.
On 12 September 1980 General Kenan Evren, the Chief of general Staff, installed himself and his five-man National Security Council as a temporary government. The military coup suspended the activities of first and foremost DISK, as well as the other confederations excluding Turk-Is, and the majority of independent unions. These unions were put under trusteeship and their assets were confiscated. The National Security Council established by the perpetrators of the coup invalidated the constitution of 1961 and the laws that were enacted according to the stipulations of this constitution and regulated labor relations. Until the promulgation of new laws, the Supreme Council of Arbitration was designed as the authority that had the last word in collective negotiations.
The new labor laws were enacted in July 1983. Act Number 2821 on Trade Unions and Act Number 2822 on Collective Bargaining, Strikes and Lockouts signified a serious backslide in the right of workers and trade unions. These laws exterminated the cultural and educational role of the unions, and trade unions were redefined solely as organizations with economic and social functions. The constitution of 1982, which is currently in operation, regulated the system of industrial relations in a more detailed and restrictive manner. Today, also fundamental rights – such as to organize, to bargain collectively, to strike and to lock-out –are governed by acts numbered 2821 and 2822 in the same manner as the constitution. With the new constitution in 1982 there were several changes made in industrial relations. Article 2821 regarding to Trade Unions there are several legislations that limit trade unions. The most important matter is about organizational model. Related to this article unions can be founded only in appropriate branch of business and they cannot be organized upon to the basis of job or workplace. For higher organizational structures only confederations are allowed. With these limitations a stronger unionism would be created instead of a divided structure. It bans
the workers to choose more than one union membership and these memberships or dismissal of a membership has to be confirmed by notary.
The Article 2882 regulates that, the collective agreements can be only made with a minimum 10% of workers from the same branch of business and more than 50% of the workers within the company. Also this article recognizes beneficial strike as official. It suggests solving collective conflicts with intermediation and with the failure of an intermediation several legislations were made on strike and lockout. The conflicts on kinds of works where strikes and lockout are forbidden, the sides have to apply the Higher Board of Arbitration.
In 1995, an addition to article 53 of the constitution has been made and government employees gained rights to be organized and bargain collectively. The legislation regarding to the implementation of this addition was made in 2001.So on the basis of work of branch the governmental employees have rights to establish unions that can facilitate in all country and every 15th August they have right for collective bargaining.30With an possible agreement reconcilement paper is signed by both parties and forwarded to council of ministers for required changes. With an disagreement, in following days conciliation committee is called and this committee reports the disagreement points to the council of ministers. That means every decision has to be made by the council of ministers; these conflicts cannot be solved with strikes.
In this term the important change was 4857 number the law of work enacted in 2003.This law lightens the hard structure of Turkish labor system and opens an important perspective on the way of EU and ILO norms. This law secures the work for employee and affords the flexibility demands of employers.
Turkey has been experiencing great changes since 1980. After 1980 military coup, economic, social and politic structure changed in Turkey. These changes also affected labor relations in the country. Recently, we may observe important problems and challenges in individual or collective labor relations in Turkey.
30