THESIS
EPIGENETIC REGULATION OF
CANCER-TESTIS GENE EXPRESSION
A THESIS SUBMITTED TO
THE DEPARTMENT OF MOLECULAR BIOLOGY AND GENETICS
AND THE INSTITUTE OF ENGINEERING AND SCIENCE OF
BİLKENT UNIVERSITY
IN PARTIAL FULFILLMENT OF THE REQUIREMENTS FOR
THE DEGREE OF MASTER OF SCIENCE
BY
AYDAN BULUT
II I certify that I have read this thesis and that in my opinion it is fully adequate, in scope and in quality, as a thesis for the degree of Master of Science.
Dr. Uygar Tazebay
I certify that I have read this thesis and that in my opinion it is fully adequate, in scope and in quality, as a thesis for the degree of Master of Science.
Dr. Stefan Fuss
I certify that I have read this thesis and that in my opinion it is fully adequate, in scope and in quality, as a thesis for the degree of Master of Science.
Dr. Ali O. Güre
Approved for the Institute of Engineering and Science
Director of Institute of Engineering and Science Prof. Mehmet Baray
III
ABSTRACT
EPIGENETIC REGULATION OF CANCER-TESTIS GENE EXPRESSION
Aydan Bulut
M.S. in Molecular Biology and Genetics Supervisor: Dr. Ali O. Güre
August 2008, 108 Pages
Cancer-testis (CT) genes are composed of mostly X-linked gene families that are widely expressed in cancer, in a coordinate manner, with ideally no expression in normal tissues except spermatogonia, oogonia and trophoblasts. Exact mechanisms reactivating their expression during carcinogenesis are not known yet. Epigenetic factors emerge as key controllers of CT expression. Selective DNA demethylation of the promoter regions of CT genes has been demonstrated to correlate closely with CT expression in all examples studied so far. Tumor-suppressor genes (TSGs), on the other hand, are known to be frequently down-regulated in cancer by hypermethylation of DNA. In order to elucidate mechanisms that could help explain tumor-specific CT gene up-regulation, we aimed to understand how these seemingly opposite effects could exist in close proximity. For this purpose, we identified eight CT-proximal X-linked putative TSGs (pTSGs) down-regulated in tumors, by screening the SAGE and EST libraries of the Cancer Genome Anatomy Project. By conventional and real-time RT-PCR, we verified that two such genes, ALAS2 and CDR1, were significantly down-regulated in almost all cancers tested, while three others were down-regulated at least in some cancers, and by bisulfite sequencing we demonstrated that the promoter DNA of these pTSGs were hyper-methylated in correlation with their expression levels.
Our search for the presence of insulators between CT and TSG genes did not yield a consensus site. However, we hypothesized that the dynamic organization of CT genes into inverted repeats (identified by the Inverted Repeats Finder program) throughout the X chromosome could be a candidate regulator of CT expression. By using the chromosome conformation capture (3C) assay, we have shown the alteration in higher-order chromosomal structure of the CT gene NY-ESO-1-bearing inverted repeat region in SK-LC-17 as well as in 5-Aza-2’-deoxycytidine-treated HT29 cell lines, correlating with CT as well as ncRNA expression from within the repeat. As it is known that many CT genes are embedded in inverted repeats, our results suggest a general mechanism regarding epigenetic regulation of CT gene expression.
IV
ÖZET
KANSER-TESTİS GEN İFADESİNİN EPİGENETİK DENETLENMESİ
Aydan Bulut
Moleküler Biyoloji ve Genetik Yüksek Lisansı Tez Yöneticisi: Dr. Ali O. Güre
Ağustos 2008, 108 Sayfa
Kanser-testis (KT) genleri, çoğunlukla X kromozomu üzerinde yer alan, normal dokular içerisinde ideal olarak sadece spermatogonia, oogonia ve trofoblastta ve fakat birçok kanser türünde de, koordine olarak, ifade edilen gen ailelerinden oluşurlar. Hangi mekanizmaların kanserde tekrar çalışmalarına yol açtığı büyük ilgi odağı olduğu halde halen tam olarak bilinmemektedir. Epigenetik etmenler bu bağlamda ana denetleyiciler olarak ortaya çıkmaktadır. Promotor bölgesi seçici DNA demetilasyonunun KT ifadesiyle sıkıca bağlantılı olduğu çalışılan tüm örneklerde gösterilmiştir. Diğer yandan, tümör baskılayıcı genlerin (TBG) ise DNA’nın aşırı-metillenmesi sonucu kanserlerde ifade azalmasına uğradıkları bilinmektedir. Kanser-testis genlerinin tümör-özgün ifade artışına yol açan mekanizmaları izah edebilmek amacıyla, öncelikle bu iki ters işleyişin birbirine yakın olarak nasıl var olabildiğini anlamaya çalıştık. Bu amaçla Kanser Genomu Anatomi Projesi’nin SAGE ve EST kütüphanelerini tarayarak sekiz adet KT-komşusu X-bağlantılı varsayımsal tümör baskılayıcı gen belirledik. Geleneksel ve gerçek zamanlı PZR ile bu tarz iki genin, ALAS2 ve CDR1’in, ifadelerinin test edilen hemen bütün kanserlerde önemli ölçüde azaldığını ve başka üç genin ifadelerinin ise en az birkaç kanser türünde azaldığını tespit ettik. Bisülfit dizileme tekniğini kullanarak, bu varsayımsal TBGlerin promotor DNAlarının aşırı-metillenmesinin, genlerin ifade düzeyleriyle orantılı olduğunu da gösterdik.
KT ve TBG genleri arasında yalıtkan elemanların olup olmadığını araştırdık, bu çalışmanın sonucunda konsensus bir yalıtım bölgesi olmadığını belirledik. Ne var ki, KT genlerinin X kromozomu boyunca, tersine tekrarlı DNA bölgeleri içinde yer almasını; kromozom yapısının KT ifadesi üzerinde denetleyici olabileceği olasılığı olarak önerdik. Biyokimyasal 3C yöntemini uygulayarak, NY-ESO-1 içeren tekrarlı DNA bölgesinin kromozom yapısının SK-LC-17 ve 5-Aza-2’-deoksisitidin ile muamele edilmiş HT29 hücre hatlarında değiştiğini gösterdik. Bu değişim aynı zamanda protein kodlamayan-RNA ve KT ifade seviyelerinin değişimiyle bağdaşıktır. Birçok KT geninin tersine tekrarlı DNA bölgeleri içerisinde yer aldığı bilindiğinden dolayı, sonuçlarımız genel bir KT epigenetik denetleme mekanizmasını ileri sürmektedir.
V
ana, baba ve sevgiliye…
VI
ACKNOWLEDGEMENTS
It’s my responsibility to thank my supervisor Dr. Ali O. Güre for his always-accurate guidance, his patience and very good temper. He has been a good model for me. I would like to thank my group-mates also; Rasim, Duygu, Şükrü, Esen and Derya for their help and friendship. It was my pleasure and honor to be part of the Bilkent MBG family.
My family and my dear darling always supported and encouraged me. I can never compensate for; nevertheless my deepest thanks are to them.
I was supported by TÜBİTAK-BİDEB scholarship # 2228 throughout my M.S. study. This work was also supported by grants from TÜBİTAK and European Commission to Dr. Ali O. Güre.
VII
TABLE OF CONTENTS
ABSTRACT ……… III ÖZET ……….…….. IV DEDICATION PAGE ……….…….. V ACKNOWLEDGEMENTS ……….……… VI TABLE OF CONTENTS ……….………. VII LIST OF TABLES ……….…….. X LIST OF FIGURES ……….………… XI ABBREVIATIONS ………... XIII1 INTRODUCTION ……….……….. 1
1.1 Cancer-Testis (CT) Genes and Antigens ……….……..………... 1
1.1.1 Structure ………. 2
1.1.2 Function ……….. 2
1.1.3 Conservation ……….. 4
1.1.4 Expression (and Acting Epigenetic Mechanisms) …………...…. 4
1.2 Epigenetic Regulation of Transcription ……….………. 6
1.2.1 Methylation/Demethylation of DNA ….………. 6
1.2.2 Histone Modifications ……….……… 8
1.2.3 Polycomb/Trithorax Group Proteins and Nucleosome Remodeling ……….. 10
VIII
1.3 Epigenetics of Germ- and Stem-Cells …...………..……… 13
1.4 Epigenetics of Cancer …………...………. 15
2 MATERIALS & METHODS ……….……….…. 19
2.1 Expression Analyses of Putative TSGs ………. 19
2.2 Methylation Analyses of Putative TSGs ………. 20
2.3 Analyses of Higher-Order Chromosomal Structure ………..………... 21
3 RESULTS ……….. 27
3.1 Identification of X-linked CT-Proximal Putative Tumor-Suppressor Genes (TSGs) ………..… 27
3.2 Validation of Virtual Data by Conventional RT-PCR ……….. 28
3.3 Validation of Virtual Data by Real-Time RT-PCR ………..…. 30
3.4 Analysis of Methylation Statuses of Putative TSGs ………..… 42
3.5 Analysis of Higher-Order Chromosomal Structure of CTs ……….….. 46
3.5.1 3C Analysis of the model NY-ESO-1 Region ……….…… 48
4 DISCUSSION & FUTURE PERSPECTIVES ………. 59
5 REFERENCES ………. 65
6 APPENDICES ………. 77
APPENDIX A: CURRENT LIST OF CANCER-TESTIS GENES ……….……. 78
APPENDIX B: LIST OF HISTONE-MODIFYING ENZYMES ……….……... 80
APPENDIX C: X-LINKED GENES DOWNREGULATED IN CANCER ACCORDING TO ANALYSES OF SAGE/EST LIBRARIES ………...……. 82
IX APPENDIX E: REAL-TIME PCR EQUATIONS & CALCULATIONS ………..………. 85 APPENDIX F: SEQUENCING RESULTS OF THE 3C ASSAY ………...……. 107
X
LIST OF TABLES
Table 1: Genetic Information Regarding Selected Putative TSGs …….……….. 23
Table 2: Primers Used for Expression Analyses .………. 24
Table 3: Primers Used for Bisulfite Sequencing Experiments ….……….. 24
Table 4: Primers Used for the 3C Assay ………..………. 25
Table 5: Primers Used for Analyses of Non-Coding Transcripts ………….………. 25
Table 6: Primers of Normalization Genes Used for All Assays ………..……… 26
XI
LIST OF FIGURES
Figure 1 : mRNA expression levels of 8 putative tumor suppressor genes on X chromosome in normal tissue, lung cancer and colon cancer panels, by conventional RT-PCR …………..……… 30 Figure 2 : Quantified expression levels of 6 pTSGs in normal tissues ………. 35 Figure 3 : Quantified expression levels of 4 pTSGs in a panel of lung cancer cell
lines ……… 37 Figure 4 : Quantified expression levels of the 6 pTSGs in a panel of colon
cancer cell lines ……….……… 41 Figure 5 : CpG dinucleotides present in the promoter sequences of the 5
pTSGs 44
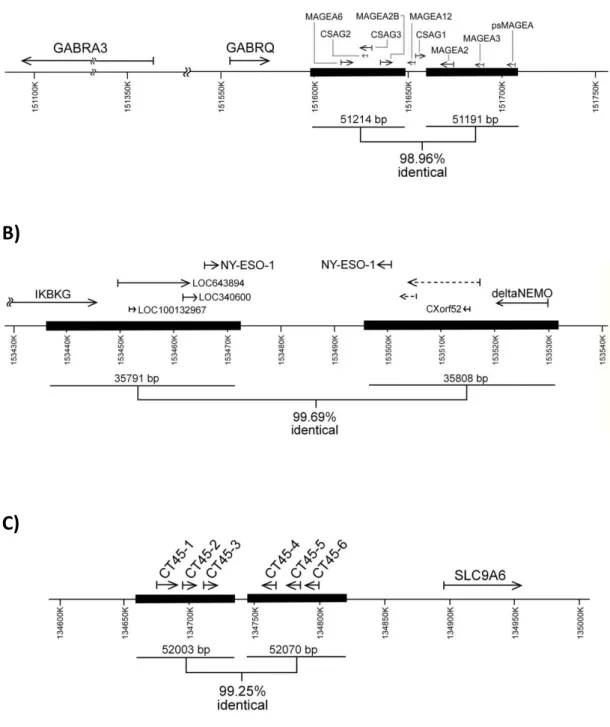
Figure 6 : Analyses of methylation states of the ALAS2, CDR1 and ZCCHC12 genes by sodium bisulfite sequencing ………..……… 45 Figure 7 : Genetic structure of some CT-containing inverted repeats ……… 47 Figure 8 : Investigation of the higher-order chromosomal structure of the
NY-ESO-1-containing IRs ……….……… 50 Figure 9 : CT expression levels of the colon cancer cell lines HT29 and Colo205
that are to be used for the 3C analysis ……….……… 51 Figure 10: Results of the 3C assay …………..……….………….……… 54 Figure 11: Annotated transcripts in the NY-ESO-1-bearing inverted repeat
region ………..…….………… 56 Figure 12: Primers for detecting mRNAs and non-coding RNAs from inside the
inverted repeat(s) and inside the small loop between the two repeats ……….……… 56
XII Figure 13: mRNAs and non-coding RNAs that are expressed inside the inverted
repeat(s) and inside the small loop between the two repeats …….….. 58 Figure 14: Model of boundary element-mediated difference in regulation of CT
and TSG gene expression ……… 62 Figure 15: Model regarding epigenetic regulation of CT gene expression:
XIII
ABBREVIATIONS
AZA 5-Aza-2’-deoxycytidine bp Base Pair CT Cancer-Testis Ct Threshold Cycle DNMT DNA Methyltransferase E EfficiencyEST Expressed Sequence Tags HAT Histone Acetyltraferase HDAC Histone Deacetylase IRF Inverted Repeats Finder
m Number of Technical Replicates
m Slope
NF Normalization Factor
Pc Polycomb
SAGE Serial Analysis of Gene Expression SD Standard Deviation
SE Standard Error
Trx Trithorax
1
1
INTRODUCTION
1.1 Cancer-Testis (CT) Genes and Antigens
Cancer-testis antigens constitute a group of mostly X-linked testicular antigens, the familial and immunogenic properties of which were realized by mid-90’s, and new members were identified rapidly since then. CTs are immunogenic and have vaccination potential because they are widely expressed in cancers with no expression in normal tissues except testis; and cytotoxic T cells can recognize the CT antigens. The initial discovery of the first CT-antigens MAGEA1, BAGE and GAGE1 between 1991-95 was through T cell epitope cloning, thus they were found as cytotoxic T lymphocyte-recognized antigens [1-3]. SSX2 and NY-ESO-1 were discovered after 1995 by another technique, SEREX (serological expression cloning), developed by Pfreundschuh et al [4-7]. From then on, the application of SEREX technique led to identification of many additional CT-antigens, the number of which was further increased by high-throughput transcript analyses [8, 9]. Today 82 CT gene families with 263 genes can be found in literature [10]; although only a subgroup have testis-restricted expression and are immunogenic. An up-to-date list of CT genes is given in Appendix A.
Individual CT antigens proposed to be used as tumor biomarkers are MAGE A1/A3 for hepatocellular carcinoma and lung adenocarcinoma, BORIS for breast cancer, NY-ESO-1 for lung adenocarcinoma, etc [11-13]. However, CT antigens are more likely to be candidate biomarkers when assessed in combination since their expression is thought to be triggered by the same mechanism [11]. In addition, some CT antigens bear the potential to be used for early diagnosis of cancer, demonstrated by few studies [13, 14].
2
1.1.1 Structure
Cancer-testis genes can be divided into two groups according to chromosomal location. Most CTs are on the X chromosome and are referred to as CT-X genes [15]. Members of CT-X group exist mostly as multi-copy gene families, some also containing splice variants. They reside in tandem or inverted repeats and consist approximately 10% of the genes on the X chromosome. Duplications of the unstable repeat regions are thought to be the primary mechanism increasing CT copy number on chromosome X [10].
CT genes located on autosomal chromosomes are mostly single-copy genes that are not associated with segmental duplications (yet).
Regarding the similarity of the CT genes, different families have slight homology with each other (e.g. NY-ESO-1 and LAGE1, CAGE-HAGE and XAGE-GAGE-PAGE homologies) while members of the same family generally have sequence similarity of >90% [16].
The best-studied of all CT genes is the MAGE superfamily. Individual families within the MAGE superfamily are related to each other, such that they all have the MHD (MAGE homology domain) that encodes a ~200 residue stretch of conserved protein domain [17, 18]. The rest of MAGE proteins are nearly completely different in each family. According to sequence analysis, the MAGE superfamily involves 3 acidic groups, MAGE A, B and C; and a basic group, MAGE D [19].
None of other CTs but CAGE gene bearing a DEAD box exhibit structural domains, in correlation with their limited functionality and evolutionary history [20]. These aspects are reviewed in sections 1.1.2 and 1.1.3.
1.1.2 Function
Many of the CT antigens do not have characterized biological functions. Early-identified major CT families fall into this group with the major exception being the MAGE superfamily. Some MAGE orthologs have defined functions. Mouse MAGE
3 B4 plays role in germ cell development; mouse necdin binds to E2F1 and negatively regulates G1 to S progression [19]. In a similar fashion, Drosophila necdin controls neural precursor proliferation in postembryonic neurogenesis [21]. Similarly MAGE A4 binds to the Gankyrin or p28 protein and inhibits the adhesion-independent growth of Gankyrin-overexpressed cells [19]. Recently MAGE-A3/6 was identified as a novel target of fibroblast growth factor 2-IIIb (FGFR2-IIIb) signaling in thyroid cancer cells, such that FGF7/FGFR2-IIIb activation resulted in H3 methylation and deacetylation of the MAGE-A3/6 promoter, to down-regulate gene expression [22].
Within those CTs that are known to have a function, a subgroup consists of meiosis-related proteins, like SCP1 (CT8) which is a synaptonemal complex protein involved in chromosome reduction in meiosis, and OY-TES-1, which encodes the proacrosin binding protein sp32 precursor [16]. Both SCP1 and OY-TES-1 are non-X CT antigens.
Within other functional CT genes are BORIS and CAGE. BORIS (brother of the regulator of imprinted sites) is the paralog of the abundant transcription factor CTCF, and seems to play role in CT-regulation according to the studies showing BORIS and CTCF binding to NY-ESO-1 and MAGE A1 promoters, resulting in derepression of both antigens [23-25]. CAGE, on the other hand, is a DEAD box helicase protein, expression of which is sensitive to the cell cycle. CAGE was thus suggested to play a proliferative role [20]. SSX antigen is still a candidate to be placed among functional CTs with a possible role in stem-cell migration and cancer cell metastasis, since it overlaps in cytoplasm with matrix metalloproteinase 2 (MMP2) and its down-regulation impairs cell migration with a reduction in MMP2 levels [26].
An interesting finding that may shed light to the functionality of CTs was published in 2006, declaring the first direct physical interaction between two CT antigens, the homology domain of MAGE C1 and NY-ESO-1 [27]. Although it is not yet known whether this interaction is associated with the function of either of the two antigens, or rather an artifact resulting from putatively same CT-regulatory
4 mechanism (like a non-functional weak interaction resulting from the abundance of CT antigens within the cell in cases of coordinate hypomethylation); yet it would be beneficial to examine the possible interactions between other CT antigens.
1.1.3 Conservation
CT genes are almost exclusively specific to primates, with few exceptions. Few members of the MAGE superfamily are found in mouse genome, the mostly conversed one being necdin because of its functionality. Indeed, MAGE genes have expanded in both rodent and primate lineages, but independently [17]. In general, human CT genes have orthologs in primates, especially in great apes. CT genes in the chimpanzee genome are highly similar to human orthologs and generally located on the same chromosomes [10]. Members of the GAGE family are tandemly arranged on the X chromosome only in human, chimpanzee and macaque genomes. Phylogenetic analyses reveal that the GAGE family began to duplicate after the split of human and chimpanzee [28].
As a recent estimate of the future evolution of CT genes, the divergence rate between human and chimpanzee CT orthologs was analyzed, which shows that CT-X genes are evolving faster than non-CT-X CT genes [10].
The absence of CT genes in genomes of model organisms is a challenge for CT research, since generation of knock-out strains and other manipulations are limited. Only the necdin knock-out was generated in mouse [19]. As a result, CT research is based on patient samples and germ cells.
1.1.4 Expression (and Acting Epigenetic Mechanisms)
Most cancer-testis genes are expressed in none of the normal adult tissues but testis, and then, only at the spermatogonial stage. However, recent research suggest they may be among genes escaping MSCI (meiotic sex chromosome inactivation) thus being expressed in spermatids also [29]. Based on their expression profiles in a panel of normal tissues, CT genes are classified as
testis-5 restricted (1), tissue-restricted (expressed in ≤2 of 13 non-gametogenic tissues tested) (2), differentially expressed (expressed in 3-6 non-gametogenic tissues, among 13 tested) (3) and ubiquitously expressed (4) [30]. The initially-discovered, major CT gene families fall in the testis- and tissue-restricted groups. Some genes referred to as ‘CT’ are thus controversially classified if the testis-specific expression rule is strictly applied. CT genes are also expressed, in a coordinate manner, in a wide-variety of cancers including lung cancer (especially non small-cell lung cancer), hepatosmall-cellular carcinoma, cancers of prostate, ovary, esophagus, hematological malignancies, multiple myeloma, head and neck squamous carcinoma, lymphoma, multiple myeloma, colorectal and gastric cancers and Hodgkin’s sarcoma; and are generally correlated with poor prognosis [11, 16]. What reactivates their expression during carcinogenesis is of great interest, however the exact mechanisms are not known yet. Genetic mutations are not responsible for this task, since these genes are expressed in germline with no known mutation. Although some CT family members are frequently involved in translocations, like SSX2 within t(X:18) region [4, 31], this seems to be the exception rather than the rule. Epigenetic factors therefore emerge as key controllers of CT expression. DNA demethylation associated with CT gene expression is the most frequently reported mechanism shown for many cancer types [12, 32]. Expectedly, treatment with the DNMT inhibitor, 5-AZA-2’-deoxycytidine, induces CT gene expression [33]. ‘Genome-wide hypomethylation’ is a phenomenon believed to associate or possibly cause CT gene expression; however promoter-dependent selective demethylation (restricted to the 5’ region) was shown to be the case for MAGE-A1 [34]. Histone modifications, namely (de-)acetylation, are known to affect CT expression, shown both in vivo and pharmaceutically by trichostatin A (HDAC inhibitor) treatment [32]. Acetylation-induced transcription was shown to be required for DNA demethylation of CTs, at least for the GAGE family; and since CT genes are
coordinately expressed, this may be part of the real mechanism resulting in gene
6 Since CT-X genes are organized in repeated regions on the X chromosome, we hypothesized that at some point before or after histone acetylation the higher-order chromosomal structure (and may be the nuclear localization) should alter leading to formation of permissive structures for CT gene expression. We further hypothesized that this could resulting in, or happen as a consequence of the generation of non-coding transcripts. Transcription factors known to have a role in CT expression, like Sp1, CTCF, BORIS, and others, should also have a role within this scenery before initiation of transcription. Adequate understanding of the activation mechanisms is required for therapeutic purposes, since inhibition of CT-derepression might help us proceed in our combat with cancer and other complex diseases.
1.2 Epigenetic Regulation of Transcription
Whatever exceeds beyond the borders of genetics falls in the fields of epigenetics and RNA biology. Investigation of epigenetic statuses and mechanisms assisted us understand how cell fates are different, how the zygote is not just a product of the egg and sperm, why identical twins raised together are not really identical? General knowledge regarding epigenetic mechanisms, namely, DNA methylation, histone modifications, and chromatin remodeling, are summarize in the following sections; how these mechanisms are altered in cancer, germ, and stem cells is also summarized.
1.2.1 Methylation/Demethylation of DNA
In mammals, methylation of DNA appears almost exclusively in the form of cytosine methylation (on the 5’ end) of CpG dinucleotides. Other types of DNA methylation include CNG and CNN residues. Although not studied as widely as CpG methylation, recent research suggests that non-CpG methylation might play important roles in the mammalian epigenome as well [36]. DNA methylation exerts its effect by suppressing transcription and is an indispensible process for mammalian development, and the post-developmental maintenance of the
7 healthy state. Genomic imprinting, X chromosome inactivation, gene- and tissue-specific expression are some basic phenomena that directly include CpG methylation. Bearing in mind that 50 - 70% of all human genes contain CpG islands might clarify the abundant role of DNA methytransferases. Methylation statuses are very dynamic, yet heritable upon cell division enabling long-term memory of transcriptional levels [36, 37].
Three enzymes act as CpG methyltransferases in mammals: Dnmt1, Dnmt3a and Dnmt3b [38, 39]. Dnmt1 is the maintenance methyltransferase which acts on hemi-methylated DNA during replication and is essential for X inactivation and imprinting [40]. Dnmt3a and Dnmt3b are de novo methyltransferases playing both collaborative and unique roles mostly in development [41]. Dnmts also act as co-repressors in protein complexes.
How reversal of DNA methylation is achieved is a controversial issue. In the classic ‘replication-coupled demethylation’ point of view, DNA methylation is reduced progressively upon each replication [42]. Inhibition of Dnmt1 activity by nucleoprotein complexes or histone modifications associated with transcription (e.g. acetylation) is required [42]. A more novel aspect is the existence of active DNA demethylases, either removing the methyl group from the cytosine residue, or removing the 5’-methylcytosine itself by glycosylase activity which requires endonuclease activity afterwards for repairing the missing base [42]. The former pathway is mediated by a protein that belongs to the family of MBD (methyl CpG-binding domain) proteins in vitro but it is not yet isolated in vivo [42].
Direct analysis of DNA methylation is possible through sodium bisulfite treatment followed by sequencing or restriction digestion (COBRA assay: COmbined Bisulfite Restriction Analysis) [43]. Alternatively, methylation-sensitive restriction endonucleases may be employed and afterwards the product is amplified by PCR reaction. One drawback of restriction-mediated assays is their limitedness to restriction sites. Genome-wide maps of methylation states can be generated through microarray hybridization or high-throughput sequencing of bisulfite treated DNA samples. Lastly, treating cells with 5-AZA-2’-deoxycytidine, a cytosine
8 analog which cannot be methylated, and investigation of transcript levels would provide an indirect analysis of DNA methylation [44].
1.2.2 Histone Modifications
Human DNA of approximately 2m length is large enough to exceed the borders of a cell nucleus, which is the major reason why higher-order chromatin structures exist. Nucleosome is the basic structural unit that consists of four core histones – H2A, H2B, H3 and H4 – around which 147 bp DNA is wrapped. Linker histone H1 is employed between two nucleosomes and brings them closer to generate a more compact structure named the ‘30nm fiber’. Further compactness is enabled by wrapping this fiber further utilizing protein scaffolds, finally generating chromosomes. The core histones play additional roles other than being a scaffold for wrapping DNA: the N-terminal and C-terminal tails bear more than 60 residues that can be covalently modified. Known histone modifications include lysine acetylation, lysine and arginine methylation, serine and threonine phosphorylation, lysine ubiquitination, lysine sumoylation and proline isomerization [45]. Methylation is more complex than other modifications since there are mono-, di- and trimethyl states for lysines and mono- and dimethyl (asymmetric and symmetric) for arginine [45]. The enormous number of combinations that the histone modifications might exist in, dectates a ‘histone code’ that regulates accessibility of DNA in first hand [46].
The putative ’histone code’ implies specific and heritable combination of histone modifications for specific functional roles. This has 3 consequences; firstly, organization of DNA into global chromatin environments - euchromatin and heterochromatin - that generates the banding pattern of chromosomes. The borders of chromosome bands have shown to be separated by boundary elements flanked by methylated H3K4 and H3K9 [47]. Heterochromatic states of the inactive X chromosome and pericentric heterochromatin are maintained by recruitment of specific proteins to methylated H3K27 and H3K9, respectively. Second consequence is the short-term regulation of biological processes like transcription, replication and repair through recruitment of chromatin remodeling complexes.
9 Although which combinations of modifications directly imply activation or repression is not still clear, H3K4me1, 2 and 3, H3K27me1, H3K9me1, H3K79me1, H4K20me1 and all acetylations are generally associated with transcription whereas H3K9me3, K3K27me3 and H3K79me3 are generally connected to transcriptional repression [47, 48]. A third effect is the long-term memory of transcriptional state, which plays putative roles in development and differentiation [46].
Almost each of the histone modifications are exerted by different enzymes. In general, histone acetyltransferases (HATs) and deacetylases (HDACs) carry out (de-)acetylation; histone methyltransferases (HMTs) - specifically lysine and arginine methyltransferases- and lysine demethylases carry out (de-)methylation; and serine/threonine kinases carry out phosphorylation. No arginine demethylases have been identified to date [45]. An up-do-date list of histone-modifying enzymes is given in Appendix B.
Apart from the core histones and the linker histone H1, there are other histone proteins named ‘histone variants’, which are employed in more specific processes. Such histone-variant genes have introns and are often polyadenylated unlike major histone RNAs. H2A and H3 variants are the widely studied ones. H2A.X plays role in maintaining genome integrity, it acts in double-strand break DNA repair, apoptosis, [V(D)J] recombination and replication [49]. H2A.Z was shown to be indispensible for survival however its exact role is yet to be determined. There are controversial data suggesting a role for H2A.Z in both transcriptional activation and repression, but it is certainly enriched in boundary elements between euchromatic and heterochromatic regions [50]. Another H2A variant, macroH2A, is thought to be involved in transcriptional repression and replaces H2A on the inactive X chromosome. The histone H3 variant H3.3 varies from H3 by only 4 amino acids, however it carries out remarkably different functions. It is enriched in some tissues during development. It is associated with actively transcribed regions of the genome, replacing H3 during transcriptional elongation, and constitutively expressed during the cell cycle accordingly. CENP-A, another H3 variant, is also essential for survival and localizes to centromeric heterochromatin [49]. Apart
10 from these, there are also testis-specific histone variants that may even play role in cancer-testis gene expression. Three models - replication-coupled histone deposition, transcription-coupled histone deposition and histone exchange (by certain factors) - have been proposed to explain how variant histones incorporate into the chromatin, though none has been proven [50].
Histone modifications are usually analyzed by chromatin immunoprecipitation (ChIP) using antibodies specifically recognizing modified residues. The generation of histone maps of human, mouse and yeast have been successfully performed by high throughput assays based on hybridizing ChIP samples on arrays (ChIP on chip) or by massively parallel signature sequencing of ChIP samples (ChIP-Seq) [47, 48]. Alternatively, histone modifications might be analyzed using mass spectrometry.
1.2.3 Polycomb/Trithorax Group Proteins and Chromatin Remodeling
Transcriptional regulation through modifications of DNA and histones discussed above seem to be the final steps in the regulation of a gene. To understand which mechanisms precede histone and DNA modifications, one needs to take into account polycomb group (PcG) and trithorax group (trxG) protein complexes, and other chromatin remodeling complexes. For the reasons explained below, these complexes are candidate major players determining the active/suppressed states of transcription, higher order chromosomal architecture, and even non-coding RNA transcripts.
PcG and trxG proteins were firstly discovered in D.melanogaster as activators or repressors, respectively, of Homeobox (Hox) genes, which define cell identity along the anteroposterior axis. In this context, they are required to maintain the state of expression, not to initiate or cease. Most of the involved proteins have defined human orthologs, that regulate Hox genes as well as many others. PcG and trxG proteins play role in some basic phenomena like genomic imprinting, X inactivation, pluripotency and cell proliferation [51].
Polycomb repressor complexes (PRC) are divided into two groups based on their physical association in different multiprotein complexes. Class II PRCs are directly
11 involved in repression of transcription while class I PRCs are methyltransferase complexes that maintain the repressed state [52]. PRC2 is a class I PRC that has four core components: E(z), Esc, Su(z)12 and Nurf-55 (these are the Drosophila proteins). Enhancer of Zeste (E(z)) is a the SET1- domain containing histone methyltransferase that trimethylates H3K27 and H1K26, the former of which is recognized by the chromodomain of Polycomb (Pc), which Is a core component of PRC1 complex (class II inhibitory complex). PRC1 has four core components in stoichiometric amounts: Pc, Polyhomeotic (Ph), Posterior sex combs (Psc) and and dRING. A recently identified third PcG complex is PhoRC, which includes sequence-specific DNA binding protein Pho. The mechanism of PRC action at target sites is rather sophisticated and not fully understood yet. PcG proteins are recruited to target genes’ polycomb response elements (PREs) via sequence-specific DNA-binding factors and/or by specific histone modifications (namely, H3K27me3). PREs are often several kilobases long and contain recognition sites for some protein motifs; however, they are proposed to have a bifunctional nature since trxG proteins also bind to trithorax response elements (TREs) overlapping PREs [51]. PcG recruitment might even involve components of the RNAi machinery, since recent data showed that while siRNA-mediated silencing of a gene promoter, AGO1 recruited EZH2 (human homolog of Drosophila E(z)) [53]. Most probably, binding of PcG and trxG complexes at target sequences is mediated by combinatorial signals from DNA and histone motifs, and requires other DNA-binding factors.
Once recruited, PRC complexes might suppress transcription via direct or indirect mechanisms. Direct inhibition of the transcriptional machinery is a choice, and supporting this notion, TAFIIs are stoichiometric components of PRC1. Generation of repressive chromatin environments by heterochromatinization is the indirect method, which is supported by in vitro data showing that PRC1 complex bound to chromatin does not allow remodeling by Swi/Snf complex as it does not allow transcription by RNA polymerase II [54, 55]. Long-range interactions of DNA and PcG complexes are putative further steps of regulation, either in the form of looping or PcG polymerization. These interactions might be required because of
12 large distances between PREs and promoters of target genes. In vitro, recombinant PcG complexes of Drosophila and mammals bound to an immobilized chromatin template can silence a second free chromatin in trans [56]. On the other hand, many PcG proteins can oligomerize or self-associate, which may be an important functional property for silencing [52].
Trithorax activatory complexes are divided into five groups: The ATP-dependent chromatin remodelers SWI/SNF and NURF (a member of the ISWI family), and SET-domain factors TAC1, Ash1 and MLL1-3 [51]. TrxG-mediated activation is less wellcharacterized than PcG-mediated silencing. Like PcG recruitment, trxG recruitment involves DNA and histone motifs (TREs and H3K4me3) and non-coding RNA. According to a recent study, non-coding transcripts from the bxd regulatory region of the Drosophila Ubx gene recruit the Ash1 protein to this region, inducing activation [57]. Current models of trxG-mediated activation suggest that the SET-domain factors induce H3K4 trimethylation which is recognized by ATP-dependent chromatin remodelers [51]. Remodeling of chromatin either by exchange of nucleosomal subunits, by sliding the nucleosomes, or by looping out of nucleosomal DNA provides permissive environment for transcription [58].
Apart from PcG and trxG proteins, there are other chromatin-modifier complexes that regulate transcription. Among these are the ATP-dependent chromatin remodelers similar to SNF: NuRD/Mi-2/CHD and INO80 families [58]. Such as the bromodomain of SWI/SNF proteins recognizing acetylated histone tails, NuRD/Mi-2/CHD family members have unique tandem chromodomains that recognize methylated histone tails. INO80 family members, on the other hand, are characterized by split ATPase domains. All ATP-dependent chromatin remodelers are highly conserved from yeast to human, indicating their essential functions in variety of cellular processes. They have both shared and unique roles. All are capable of both inducing and repressing transcription, depending on the local chromatin context. Unique processes involve roles of ISWI family members in chromatin assembly after DNA replication, SWI/SNF and INO80 family members in double strand-break repair, and NuRD/Mi-2/CHD members in maintenance of
13 pluripotency in ES cells [58]. Deregulation of these essential complexes therefore contributes to uncontrolled cell growth and complex diseases.
1.3 Epigenetics of Germ- and Stem-Cells
Stem cells and germ cells bear completely different epigenetic regulation of the genome when compared with somatic cells, which also are significantly different from each other. This is reasonable, since differentiation genes are switched off in these cells; gene expression should be adjusted to maintain the dedifferentiated state. How these choices are made and the mechanisms involved are of great interest both because the differentiation phenomenon is not completely understood yet and because of the therapeutic potential of stem-cell research. Recent knowledge regarding stem- and germ-cell epigenetics is therefore presented here.
There are two main classes of stem cells: embryonic and adult (or somatic) stem cells. Embryonic stem cells (ESCs) are pluripotent (‘plural potency’), meaning that they can give rise to the three different cell lineages; ecto-, meso- and endo-derm, but not to extra-embryonic tissues. ESCs are established from the totipotent blastomeres within the inner cell mass of blastocyst. The zygote and early blastomeres are totipotent (‘total potency’), they can give rise to the whole organism. The difference between totipotent and pluripotent states is vastly an issue of epigenetics. Zygotic division is termed cleavage and regulated by maternal factors that exist within the egg that contribute to zygotic transcription also. Among the maternal factors are pluripotency factors like Sox2 and Oct3/4 and many chromatin-modifying enzymes like PcG proteins, histone-modifiers and chromatin remodelers that help reactivate the quiescent genome. The zygote is thus intrinsically regulated and does not have self-renewal capacity. ESCs, on the other hand, operate their own expression, are responsive to external signals and are capable of self-renewal. Pluripotency only exists transiently in a developing embryo, until the gastrulation stage. The exception is the germ-cell lineage that expresses pluripotency factors after gastrulation [59, 60].
14 How pluripotency is maintained is a highly debatable issue; however transcription of pluripotency factors were shown to be a pre-requisite. ChIP-Chip experiments show that in human ES cells, 3 major factors, OCT3/4, SOX2 and NANOG, together bind to the promoter regions of 2260 genes, 1303 of which are actively transcribed and 959 of which are inactive genes, creating a complex gene network that can be regulated by these factors [59]. However, the criteria for choice of some genes instead of others and the resulting epigenetic modifications that lead to maintenance of pluripotent state have not been adequately delineated. Bivalent chromatin marks, meaning the chromosomal regions that carry both repressive and permissive histone modifications in adult tissues, are considered signs of pluripotency-related genes however this hypothesis has not been proved yet [47, 61].
Adult stem cells emerge when ESCs somehow differentiate and lose pluripotency so that they now can give rise to cells of a specific lineage. Different types of adult stem cells, mainly mesenchymal and hematopoietic, have self-renewal capacity but are restricted in differentiation, thus they are multi-potent [61]. Adult stem cells are found in minute amounts in bone marrow and stem-cell niches specific to some organs. Umbilical cord blood is a rich source of hematopoietic stem cell isolation [62].
Germ cells are the only cells that express pluripotency factors after gastrulation, as mentioned above. Since germ cells , when fused, are expected to give rise to a totipotent zygote at the end of their developmental program, their specialization includes repression of somatic differentiation followed by extensive erasure of the epigenetic modifications - like DNA and H3K9 methylation - in order to reprogram the whole genome. As a result, pluripotency factors like Sox2, Nanog, Stella and Nanos3 are reactivated. Although germ cells cannot give rise to diverse cell types, pluripotent cells can be obtained from them in vitro [60].
All cells within the body of an individual are differentiated under one specific lineage, except from germ cells and adult stem cells. Epigenetic mechanisms rule repression of inappropriate developmental programs temporally and spatially,
15 while maintaining heritability of current phenotypic states. The maintenance of cell fate is highly fulfilled by PcG and TrxG proteins. Strikingly, the nucleus of a differentiated somatic cell that has lost cellular potency can be reprogrammed by the maternal factors in the cytoplasm of an unfertilized egg, but also by ES and EG cells [59].
Expression of cancer-testis genes in germ cells, especially in testis, results from the differentially regulated epigenome of these cells. Germ cells and dedifferentiated cancer cells, or ‘cancer stem cells’, absolutely share some of the epigenetic mechanisms and pluripotency factors, that make them both express CT genes; however these factors are yet to be fully discovered and characterized.
1.4 Epigenetics of Cancer
Cancer is a complex disease that needs to combine many aberrant operations within the cell to emerge. A cancer cell acquires more and more capabilities as it accumulates genetic mutations and misregulation in non-mutated genes. Genetic and epigenetic aberrations cooperate within the pre-cancerous cell to make it acquire six capabilities as ‘hallmarks’ of cancer, meaning general to most cancers, as listed by Hanahan and Weinberg: Self-sufficiency in growth signals, insensitivity to anti-growth signals, evading apoptosis, limitness replicative potential, sustained angiogenesis, tissue invasion and metastasis [63]. The order of these events varies among different cancer types [63]. But the main questions are to understand the reason why and how a healthy cell quits the established intracellular and extracellular regulatory circuits and turns to uncontrolled cell growth. Cancer research yielded sound improvements in answering these questions, which are concerned by thousands of people all over the world. Tumor suppressor genes and oncogenes were discovered as a result of cancer research, as genes inactivated and promoted in cancer, namely cancer genes [64, 65]. They sure have roles in prognosis of cancer because there is an established idea that each cancer gene brings an advantage to the cancer cell in terms of gaining the capabilities mentioned above [64, 65]. The cellular pathways abused by cancer cells are
well-16 characterized, however the causes or effects of these events on the whole genome are still not exactly known.
Although Hanahan and Weinberg did not mention about epigenetics as an important acting mechanism in carcinogenesis, we today know that epigenetic aberrations are as destructive as genetic ones in the route to uncontrolled cell growth [66]. In fact, regarding these two phenomena as two different incidents would be a big mistake since they are closely linked to each other. For example, candidate genetic alterations affecting genes involved in the great epigenetic machinery, like DNMTs, histone acetylases and deacetylases, and the SWI/SNF chromatin remodeling complex were proposed to be causes of epigenetic aberrations that are in turn exerted by these proteins within cancer cells [67]. The epigenetic aberrations shown to contribute tumorigenesis include changes in DNA methylation, histone modifications, chromatin remodeling, and regulation of small RNAs [67-72]. Involvement of chromosomal higher-order structure and non-coding transcripts are newly being studied [73-75]. In other words, every aspect of epigenetic systems is affected from the carcinogenesis process and they also exert broad range of changes to many sites of the genome. Another scenario of cancer progression attributes a much more major role to epigenetic factors. In this scenario, polyclonal epigenetic disruption of cancer stem cells leads to accumulation of later genetic and epigenetic aberrations which are required for tumor progression [76].
Among the above mentioned epigenetic alterations in cancer, aberrant DNA methylation is the most detailedly studied of all; thus will be the main focus of this section. Both aberrant hypo-methylation and hyper-methylation take place, examplified by misregulation of cancer-testis genes and tumor suppressor genes, respectively [68, 77] . Since hyper-methylation of TSGs have more direct affect on cellular proliferation as boosting cell growth [78], many researchers are trying to understand which TSGs are aberrantly methylated and at what stage of carcinogenesis these events take place. The first TSG promoter shown to be hyper-methylated in a human cancer belongs to the Retinoblastoma gene, and was discovered in 1989 [79]. However, hypermethylation of CpG islands being a
17 common mechanism of TSG inactivation in cancer was widely accepted when p16INK4a was also shown to be inactivated by hypermethylation in 1995 [80-82]. After this discovery, many researchers focused on searching new tumor suppressor genes that are epigenetically inactivated and succeeded in finding BRCA1, RASSF1, estrogen, androgen, progesterone and retinoic acid receptors in this class as striking examples [83-87]. On the other side, many key TSGs are proved to be normally methylated, like BRCA2, PTEN and p19INK4d [88-91]. Today, 100-400 CpG islands are estimated to be hyper-methylated in a given tumor [92] and many key cellular pathways suffer from inactivation of the TSGs, like the p53 network, cell cycle, DNA repair, apoptosis, hormone and vitamin response, etc. [93].
CpG hypermethylation of TSGs are rather specific to different types of tumors, both in sporadic tumors and in familial-inherited cancers, where it acts as a ‘second hit’ [94]. The ‘methylotype’ of a given tumor is the term used for the complete profile of CpG island methylation throughout the genome. The methylotype data for various tumors, although limited to known CpG islands, indicate that tumors of gastrointestinal origin (esophagus, colon, stomach) are significantly more methylated than others like ovarian tumors [92]. Exposure to external carcinogens within this tract is the most possible answer [67]. The methylotype data points methylation hot spots on human chromosomes 3p, 1p35 and 11p15 where multiple genes are hyper-methylated, thus the region behaves like a large loss of heterozygosity locus [67, 95-97].
CpG island hypermethylation is common to many types of cancer and seems to have a deep impact in cancer progression. In order to proceed in answering the key questions regarding hyper-methylated TSGs and all other components affected from aberrant DNA methylation (miRNAs, DNA repeats, oncogenes, CT genes etc.), the necessity to plot a human epigenome map arouse. The Human Epigenome Project aims to produce the tissue-specific DNA methylation profiles of the human genome and is thus under construction [98]. The Human Epigenome Pilot Project is completed and first data of the main project came from human chromosomes 6, 20 and 22 [98]. Once finished, the results will profoundly
18 enhance our understanding of both the targets of epigenetic machinery and the operation criteria of this machinery as well.
19
2
MATERIALS & METHODS
Cell Lines and Culturing
HCC cell lines HCT15 and Colo205 were grown in RPMI media (HyClone #SH30027.01); HCT116 and LoVo were grown in DMEM (HyClone #SH30307) for bisulfite sequencing analysis. All media were supplemented with 10 % FBS (HyClone #SH30160.03), 1% peniclllin/streptomycin (HyClone #SV30010), 1 % L-glutamine (HyClone #SH3004.01) and 1 % non-essential amino acids (HyClone #SH30238.1). Media were changed every three days; cells were split while exponentially growing. DNA from above cell lines plus Ls174T and Lim1215 was used for PCR detection.
DNA and RNA extraction
DNA from appropriate cell-lines for bisulfite sequencing experiments was extracted with UltraCleanTissue DNA Isolation Kit (MoBio #12334). Peripheral blood lymphocyte DNA was extracted from whole blood with hypotonic swelling method. RNA was extracted from all cells by Tri-reagent (MRC #TR 118). DNase I treatment (DNA-Free Kit, Ambion #AM1906) was performed after extracting the RNA.
2.1 Expression Analyses of Putative TSGs
Selection of Putative Tumor Supressor Genes on X chromosome
X-chromosome genes that are downregulated, with respect to their normal counterparts, in any human cancerous tissue except from embryonic and germline origin were identified by analyzing SAGE Digital Gene Expression Displayer and cDNA Digital Gene Expression Displayer databases of the Cancer Genome
20 Anatomy Project based on SAGE and EST libraries [99]. Among existing EST libraries, 269 libraries of cancerous tissues versus 339 libraries of healthy tissues were screened. Among existing SAGE libraries, 78 libraries of cancerous tissues versus 182 libraries of healthy tissues were screened. Significance filter was adjusted to p<0.05. 59 genes were obtained based on the above criteria. Extracted data were checked by using Monochromatic SAGE/cDNA Virtual Northern. Among the 59 genes, 8 genes that have a neighboring cancer-testis (CT) gene were chosen and expression analyses were made to verify the database data. These 8 genes were located at least 30kb and at most 560kb from a CT gene.
Conventional and Real-Time PCR
Primer Ts were calculated according to the formula: Tm = 69.3oC + 0.41 (%GC) - 535/n, where n is primer length. Conventional PCR was carried out under the conditions of 94oC for 10 min followed by 35 cycles of 94oC for 60s, appropriate melting temperature for 60s, 72oC for 60s, with a final extension at 72oC for 10 min, in Techgene thermal cycler (Techne), and run on 1.5% agarose gel at 90V for 45 min. DyNAzyme II HS DNA polymerase (Finnzymes #F-504), dNTP mix (Finnzymes #F-560), forward and reverse primers at final concentrations of 0.03 U/µl, 250 µM, 500 nM, respectively, were used. GAPDH was used as positive control. For real-time PCR, efficiency curves of candidate genes were plotted and 1:5 dilution was chosen. 4 housekeeping genes, GAPDH, 18S rRNA, TFCP2[100] and GOLGA1 [101], were tested as candidates to normalize the real-time data. Analyses of these genes by GeNorm program [102] lead to choice of TFCP2 and GOLGA1 for normalization. Real-time PCR experiments were carried out in Bio-Rad iCycler under the same setup explained above followed by melting curve analyses. Sybr Green dye (DyNAmo HS SYBR Green qPCR Kit, Finnzymes #F-410L) was used for measurement of DNA amount. Genes were normalized according to delta-delta Ct method.
2.2 Methylation Analyses of Putative TSGs
21 A region including 3000 bases upstream of transcription start sites were analyzed for presence of CpG islands by using CpG Island Searcher [103] and CpGPlot [104] programs according to the following criteria: Observed/expected ratio > 0.60, percent C + percent G > 50.00, length > 200
Bisulfite Sequencing
400 ng DNA from HCT15, HCT116, Ls174T, LoVo, Colo205 and Lim1215 cells was sodium bisulfite treated with EZ DNA Methylation-Gold Kit (Zymo Research #D5005) according to manufacturer’s instructions. 2 µl of 1:10 diluted bisulfite-modified DNA was amplified by conventional PCR under conditions of 94oC for 10 min followed by 35 cycles of 94oC for 60s, appropriate annealing temperature for 60s, 72oC for 60s, with a final extension at 72oC for 10 min, in Techgene thermal cycler (Techne), run on 1.5% agarose gel at 90V for 45 min, gel extracted (QIAquick Gel Extraction Kit, Qiagen #28704) and sequenced (Iontek). Cytosines within CpG dinucleotides were accepted to be methylated if C/T (or G/A) ratio is more than 50 % among the cell population. Primers used for analyzing sodium bisulfite modified DNA are listed in Table 3.
2.3 Analyses of Higher-Order Chromosomal Structure
Detection of Inverted Repeats
Sequences that correspond to regions encompassing NY-ESO-1/LAGE1, CT45 and MAGE-A family of genes were analyzed by using the Inverted Repeats Finder Program [105] Public Database project. Sequence complementarities were verified by MegAlign (DNAStar).
Chromosome Conformation Capture (3C)
HCC1937, FOCUS, Colo205, HT29, SK-LC-17 cell lines were grown to 80% confluency in RPMI media (PAA #E15-039) supplemented with 10 % FBS (PAA #A15-103), 1% peniclllin/streptomycin (Gibco #15140) and 1 % L-glutamine (Gibco #25030). Cells were trypsinized (Hyclone #SH30042), centrifuged and resuspended in 45 ml of fresh RPMI media. For performing the 3C experiment with tissues,
22 normal thyroid and gall bladder were first dissected, passed through a 70 µm cell-strainer (BD Falcon #352350), centrifuged and resuspended in 45 ml of fresh RPMI media. In presence of 1% formaldehyde, cells were crosslinked for 10 min at RT; quenched, resuspended in ice-cold lysing solution supplemented with 100 µl complete protease inhibitor cocktail (Sigma #P8340) and homogenized in a bounce homogenizer with pestle B. Following wash steps, nuclei from 5x10⁶ cells were digested with 30U of appropriate restriction endonuclease, overnight with conventional restriction endonucleases (Fermentas BglII #ER0081,EcoRI #ER0271, GsuI #ER0462, XceI #ER1471) and for 2 hours with Fast-Digest enzymes (Fermentas BglII #FD0074, EcoRI #FD0274, XceI #FD1474). 1x10⁶ restriction-digested nuclei were used for ligation for 2 hours at 16oC with 30U of T4 DNA ligase (Promega #M1804, Fermentas #EL0012). Cross-links were reversed overnight at 65oC by Proteinase K (100 µg/ml). DNA was phenol/chloroform extracted, ethanol precipitated and resuspended in appropriate amount of TE buffer. DNA concentrations were measured at Nano-Drop UV/Vis spectrophotometer (Thermo). Chromatin in the absence of formaldehyde and T4 DNA ligase were used as not cross-linked and unligated negative controls and processed similarly in the following steps.
Final chromatin preparations were analyzed by conventional PCR with the primers listed in Table 4 under the setup: 94oC for 10 min followed by 35 cycles of 94oC for 30s, appropriate annealing temperature for 30s, 72oC for 30s with a final extension at 72oC for 10 min, in Perkin-Elmer 9700 thermal cycler. DyNAzyme II HS DNA polymerase (Finnzymes #F-504), dNTP mix (Finnzymes #F-560), forward and reverse primers were used at final concentrations of 0.03 U/µl, 250 µM, 500 nM, respectively. Samples were run on 1.5 % agarose-gel at 90V for 45 min. Detected bands were gel extracted and sequenced for verification.
Analyzed interactions were normalized for bias in 3C efficiency to a control interaction at the γ-actin region [106]; and for PCR-bias of primer pairs to interactions of similarly processed BAC (bacterial artificial chromosome) clones RP11-103M23 (for NY-ESO-1 region), RP11-111C16 and RP11-299H1 (for CT45 region).
23
5-Aza-2’-deoxycytidine Treatment
HT29 and Colo205 cells were treated for 2 days with 5-Aza-2’-deoxycytidine (Sigma #A3656) at 1 µM final concentration in RPMI media. The cells were then washed with PBS and used for 3C analysis at subsequent steps. RNA from AZA-treated and -unAZA-treated cells was also isolated and expression levels were analyzed by RT-PCR (Finnzymes DyNAmo cDNA Synthesis Kit #F-470).
Table 1 Genetic information regarding selected putative TSGs
Gene Name Accession # Chromosomal Gene Length mRNA length
Region (bp) (bp) Aminolevulinate, delta-, synthase 2 (sideroblastic/hypoch romic anemia) (ALAS2) NT_011630.14 Xp11.21 21924 1941 (NM_000032) 1830 (NM_001037967) 1937 (NM_001037968) 1745 (NM_001037969)† Cerebellar degeneration-related protein 1 (CDR1) NT_011786.15 Xq27.1-q27.2 1299 1299 (NM_004065.2) Gamma-aminobutyric acid (GABA) A receptor, alpha 3 (GABRA3) NT_011726.13 Xq28 283304 2785 (NM_000808) Hypothetical protein LOC286411 NT_011786.15 Xq27.1 20529 1607 (XM_932619.3) Ras-related GTP binding B (RRAGB) NT_011630.14 Xp11.21 41029 2217 (NM_016656) 2133 (NM_006064)†
Solute carrier family 9 (Na+/H+ exchanger),
member 6 (SLC9A6)
NT_011786.15 Xq26.3 61843 4742 (NM_001042537)
4646 (NM_006359)†
SLIT and NTRK-like family, member 2 (SLITRK2) NT_011681.15 Xq27.3 8011 5022 (NM_032539) Zinc finger, CCHC domain containing 12 (ZCCHC12) NT_011786.15 Xq24 3145 2212 (NM_173798.2)
† the isoforms used when indicating amplified regions for gene expression
24
Table 2 Primers used for expression analyses Gene
Name Sequence of Primer
Region amplified and amplicon length (bp) Tm (oC) ALAS2 F: 5`- AGGGTGCGAGATTTACTCAGAC R: 5`- ATTCTAGAGCTCCAGAGAGCAC 678 - 1156 (479) 65 65 CDR1 F:5`- TCGGAAGCTATGGATTTGAGGG R:5`- TCCAGCCAATATATGTCTTCCTGAAG 400 - 802 (403) 65 66 GABRA3 F:5`- GCTAGTAAGATCTGGACACCG R:5`- TTCCACGGATTTGTTCTTTCCGAG 666 - 935 (270) 65 66 LOC286411 F:5`- GGTGAAAGACACTCATCCAGATG R:5`- TCGGTGTGCCTTTGGATATGTC 135 - 516 (382) 66 65 RRAGB F:5`- TCTGGTAAGACCAGCATGAGG R:5`- GGAAGATGTTGTCCCGTTGG 733 - 928 (196) 65 65 SLC9A6 F:5`- CTTGGGTCTATCCTAGCATACG R:5`- TCGCTGTGACATCAAAGGTGTG 561 - 897 (337) 65 65 SLITRK2 F:5`- CCCACTTCCTGAAGATGCTAAAC R:5`- CACCTTCGGTGTCAACTCAG 1333 - 1585 (253) 66 65 ZCCHC12 F:5`- CTTGAATTCTGTGCAGCTGATTGC R:5`- ACACGTGCAATGATGCTAGCC 204 - 496 (293) 66 65
Table 3 Primers used for bisulfite sequencing experiments
Gene
Name Sequence of Primer
Region amplified and amplicon length (bp) Tm (oC) # of CpGs ALAS2 F: 5`- GTAGTAAGTTTTGGGTGGGAAGTTG R: 5`- CTCCCCTTTTACTAACAACCTCTTC (+4865) to (+5188) of TSS (324) 66 66 3 [(-99) to (+225) of 3rd exon] CDR1 F: 5`- ATTGGGTAGTTGTTGGAAGATATGAAG R: 5`- CTTCCATCAAATTAATATCTTCCAACCTAC (-9) to (+334) of TSS (343) 65 65 8 ZCCHC12 F: 5`- AGTTTAGGGAGAAGGGAYGG R: 5`- CCRCCCAATACTAATAAATCTTCCC (-263) to (+249) of TSS (512) 65 66 41
25
Table 4 Primers used for the 3C assay Primer
number Sequence of Primer Tm (
o C) Amplicon length (bp) 1 5’GGGGAAGCCTAACACACTGG 67 276 9 5’TTGCCCAGGCTGGTCTCAC 67 2 5’AGGAAGGAAGACACAGAGCTG 65 192 10 5’CTCCGAAAGTGCTGGGATTATAG 66 3 5’TGGACTCGTGGCCAGGTTTG 67 281 11 5’GGTCTCACCAGGGACAACTG 67 4 5’TCCTCTAACCGCGTGTGACG 67 174 12 5’GGATATTGTTAGTTGTCACAACAGGAC 66 5 5’AGAGAGCAAGTCAGGACTGTG 65 336 7 5’GACAAAATTCGGTCAGCACAAGTAAATAG 66 6 5’CACCCACATCTGATCTTGAAGTG 66 173 8 5’TGCACATTCTCCAACAGGCATC 65
Table 5 Primers used for analyses of non-coding transcripts
Primer name Sequence of Primer Tm (oC) Amplicon
length (bp) A_F 5`- AGCACAGCGTGCAGGTGGAC 69 209 A_R 5`- GAGATCTTCCAGCTGCATTCC 65 B_F 5`- CACTGGCCCCAATTAGGAAGAAC 67 275 B_R 5`- GAAGGCCTCATATCCCAATTCTAGC 68 C_F 5`- CAAGGAAGTTTTGTGGAGTAAGGAAGG 68 234 C_R 5`- CTAGGCTTTCTTCAGTCCCCAAAC 68 D_F 5`- GACAGGGTCACATGCACTTTAC 65 387 D_R 5`- CCCGACTTGATCATTACATCGTG 66 E_F 5' - CAGGGCTGAATGGATGCTGCAGA 70 337 E_R 5' - GCGCCTCTGCCCTGAGGGAGG 70 F_F 5`- TGCATACCCTTCCAGCTGTAGG 67 365 F_R 5`- GGAGAAACCTTGGACAATACCCG 67 G_F 5`- GTTAAATTAGAGCGCATTCATATTGCG 65 176 G_R 5`- CTCACCCACTGCAAACATTCAATG 66
26
Table 6 Primers of normalization genes used for all assays
Primer name Sequence of Primer Tm (oC) Amplicon
length (bp) GAPDH_F 5`- GACCACAGTCCATGCCATCACT 67 454 GAPDH_R 5`- TCCACCACCCTGTTGCTGTAG 67 GOLGA1_F 5`- AGATACGGAAGTTAGAGGCCAG 65 200 GOLGA1_R 5`- GTCCTTTCTGGCTAATGCCAAAG 66 TFCP2_F 5`- AAGAAGAGTCGAGTTTGCCTCC 65 200 TFCP2_R 5`- CTTCACCAATTTGCCATTAATTTCTGG 65 18S rRNA_F 5`- CGTGCATTTATCAGATCAAAACCAACC 66 135 18S rRNA_R 5`- ATGGTAGGCACGGCGACTAC 67 γ-actin_F 5' - GCTGTTCCAGGCTCTGTTCC 67 337 γ-actin_R 5' - GCGCCTCTGCCCTGAGGGAGG 67
27
3
RESULTS
3.1 Identification of X-linked CT-Proximal Putative Tumor-Suppressor Genes
CT genes are known to be induced in many cancer types by hypomethylation of promoter or the whole gene. 5-Aza-2’-deoxycytidine induction of CTs verifies activation by DNA hypomethylation also. On the other hand, region-specific hypermethylation is known to affect many genes, especially tumor suppressors, which contributes to tumorigenesis/metastasis through their silencing. Although the hypo- and hyper-methylation phenomena are widely referred, exact mechanisms of how these controversial events occur are not known yet. The only knowledge in hand is about the enzymes exerting these effects in the final steps, namely DNMTs and putative de-methylases. In order to approach this mechanistic problem in a more detailed manner, we have identified candidate regions on the X chromosome which involve both hypomethylated and hypermethylated sites in close proximity. Since CT genes are already known to be hypomethylated in cancer, we selected CT-proximal genes that are hypermethylated - and thus down-regulated- in cancer, which we refer as putative tumor suppressor genes (pTSGs). X-linked genes that are down-regulated, with respect to their counterparts in normal tissues of same origin, in any human cancerous tissue except from embryonic and germline origin were identified by analyzing SAGE Digital Gene Expression Displayer and cDNA Digital Gene Expression Displayer databases of Cancer Genome Anatomy Project based on SAGE and EST libraries [99]. 59 genes were obtained based on the above criteria (available in Appendix C). Extracted data were checked by using Monochromatic SAGE/cDNA Virtual Northern. Among the 59 genes, 8 genes that have a neighboring cancer-testis (CT) gene were chosen and expression analyses were made to verify the in silico data, as presented in
28 sections 3.2 and 3.3. The 8 chosen putative TSGs are tabulated in Table 7 together with the neighboring CT genes and chromosomal locations.
Table 7 X-linked putative TSGs and the proximal CT genes
pTSG Neighboring CT gene(s) Approximate distance in between (kb) Chromosomal location
ALAS2 PAGE2B, PAGE2 44, 58 Xp11.21
CDR1 SPANXB1 220 Xq27.1
GABRA3 MAGE-A10, -A6 30, 250 Xq28
LOC286411 SPANXB1 290 Xq27.1
RRAGB XAGE4 60 Xp11.21
SLC9A6 SAGE1, CT45 cluster 50, 80 Xq26-26.3
SLITRK2 SPANXN1 560 Xq27-27.3
ZCCHC12 IL13RA1 30 Xq24
3.2 Validation of Virtual Data by Conventional RT-PCR
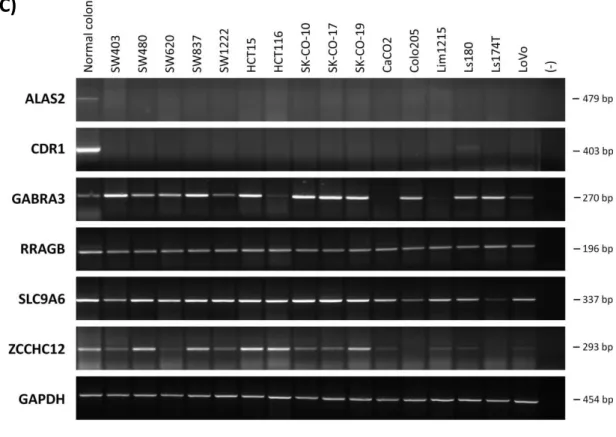
Firstly, mRNA expression of the 8 genes was tested using conventional RT-PCR in a panel of normal tissues. All genes but LOC286411 and SLITRK2 exhibit some expression in normal tissues, indicating that their products are not strictly tissue-specific, although GABRA3 and ZCCHC12 seem to show some tissue specificity (Figure 1A). LOC286411 is likely to encode a testis-specific product, thus is probably a false-positive of the CGAP database. Those genes that have mRNA expression in normal colon and lung tissues were tested in lung and colon cancer panels. 2 genes, ALAS2 and CDR1 showed dramatic down-regulation in several lung and colon cancer cell lines. Since CDR1 is an intronless gene, negative RT PCRs were carried out in DNAse I treated and non-treated samples (Appendix D). GABRA3, SLC9A6 and ZCCHC12 genes showed down-regulation only in some cell lines; whereas RRAGB did not exhibit significant down-regulation in neither lung nor colon cancer cell lines, however, this could occur due to the low-sensitivity of
29 the assay (Figure 1B,C). As a result of the RT-PCR assay, 6 out of the 8 genes, namely ALAS2, CDR1, GABRA3, RRAGB, SLC9A6 and ZCCHC12 were selected to be putative TSGs and assessed by further experiments.
A)
30
C)
Figure 1 mRNA expression levels of 8 putative tumor suppressor genes on X chromosome in normal tissue (A), lung cancer (B) and colon cancer (C) panels, by conventional RT-PCR. Two genes, ALAS2 and CDR1 are significantly down-regulated in most lung and colon cancer cell lines, while others showed variable down-regulation.
3.3 Validation of Virtual Data by Real-Time RT-PCR
In order to quantify the mRNA expression levels, we aimed to analyze the transcripts of 6 genes whose expression were subject to change, ALAS2, CDR1, GABRA3, RRAGB, SLC9A6 and ZCCHC12, by real-time RT-PCR. Firstly, we had to identify ‘housekeeping’ genes with mRNA expressions more stable than GAPDH, to be used for normalization of expression in our normal tissue, lung cancer and colon cancer panels. 4 genes - GAPDH, 18S rRNA, GOLGA1 [101] and TFCP2 [100] - were analyzed as candidates for normalization by the GeNorm software and 2 of these genes – TFCP2 and GOLGA1 - were shown to be the best choices (Appendix
E). The background information and basics of GeNorm software are presented in Appendix E. After identification of genes for normalization, we analyzed the 5
31 0 5 10 15 20 25 30 F o ld d if fer ence in ex p res sion Normal tissues 0 1500 3000 4500 6000 7500 Fo ld di ffe ren c e in e x pre s s io n Normal tissues
selected genes by real-time PCR. Data were normalized according to the delta-delta Ct method. All normal tissues were normalized relative to mRNA expression
in testis tissue. Lung and colon cancer cell lines were normalized relative to their normal counterparts. Figure 2 shows that, these individual genes were expressed at similar levels in different healthy tissues with some exceptions: ALAS2 was highly expressed in placenta and lung; CDR1 was highly expressed in brain and breast; and GABRA3 was highly expressed in brain.