ISTANBUL BİLGİ UNIVERSITY INSITUTE OF GRADUATE PROGRAMS
FINANCIAL ECONOMICS MASTER’S DEGREE PROGRAM
THE EFFECT OF EDUCATIONAL SPENDING ON GDP GROWTH A PANEL DATA ANALYSIS
AHMET UZUNER 1176220013
ASSOC. PROF. SERDA SELİN ÖZTÜRK
ISTANBUL 2020
ii PREFACE
I would like to express my gratitude to my advisor Assoc. Prof. Serda Selin Öztürk for her guidance and patience. During my thesis process, she replied my all questions patiently and despite her time constraint, she replied all my e-mails quickly. Without her aid and support, this thesis would not be easy for me. Secondly, I would like to thank the other lecturers who taught me during the courses I took in the graduate program. Although I do not educated a social science education before this master program, they have a large share in my competence in economic and financial fields.
Lastly, I would thank to my mother Şeyma Uzuner, my father Ömer Metin Uzuner and my sister Serra Uzuner. In every stage of my life, they always supported me in my all decisions. They never refrain from providing effort and help for me. I feel lucky to have them.
iii
TABLE OF CONTENTS
PREFACE ... ii
TABLE OF CONTENTS ... iii
LIST OF ABBREVIATIONS ... vi
LIST OF TABLES ... viii
LIST OF GRAPHS ... ix
ABSTRACT ... x
ÖZET... xi
INTRODUCTION ... 1
CHAPTER 1 ... 1
1.1. Economy & Economic Growth ... 1
1.2. Definition of Human Capital ... 2
1.2.1. Human Capital Components ... 3
1.3. Importance of Education ... 4
1.3.1. What is Education? ... 4
1.3.2. The Aim of Education ... 4
1.4. Education System ... 5
1.4.1. Education System in Turkey ... 5
1.4.1.1. What is PISA? ... 6
1.4.2. Changes in Turkish Education System ... 6
1.5. Educational Spending in Turkey ... 7
1.6. Education in Other Countries ... 7
1.6.1. Education in OECD Countries ... 8
1.6.2. Education in Other World Countries... 9
iv
CHAPTER 2: LITERATURE REVIEW ... 11
CHAPTER 3: METHODOLOGY ... 23
3.1. Aim and Significance of The Study ... 23
3.2. Limitations of The Research ... 23
3.3. Research Model and Hypotheses ... 24
3.4. Pedroni Cointegration Test ... 24
3.5. Panel Unit Root Test ... 25
3.5.1. Phillips-Perron Unit Root Test ... 26
3.6. Panel Causality Test ... 26
3.7. Panel FMOLS and DOLS Estimates ... 27
3.8. Panel Least Squares Analysis... 27
CHAPTER 4: DATA & RESULTS OF OECD COUNTRIES ... 28
4.1. Data of OECD Countries ... 28
4.2. Results of OECD Countries ... 36
4.2.1. Results of Panel Unit Root Tests ... 36
4.2.2 Results of Panel Cointegration Analysis ... 37
4.2.3 Results of Panel Least Squares Analysis ... 37
CHAPTER 5: DATA & RESULTS OF OTHER COUNTRIES ... 39
5.1. Data of Other Countries ... 39
5.2. Results of Other Countries ... 46
5.2.1. Results of Panel Unit Root Tests ... 46
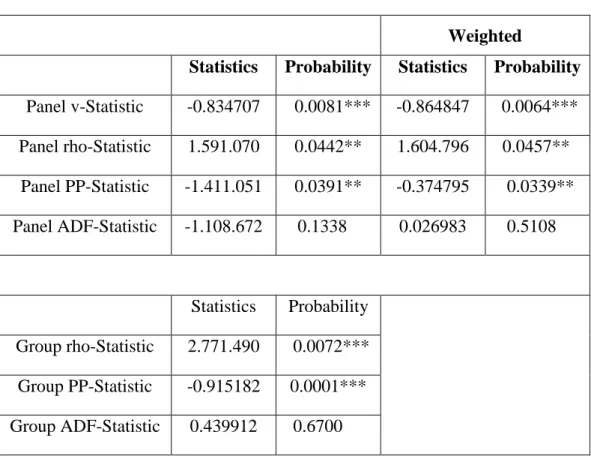
5.2.2. Results of Pedroni Cointegration Test ... 47
5.2.3. Results of Granger Causality Test... 50
5.2.4. Results of FMOLS & DOLS Estimates ... 50
v
CHAPTER 6 ... 52 REFERENCES ... 54 APPENDIX ... 58
vi
LIST OF ABBREVIATIONS
GDP Gross Domestic Product
FMOLS Fully Modified Ordinary Least Squares DOLS Dynamic Ordinary Least Squares
PISA Programme for International Student Assessment
OECD Organisation for Economic Co-operation and Development OEEC Organisation for Economic Co-operation in Europe
US United States
G-20 Group of 20
PWT9 Penn World Tables
ARDL Autoregressive Distributed Lag Bound
ADF Augmented Dickey Fuller
PP Phillips Perron
EDUSPD Educational Spending
INF Inflation
CURR Currency Rate
EXC Currency Exchange
TL Turkish Lira USD US Dollar EUR Euro CHF Swiss Frank DKK Danish Krone HKD Hongkong Dollar
vii
ZAR South Africa Rand
ARS Argentina Peso
viii
LIST OF TABLES
Table 1.1 Human Capital Components ... 3
Table 4.1 Descriptive Statistics for the Education Expenditures of Five European OECD Countries ... 29
Table 4.2 Descriptive Statistics for the Inflation Rates of Five OECD European Countries ... 31
Table 4.3 Descriptive Statistics for the Exchange Rates of Five European OECD Countries ... 33
Table 4.4 Descriptive Statistics for the GDPs of Five European OECD Countries ... 34
Table 4.5 Results of Panel Unit Root Tests ... 36
Table 4.6 Results of Panel Cointegration Analysis ... 37
Table 4.7 Results of Panel Least Squares Analysis ... 38
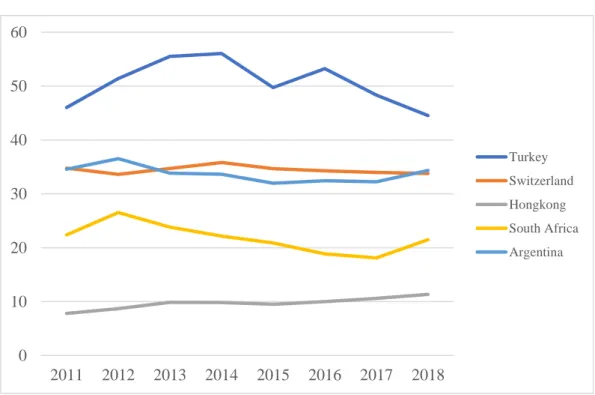
Table 5.1 Descriptive Statistics for the Education Expenditure of other countries ... 40
Table 5.2 Descriptive Statistics for Inflation Rates of Other Countries ... 41
Table 5.3 Descriptive Statistics for the Exchange Rates of Other Countries ... 43
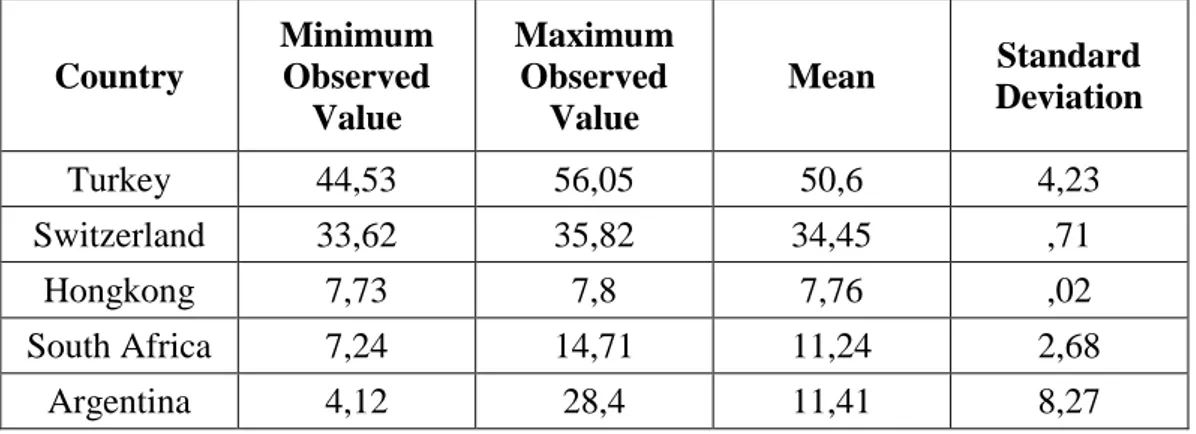
Table 5.4 Descriptive Statistics for GDP of Other Countries ... 44
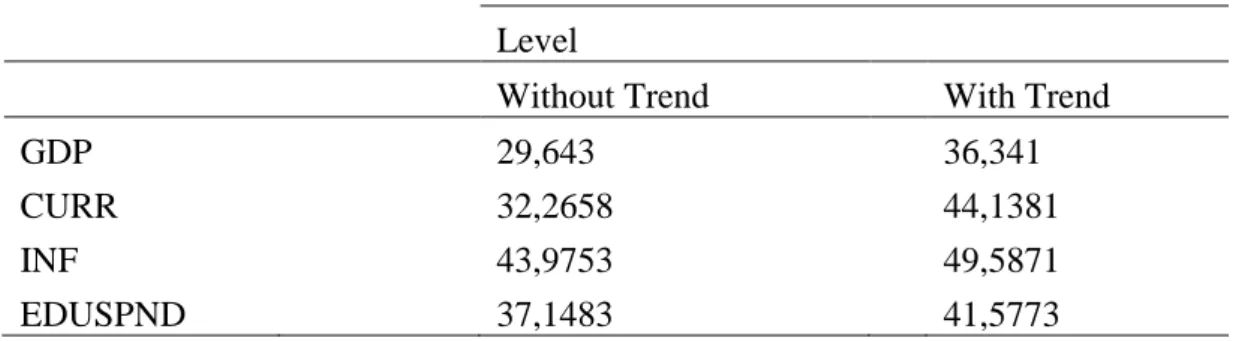
Table 5.5 Results of Panel Unit Root Tests ... 46
Table 5.6 Delay Length of Variables ... 48
Table 5.7 Results of Pedroni Cointegration Test ... 49
Table 5.8 Results of Granger Causality Test ... 50
ix
LIST OF GRAPHS
Graph 1.1 Growth in Turkey and The World ... 1 Graph 4.1 Mean of the Education Expenditures of Five OECD European
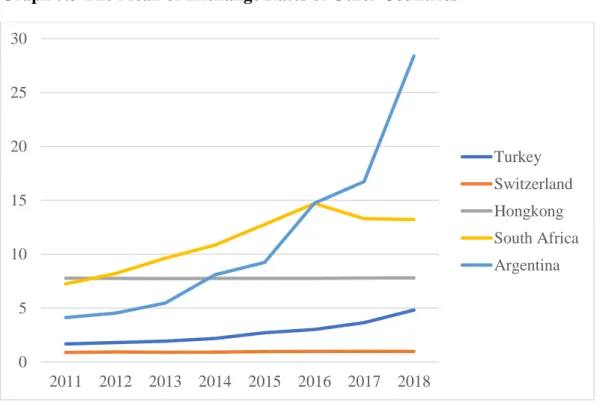
Countries for 2011-2018 Period ... 31 Graph 4.2 The Mean of the Inflation Rates of Five OECD European Countries for 2011-2018 Period ... 32 Graph 4.3 The Mean of the Exchange Rates of Five OECD European Countries for 2011-2018 Period ... 34 Graph 4.4 The Mean of the GDPs of Five OECD European Countries for 2011-2018 Period ... 35 Graph 5.1 The Mean of the Education Expenditure of Other Countries for 2011-2018 Period ... 41 Graph 5.2 The Mean of the Inflation Rates of Other Countries for 2011-2018 Period ... 42 Graph 5.3 The Mean of Exchange Rates of Other Countries ... 44 Graph 5.4 The Mean of GDP of Other Countries ... 45
x ABSTRACT
Economic growth and constitutional changes of community is only achievable with physical and human capital. The power of a country depends on the grade of education and knowledge that the citizens of that country have. The most critical element of human capital can be characterized as education. Increase of education level will also escalate human capital. Recent studies on the literature on economic growth have highlighted the role of human capital. Some of these empirical studies examined the aspect of educational spending on GDP growth and focused on this relationship. In this paper the impact of educational spending on GDP growth has been tested by a panel data analysis. This analysis consists of two different groups of 5 countries, one of which is OECD countries (Turkey, Finland, Switzerland, France and Denmark) and the other of which is World countries (Turkey, Switzerland, Hongkong, South Africa and Argentina) for the period from 2011 to 2018. In addition to educational spending, other explanatory variables such as inflation and average currency rate were used in the analysis. In the study, for both groups, the relationship have been tested by using Pedroni cointegration and panel least squares methods. According to results, there is a positive and significant relationship between educational spending and GDP growth.
Keywords: Education, Educational spending, GDP growth, Panel cointegration analysis, Panel least squares method, FMOLS and DOLS estimates
xi ÖZET
Bir toplumun ekonomik büyümesi ve yapısal değişimleri ancak beşeri ve fiziki sermaye ile mümkün olmaktadır. Bir ülkenin gücü, ülkedeki vatandaşların eğitim seviyesi ve bilgi birikimine de bağlıdır. İnsan sermayesinin en önemli parçası ise eğitim olarak tanımlanabilir. Eğitimin artmasıyla beraber beşeri sermayede artmaktadır. Son yıllarda ekonomik büyüme üzerine literatürde yapılan çalışmalarda beşeri sermayenin ekonomik büyüme üzerindeki rolünü vurgulamaktadır. Bazı ampirik çalışmalar eğitim harcamalarını büyüme üzerindeki etkilerini incelemekte ve aradaki bu ilişkiye odaklanmıştır. Bu çalışmada eğitim harcamalarının ekonomik büyüme üzerindeki etkisi panel data analizi kullanarak test edilmiştir. Analiz 2011-2018 için 5 ülkeden oluşan ve bir grup OECD ülkeleri (Türkiye, Finlandiya, İsviçre, Fransa ve Danimarka) diğeri ise dünya ülkeleri (Türkiye, İsviçre, Hongkong, Güney Afrika ve Arjantin) olmak üzere iki farklı ülke grubu içermektedir. Eğitim harcamalarına ek olarak enflasyon ve ülkelerin yıllık kur ortalamaları gibi diğer açıklayıcı değişkenler de analizde kullanılmıştır. İki ülke grubu için de aradaki ilişki Panel Pedroni eşbütünleşme testi ve panel en küçük kareler metodu kullanılarak test edilmiştir. Sonuçlara göre eğitim harcamaları ve büyüme arasında pozitif ve anlamlı bir ilişki mevcuttur.
Anahtar Kelimeler: Eğitim, Eğitim Harcamaları, GSYİH Büyümesi, Panel eşbütünleşme testi, panel en küçük kareler metodu, FMOLS & DOLS yaklaşım
1
INTRODUCTION
CHAPTER 1
1.1. Economy & Economic Growth
Economy is one of the most important concepts for a country and the Society of that country. It is the economic situation of that country that is essential for the welfare of a society to survive, and the economic situation of the country affects the life of the society in a good or bad way. In all countries of the world, the economy is evaluated between certain periods in a positive or negative way with a number of indicators. An increase in the amount of factors of production in a given period in an economy and technological increasing the real potential level of national income due to progress is called ' economic growth’. Economic growth can be interpreted as a result of the collection of many economic explanatory parameters.
Graph 1.1 Growth in Turkey and The World
Source: Türkiye İstatistik Kurumu, www.tüik.gov.tr
Economic growth is the rise in the capacity of goods and services produced in a country. The variable used to measure this is Gross Domestic Product.
0 2 4 6 8 10 12 14 16 18 2011 2012 2013 2014 2015 2016 2017 2018
Growth in Turkey and The World
2
In other words, economic growth is the increase in gross domestic product in the country. Economic growth depends on the increase in the quantity of goods and services produced in an economy over time and on the increase in the creation of money. Growth is traditionally measured by percentages of real (gross domestic product) or real GDP growth rate. In addition, economic growth has been a very important research topic for Economists for many years and what economic growth is due has been questioned. Many theories and models have been developed in this context. GDP is usually calculated in real terms, e.g. the term inflation-adjusted is used for the net sales effects of inflation on the price of goods and services production. In many academic studies, the importance of economy and economic growth for a country has been mentioned. It has been seen again and easily that many factors affecting economic growth abound if going from general to private. In an economy, there are many factors that affect growth, each of which can be studied and interpreted in separate categories. These include transportation, construction industry, etc. included. it can be supported by examples like this. However, as mentioned in different researches and different studies, it can be said that human capital creates the dynamics of economic growth and significantly affects growth. Economies that are more educated or have more human capital power have often seen the ethos of this. It is also known that economic growth cannot be measured only by income, and that the dynamics of human capital investment should also be studied.
1.2. Definition of Human Capital
Being a big economy is a multi-faceted issue. For a huge and strong economy, effective use of human and physical capital is required. It is used as the concept of ‘human capital’ to express all of the concepts such as the individual's knowledge, skill, health status, abilities, level of education, or place in society. Human capital is described as the education expenditure of the person in order to gain knowledge, ability and skills (Seyidoğlu, 2002: 59). It is also the type of capital that the
3
individual can acquire and accumulate as a result of his / her participation in talent, experience and cultural actions over time (Özcan, 2011: 107).
And this type of capital has the characteristic of being another important resource besides the essential physical capital for economic development (Seyidoğlu, 2002: 59).
Considered as the most important growth tool of recent years, qualified manpower considers. As it is known, qualified manpower people and information through education, it is a result of the creation of the duo. According to many other activities, the most basic characteristic of education is that it is associated with investing in the future of individuals, firms and societies. Therefore, human capital has critical share in the transformation of economic and social life, in other words, in improving the level of well-being and quality of life. Education, competitiveness, productivity growth, participation is central to policy areas such as fair income distribution and social cohesion. For an economy and a society, one of the most crucial elements of human capital is education.
1.2.1. Human Capital Components
There are a number of components for understanding human capital, these components can be allocated in different ways depend on the type and characteristics of human capital.
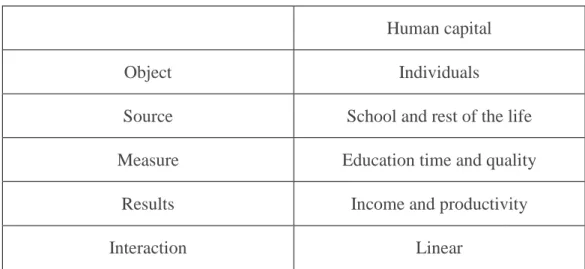
Table 1.1 Human Capital Components
Human capital
Object Individuals
Source School and rest of the life
Measure Education time and quality
Results Income and productivity
4 1.3. Importance of Education
1.3.1. What is Education?
The most important element of human capital in a society is education. The notion of education is described as the procedure of creating switches of behaviour, thought pattern and talents of the individuals. Therefore, there are many applications examining the aspect of education on economic or GDP growth. 1.3.2. The Aim of Education
The main goal of education in all communities, transfer a cultural background to the next generations, young people's behaviour shaping them in the direction of adult people's lifestyles in the future to be able to be directed towards their social role and to be able to bring educated people into society and make them useful in line with this goal. As mentioned in many previous studies, educated and qualified people serve the country's economy and contribute to its development, so Education, which is a very important element of human capital, is in a very important position in terms of the growth and efficiency of an economy. The profile of educated people can be effective in many areas that make up the economy, thus contributing to economic growth. To give an example, many jobs, projects and investments that make up the economy of a country have the labour of educated people. In other words, Education and educated people can be cited as one of the ways in which a country expresses itself in the global market. Some of the other important aims of education are;
- to create a society that provides consensus, - disciplined,
- hardworking,
- knows what it wants and meets the requirements of the job accordingly - and has high cultural values.
5 1.4. Education System
As mentioned before, education means many things to a society. In order to have a good education level, it is essential to go through a good education process. The process of completing academic studies at the university or above can be called the education system. In the education system, it is classified as pre-school, elementary school, middle school, high school and University. Individuals go through these stages, respectively, by subjecting them to the conditions of that region. Since education is of great importance to almost all countries of the world, many nations allocate a budget from their own economies to improve their education and system. The money and expenditures allocated from these budgets are seen as an investment and there is an expectation of a return. Therefore, countries in many different continents of the world have developed different educational systems to perform within themselves.
1.4.1. Education System in Turkey
Increasing student achievement levels and seeing the impact of implemented policies on students has always been important for communities with a vision. Turkey has been a developing country for many years and wants to enter the European Union, so it has invested in the education sector and the education system, and from time to time has changed the order and duration of education in the education system. The education system in Turkey starts mainly from pre-school. Afterwards, the primary school education, which is 5 years overall, is completed and students 6th -7th and 8th classes they complete their secondary school education, which is continued as a class, and at the end of this education, students are subjected to the high school entrance examination in order to gain entry to high school schools that are qualified or less qualified, But over the years these exams have changed a lot. After secondary school education, high school education is completed, and students have the right to take the university exam. However, just as with the entrance to high school, this exam system has been changed many times
6
over time. According to the PISA indicators showing the missing or successful aspects of the education system in the countries as a result
of some surveys and tests, some deficiencies in the sense of education in Turkey have been discussed over the years.
1.4.1.1. What is PISA?
Pisa (Program for International Student Assessment) may be a program designed to work out the extent to which 15 - year-old students in OECD countries are prepared for the situations they will face in today's information society at the tip of compulsory education. the standard to be measured by PISA isn't the degree to which students learn the topics covered within the curriculum in school, but whether or not they have the power to use the knowledge and skills they need in real world situations, to analyse, to reason and to speak effectively using the science and arithmetic concepts learned in school.
1.4.2. Changes in Turkish Education System
As a result of PISA scores and some indicators in Turkey, some changes have been implemented in the education system over time. Primary education 1-5 by the Board of Education for the elimination of those deficiencies. Classroom instruction programs were refurbished and implemented within the 2005-2006 year is interleaved. This education program is intended to make the courses more attractive and fun for the students, and this program has also been made suitable for 8 years of primary and secondary education. In addition, a number of decisions have been taken regarding the restructuring of the secondary education structure. For example, starting from the 2005-06 academic year, the 3-year high school education was restructured and increased to 4 years and the curriculum was reorganized according to these 4 years. Other decisions that ought to be mentioned are the adoption of the eu Union Foreign Language Level System from primary education to the tip of education and therefore the determination of the quantity in fact hours in keeping with this, the gradual merging of Anatolian high schools and foreign language-oriented high schools under the name of Anatolian high school in an exceedingly
7
single program. In addition, some technological innovations have been introduced to the education system in Turkey over the years, and these innovations are possible within the scope of the expenditures made to education.
1.5. Educational Spending in Turkey
When investigated, Turkey has been a country investing in education for years. These expenditures are distributed very differently in the education sector. Investments in these students, new universities and schools, renovation of existing schools, primary, secondary and tertiary schools in the classrooms improvements, and equipment, more teachers by providing scholarships or academic employment, such as different examples can be given to students, In addition, factors such as the opening of different types of schools in different areas and the spread of schools such as Technical High School that will enable the individual to specialize in one area can be listed under the name of expenditures on education. Especially from the beginning of 2010, the total expenditure on education in Turkey is not underestimated, and in dollar terms, the average annual amount of 50 billion dollars is spent on education. These education expenditures constitute an important part of Turkey's GDP, and Turkey is in the 33rd place with 3327 USD educational spending per student on the world list.
1.6. Education in Other Countries
Outside of Turkey, the impact of education and education on society and growth is of great importance for many other countries in the World, and many countries on different continents have designed and invested in education systems based on their socio-cultural characteristics, lifestyles, ethical understandings and some of their approaches. It is possible to classify the countries of the world under many different criteria such as levels of development or levels of income. Of course, the denominator that each country or society allocates from their budgets to education within their own vision and development plans varies, and this variability can affect the overall economic situation of the countries and the plans on the agenda of the countries.
8
For example, while a more standard and more scientific and technical education model is being adopted in Turkey, a different education system is being constructed in Finland and it is planned that students will become better equipped individuals who are better prepared for social life and after school. In other words, education in other countries can be approached with different perspectives, examples such as low school and classroom costs, giving students more responsibility can be replicated.
1.6.1. Education in OECD Countries
OECD : The Organisation for Economic Co-operation and development was established in its place after the Second warfare, following the completion of the function of the Organisation for Economic Co-operation in Europe (OEEC), which operated between 1947-1960 to help within the distribution of the US and Canada's assistance of around $ 12 billion under the foreign aid, so as to push and repair Western European economies. OECD members : ( U.S, Germany, Australia, Austria, Belgium, Czech Republic, Denmark, Estonia, Finland, France, The Netherlands, Great Britain, Ireland, Spain, Israel, Sweden, Switzerland, Italy, Iceland, Japan, Canada, Korea, Latvia, Lithuania, Luxembourg, Hungary, Mexico, Norway, Poland, Portugal, Slovakia, Slovenia, Chile, Turkey, New Zealand, Greece). Raising the amount of kit for growth and welfare in OECD countries can enhance winnings through better employment chances and better education levels. According to the report published by the OECD in 2016, the average amount spent per student among OECD countries is $ 10,493. This expenditure represents the quantity spent per pupil individually in the least levels of education, from elementary school to varsity. once we examine this amount per the amount of education, the typical is $ 8,477 at the elementary level, $ 9,980 at the centre school level, $ 9,990 at the high school level, and $ 15,772 at the faculty level. Overall, spending at the varsity level has increased all told the countries examined within the report. Another important indicator is that the ratio of paying on education to gross domestic product per capita (GDP Thu capita). In other words, the actual fact that primary and teaching is generally compulsory indicates that the number spent
9
per pupil during this area is additionally the number spent on school-age individuals. Therefore, the indicator is interpreted as what proportion of the domestic product per capita is spent on education. Education expenditures in Turkey appear to be well below those of other OECD countries, which can be considered valid in other non-OECD continental countries. Source: OECD.org 1.6.2. Education in Other World Countries
When looking at other world countries consisting of different regions, it is possible to see different education systems and the variability of spending on education. For instance, according to the World Bank's annual report, by 2012, Hongkong spent about $ 8.5 billion on education, while Argentina spent $ 28 billion. The underlying reason for this volatile situation is the economic situation of countries, as mentioned earlier, populations etc. it consists of such criteria.
1.7. Education & GDP Growth Relationship
The main goal of the economic activities that individuals put forth in social life is meet to their basic requirements. While fulfil the fundamental needs, it is essential to fight with the constraints experienced. Staring at the economy as an entire, it's geared toward spawning and maintaining the welfare levels of the community are a principal policy. Education and spending in this respect are important for countries economic development plans, because qualified people are the elementary units of a more fertile and beneficial society. Economic growth can be portrayed as number, volume and quantity varies in such a way that the principal sizes of the public economy are permanent per capita income growth.
The materialization of economic growth is usually related to use of human and physical capital efficiently. Currently while the strength of arm power is drastically fallen in production and year by year the power of brain and machines will ascend. This radical change in industry, while descending of physical role of human in industrial process gives more chance to progress theirselves on their interests area. This can only possible with making the essential investments for education sector.
10
As in other areas, decision makers aim to see the short, medium or long-term effects of spending on education and to look at the whole picture and plan for GDP growth. In this study, the impact of education spending on economic growth for the period from 2011 to 2018 will be examined on the basis of two different groups of countries using by Panel Data Analysis. It consists of 5 countries in both groups. While one group consists of OECD countries (Turkey Switzerland, Finland, France and Denmark), the other group consists of different world countries, (Turkey, Switzerland, Hongkong, South Africa and Argentina). Other explanatory variables are annual inflation and average currency rate (in USD) of these countries. In the study the effect of educational spending on GDP growth will be tested by Pedroni cointegration test, Panel causality test and Panel least square methods. In the following part of this study, similar works in this field will be mentioned in the literature. In the third section data and methodology to be used will be elucidated. Finally, a conclusion will be discussed as a result of the econometric analysis.
11 CHAPTER 2
LITERATURE REVIEW
The are several studies and analysis about educational spending on GDP growth or economic growth in the literature. Some of these studies analysed by Turkish authors and some of these analysed by other foreign authors. Most of these studies were conducted with the panel cointegration analysis to interrogate the effect of educational spending on GDP or economic growth. The other causality test has been used in these studies as well.
Doğrul (2009) shows that the effects of education expenditures on economic growth by using panel data analysis based on Turkey’s regions for the period from 1990-2011. In this study, the author examined the impact of education spending on economic growth in the developed and undeveloped regions of Turkey, the Marmara and South-eastern Anatolia regions. For seeing the impact of several levels of education in the study, total expenditures are divided into 3 different parts: primary education, secondary education and higher education and analysis is performed with panel data analysis. In the results of this analysis, the total, primary and secondary education expenditure coefficients in Turkey and in all other regions are found to be positive and statistically significant, as indicated in previous economic studies. Secondary education expenditures in south-eastern Anatolia region and primary education expenditures in Marmara region have a higher impact on economic growth.
Kızılkaya and Koçak (2014) in the journal of economic sciences, go for the relationship between economic growth and public educational spending based selected OECD countries. For this purpose, the correlation between public education spending and economic growth is tried accepting the panel data analysis method based on 11 OECD countries. In the study the main dependent variable is GDP per capita and public education spending and fixed capital investment is
12
used as control variables. The tests and all econometric analyses show that there is a positive and significant interaction between educational spending and growth. Selim, Purtas and Uysal (2014) in the work for “optimum economics and Management Sciences” analysed the effect of education spending in G-20 countries on economic growth. In the study, the impact of education spending on economic growth based on G-20 countries, is examined in a short-and long-term way during the period from 2000 to 2011. In the analysis, the impact of education spending in g-20 countries on growth discussed using panel cointegration and error correction methods. The presence of a long-term relationship with Pedroni panel cointegration analysis and therefore the entity of short-run relation with the pooled group mean regression are proved. Consistent with sequels, the short and long-run relationships between education spending and economic growth are positive and significant as well.
Ersoy and Yılmazer (2007) examined that the role of public spending on education in the growth model with panel data analysis. In their study, Ersoy and Yılmazer included research and findings on human capital, internal growth theory and education expenditures. In addition that, using the Social Investment Index calculated by the authors, the panel cointegration test is applied. The analysis focused on the period between 1985-2001 and covered 23 countries. The effect of educational expenditures on economic growth on these 23 countries has been examined and empirical result shows that, there is a negative relationship between educational spending and economic growth.
Parlakyıldız (2015) investigates the connection between economic growth and human capital for the chosen 25 OECD countries using panel data analysis during the period for1998-2013. Relationship between human capital and economic growth, Mankiw et al. (1992)’ s concept of human capital by adding the Neo-classical model of growth has been studied within the framework of. Under the light of these econometrical results, it can be said human capital effects education spending in 25 OECD countries, positively. Parlakyıldız, stated that the result
13
supports the importance given to human capital in developed countries such as OECD countries.
Bozkurt and Balmumcu (2018) analysed the relationship between human capital and economic growth as the other studies in literature. The main purpose of the study is to test empirically the relationship between human capital and economic growth, which many economists have been researching and analysing since the 1980s. In the study, the literature on the subject was examined and detailed and the relationship between economic growth and human capital was empirically tested using the panel co-integration analysis method. All data used in the study was obtained from Penn World Tables (PWT9). The countries analysed in the study were selected by the World Bank as of June 2017, taking into account the countries identified in the upper middle-income group. Healthy data has been obtained for 30 of these countries, including Turkey, and a panel data set covering the period 1970-2014 has been created. In the method part of the study, it was first analysed whether there was a horizontal cross-section dependence between the series. After that, the Human Capital Index representing human capital and the real GDP representing economic growth are taken into account. the co-integration relationship between the two variables has been tested. According to the results of the tests, it is resoluted that there is a co-integration relationship between the Human Capital Index and the real GDP series. Both variables move together in the long term. A long-run positive relationship exists between these two variables. This result is compliant with the outcomes obtained by the majority of other studies in the literature. Finally, Bozkurt and Balmumcu finished their work with the following words. A process of economic growth that will achieve high income and high level of human development depends significantly on the accumulation and quality of human capital.
Akçacı (2013) studies the impact of “education expenditure on economic growth” for Kafkas University Economical science journal, page range 65-79. In this study Akçacı try to sense the connection between education spending and GDP growth for the period 1998-2012. The study was conducted on a quarterly basis
14
rather than on an annual basis. So, the analysis was performed for the period 1998 Q1 – 2012 Q3 through Toda - Yamamoto causality test. According to findings and results, there is no directional causality from education expenditure to economic growth.
Karaçor, Güvenek, Ekinci and Konya (2018) focuses on relationship between education expenditure and economic growth in 19 different OECD countries in their study. Analysis were conducted with panel data analysis with using estesian data set for the period between 1998-2012. Cross-sectional data and time series are combined in the analysis. In Panel data econometrics, the following step after transforming cross-sectional statistics and time series information into the panel system determines whether it's miles a cross-sectional, and duration effects may be explained by using fixed effect model or random effect version. Data from 19 different OECD countries are obtained annually from the OECD database. Looking at the final results of the study, it is observed that education expenditures in 19 different countries are not have any effect on GDP.
Umutlu Yılmaz and Günel (2011) investigate, economic growth differences from the convergence hypothesis perspective with implication for OECD countries. Human capital has been expanded as health and education. The purpose of study peruses the impact of human capital index and effectiveness institutions on GDP growth. For this purpose, the annual data of 29 OECD countries for the period 2000-2007 are analysed from econometric perspective using Mankiw–Romer-Weil (MRW) model with panel data regression analysis. The independent variables identified in the study are the education index, Health Index and institutional development indices. In this context, annual real GDP per capita data of 29 OECD countries for the period 2000-2007 were obtained from the OECD database. GDP per capita is the reason for taking the variable in particular to reach the findings related to the convergence hypothesis. The fact that the coefficient of this value is negative in the studies conducted in the literature leads to the conclusion that the convergence hypothesis is supported. In this study, “CGDPC” is assigned as the dependent variable in this model and is computed as the distinction of the real GDP
15
per capita value in logarithmic form from the real GDP per capita value in logarithmic form observed in the previous period. Research finds that countries with better institutional characteristics are better off with positive coefficients and meaningful t values they have development rates have been identified. In terms of human capital, a positive change in income the expectation that it would create could not be determined within the scope of the model. In fact, although the education human capital criterion is positive, the coefficient of Health Human Capital criterion is negative and does not yield statistically significant results in both variables. The convergence hypothesis from the study objectives is that real GDP per capita determination by assigning its value as an argument in logarithmic form is been. Accordingly, to the coefficient convergence hypothesis of the independent variable it is appropriately negative and statistically significant. So, in the beginning, countries with low income levels countries will be able to catch high income level countries. But still a short observation interval of 7 years very healthy results in terms of testing the convergence hypothesis the possibility of not giving birth should be considered.
Yardımcıoğlu, Gürdal and Altundemir (2014) focuses on the relationship between education and GDP growth within 25 countries of OECD cover the years between 1980 and 2008. A panel cointegration approach was used in this study. For the main goal of this analysis to see the longstanding relation between education and economic growth. In the article, methods those Pedroni and Kao cointegration, Pedroni DOLS and FMOLS tests are used. The elasticity multiples of education and economic growth are founded as 0.283% and 2.931%, with respect to DOLS. In line with FMOLS results, the elasticity coefficients of them are 0.25 percent and 2.82 percent, conjointly. The results of the Lamda-Pearson stats show long-term mutual causality between education and economic growth, while the group stats show long-term one-way causality from economic growth to education. It achieved that there is a powerful cointegration between education and economic growth. Pamuk and Bektaş (2014) examined the relationship between education expenditure and economic growth in Turkey using ARDL bounds testing approach, during the
16
period of 1998Q1-2013 Q3. Although many studies in the literature have been analysed using the panel cointegration method, Pamuk and Bektaş used the ARDL boundary testing approach model. The most important advantage of the ARDL boundary test approach is regardless of whether the variables included in the analysis are I(0) or I(1) applicability. The other crucial advantage of the ARDL boundary test approach is that it has better statistical properties than the Engle-Granger method, since it uses an unrestricted error correction model. The ARDL boundary test approach consists mainly of three parts. In the first and the most important part, the long period between the variables included in the analysis whether it has a relationship is being tested. In the case of a cointegration relationship between these variables, long and short-term elasticity are obtained in the following parts respectively. The data set used in this study is quarterly and covers the period 1998:01-2013:02. Data on real Gross Domestic Product (GDP) and real education expenditures (EG) were obtained from the Central Bank of the Republic of Turkey (CBRT) Electronic Data Distribution System (EVDS). According ARDL test results, it was concluded that there is no cointegration between these two variables those education expenditure and economic growth. Kaya and Yalçınkaya (2016) analyse the effects of education on economic growth applied on low, medium and high-income countries. Time period covers the years between 1991-2011. Kaya and Yalçınkaya used a new generation panel data analysis in this analysis. The data was taken from the World Bank. In detail, the World Bank divided 215 different countries around the world into 4 parts, addressing the level of per capita income. The World Bank has fracted countries into low-income, low-middle-income, high-middle-income, and high-income. In the study, variables were defined as RGDP (real GDP per capita), El (employed labour force), EI (education index per capita) and GFCF (real fixed capital investment). These data were obtained from Penn World Table and World Bank Database.
The goal of the study was to check the long-run impacts of education on economic growth in the low-income countries, eastern, high-middle income countries and
17
high-income countries groups in four main stages within the framework of the panel data analysis methodology. In the first phase, the dependence between the horizontal sections (countries) that form the panel (YKB) in the variables used in the model and in the cointegration equation was examined by LM (LaGrange Multiplier) tests. After the existence of YKB in the variables used in the defined model and the co-integration equation is determined, the second stage of the series is stasis, considering the horizontal cross-section dependence Holan Pesaran (2007) has been investigated with CADF second generation Panel unit root tests. After determining that all variables used in the model are stationary of the same order [i(1)], the long-term relationships between variables in the third stage were examined with Westerlund Panel co-integration tests. In the fourth and final stage, the coefficients of the long-term co-integration relationship determined by panel co-integration tests Mark et al., (2005) surveyed by dsur estimator. Findings of the study show that, in the period between 1991-2011, education played an important role on economic growth and quality of their welfare in the long-term, especially in the low, middle and high income countries.
Köprücü and Sarıtaş (2017) focused on the causality test of educational spending and economic growth in Turkey fort the period from 1980 to 2013. In the study, the main purpose is testing long-haul relationship between education spending and economic growth. For this paper, ARDL (Autoregressive Distributed Lag) and Johansen approaches are used. Variables included in the study as; GDP per capita, total education spending, capital ratio, employment rate and level of education. According to the long-term model of the ARDL method, capital, educational spending and education level variables are statistically significant and have a positive effect on economic growth as well.
In the short-term model, the capital variable is statistically significant and has a positive effect on growth. The Toda-Yamamoto approach was applied in order to analyse Granger causality after the convergence approach, which expresses the existence of a long-term relationship. As a result of econometric tests. It concluded
18
that the level of education spending is the Granger cause of economic growth, but economic growth is not the Granger cause of education spending.
Eriçok and Yılancı (2013) investigates the relationship between education expenditures and economic growth using Bounds Test Approach. Education is one of the most important spending areas in the context of public services, which is primarily socially relevant to all segments of society. Education, especially in developing countries, has lagged behind for years, both in terms of quantity in budget and perspective. Eriçok and Yılancı analyses of their study based on this fundamental. In this paper, it is focused to analyse the relationship between economic growth and education expenditures for Turkey. In this study, LG is obtained from the logarithmic form of the series GDP, the Turkish Statistical Institute, LEH Yilmaz (2006) education expenditures of consolidated budget expenditures allocated to the portion of the education obtained from a series of shows showing. Education expenditures were realised with the basic annual GNP deflator of 1987 and used in logarithmic form in the study. The GDP series was also achieved on a 1987 basis annualized basis. The data set to be used in the study covers the years 1968-2005. According to the results of the tests, the boundary test approach to cointegration is used and it is concluded that education spending has only positive impact on economic growth in the short term.
Uçan and Yeşilyurt (2016) focused on the analysis of education expenditure and economic growth nexus in Turkey. Granger causality test and error correction models selected in the study. The period of 2006 Q1 and 2015 Q4 are covered as time intervals in the analysis. The variables are determined as EHT (Education Expenditures in Turkey) and GDP (Gross Domestic Product). According to results, the study found that developments in education in Turkey had a positive impact on economic growth, and tests showed that in addition to the results confirming the relationship between growth and education spending in the long term, there is a double causality between education spending and growth.
Afşar (2009) demonstrates that the contact of education investments and economic growth in Turkey, published in “Anadolu University journal of social sciences”.
19
Education investments (EY) and Gross National Product (GNP) were used as variables in this study, which investigated the influence of education investments on economic growth. The period studied covers the years 1963-2005 and the data is compiled annually. The Granger causality test is applied as a method in the research. The main target of the study is to state whether there is a long-run equilibrium relationship between education investments and economic growth. Consequently, there is no mutual(bi-lateral) causality relationship between growth and education investments in Turkey's economy during the period studied. There is a one-way causality relationship, and the direction of causality is also towards economic growth from educational investments. There is no causal relationship between economic growth and investment in education. In other words, education investments in the Turkish economy are among the factors affecting economic growth, but the realization of economic growth at a high or low rate does not have any effect on education investments.
Çalışkan, Karabacak and Meçik (2017) demonstrates the relationship between educational expenditures and economic growth in Turkish economy: Bootstrap Toda- Yamamoto causality test approach. In analysis, 1998 Q1 and 2014 Q4. the series of gross domestic product (GDP) and education expenditures for the quarter are covered. The GDP series used in the analysis is the 1998 base year GDP series derived from CBRT Evds. The education expenditures series is compiled as annual data through the education expenditures Bulletin of the Turkish Statistical Institute for 2014, the Education Monitoring Report of the Education Reform Initiative for 2010, and Karaaslan (2005). Analysis findings shows that, there is a causality relationship between education expenditures and economic growth for the period covered in the Turkish economy.
Öztürk, Kalaycı and Korkmaz (2017) inspected the effect of educational spending on economic growth in Turkey, from 1980 to 2013 through econometrical analysis. In this context, the multiple regression model is used, and it is been demonstrated with econometric methods that education expenditures strengthened the economic structure of Turkey between 1980 and 2013. In addition, ADF (Augmented
Dickey-20
Fuller) unit root testing is applied to our variables for education expenditure, inflation, unemployment and GNP. A long-term relationship is identified with co-integration results for 4 variables between 1980 and 2013. In particular, the long-term relationship between economic growth and education spending confirms the multiple regression model made. According to the analysis, Turkey's education expenditures between 1980 and 2013 influences and triggers much more economic growth than both inflation and unemployment.
İğdeli (2019) elaborates the impact of R&D and education expenditures on economic growth. The main purpose of the study is to peruse the impact of R&D and education expenditures on economic growth in Turkey during the period between 1990 and 2016. In this study, the incidence of education expenditures to GDP, representing education expenditures, and the ratio of the amount Maitra of higher education and education expenditures to GDP are used. The ratio of R&D expenditures to GDP is used to represent R&D expenditures. The findings of the analysis conducted with the ARDL boundary test revealed a long-term significant relationship between R&D spending, education spending and economic growth. Furthermore, the findings of the Granger causality test revealed a 5% one-way causality relationship between R&D expenditures to economic growth, economic growth to education expenditures and R&D expenditures to education expenditures Maitra and Mukhopadhyay (2012) focus on public spending on education, health care and economic growth in chosen Asia and The Pacific countries. The main purpose of this study examines that the role of public education spending and health care on GDP the study includes following 12 countries and covers the last 3 decades. (Bangladesh, Kiribati, Malaysia, Maldives, the Philippines and the Republic of Korea, Fiji, Nepal, Singapore, Sri Lanka, Tonga and Vanuatu). For the first 6 countries in the list, the Johansen cointegration test is applied, while for the other 6 countries, the causal effect of education expenditures and healthcare on GDP is discussed. Education spending increases GDP in Fiji, Kiribati, Maldives, Nepal, Singapore, Sri Lanka, Tonga and Vanuatu. Conversely, for Bangladesh, Nepal, Philippines, Singapore and Sri Lanka, health care spending is seen to support
21
GDP. Education spending in the Philippines has a negative impact on economic growth, while health care spending in Kiribati, Maldives and Vanuatu has a negative impact. In the case of the Republic of Korea and Malaysia, neither education spending nor health spending showed a notable effect on GDP.
Gangal, V. K. and Rao, K. Trivikram (2017) examined public expenditure for economic growth. The first goal of the study was to find the compound annual growth rate of expenditures, ranking them among all other expenditures of specific countries and rank countries by spending CAGR. The second objective is to determine the long-term relationship and impact of selected public spending on economic growth variables in selected developing countries. The Kao Cointegration test and the bias-corrected smallest square dummy variable model, developed by Bruno (2005), were applied respectively to know long-term relationships and their effect. From the results, it was found that all selected expenditures worked individually with selected economic growth variables (GDP per capita, HDI, real per capita). This study shows that spending on Health, General Government final consumption spending, Telecom and transport have a positive impact on economic growth, while spending on military and education is insignificant. Then, the last goal is the prediction of economic growth. The results found that predicted dependent variable values were very close to real values. The RMSE test is minimal in all three models, which is a sign of the good model. Demand-side interventions are suggested to be required, but the state's equity targets should not be ignored. The government's ongoing funding norms should be reviewed to ensure greater equity in public spending and funding. Accordingly, the fulfilment of the priority goals of poverty reduction and economic growth requires these countries to devote most of their valuable resources to such development efforts.
Mercan and Sezer (2013) demonstrate that the aspect of education expenditure on economic growth for Turkish economy. The study including 1970-2012 periods and data are annually. Variables are retrieved from The World Bank (World Bank,2013). In the study the bounds test approach developed by Peseran et al.
22
(2001) is operated to investigate the effect of education spending on economic growth specially for Turkey. The analysis has similar results to other studies in the literature. It is found that there is a positive and significant relationship between economic growth and education expenditures. In particular, spending on Higher Education appears to play an even more crucial role in Turkey’s economic growth performance.
Musila and Belassi (2004) analyse the impact of education expenditures on economic growth in Uganda: evidence form time series data. The most important question in this paper is, does education increase an economic growth? For years, numerical analyses have not been able to fully agree on this subject. Musila and Belassi use time-series technique to unravel the correlation between education expenditures and economic growth in Uganda for the years 1965-1999. Econometric tests reveal that education expenditure per employee in Uganda has a positive and significant effect on the country's economic growth, both in the long term and in the short term. The error correction model predicts, a 1% increase in education expenditures per worker, according to the error correction model, the 1% change in education expenditures per employee is seen as 0.04% in the short run. The cointegration analysis reveals that 1% jump in average education expenditure per employee will jump by 0.6% in the long run.
Sunde (2017) clarify that the education expenditure and economic growth in Mauritius with utilization of the bounds testing approach. Sunde’s study is conducted with the ARDL bounds testing method during the period between 1976 and 2016 for Mauritius.
In the analysis, GDP income per capita and education expenditures per capita are determined as variables. In addition, ADF (Augmented Dickey Fuller) test and PP (Phillips Peron) test applied. Apart from, the panel cointegration test and the Granger causality test are also applied. Here is the first result that can be drawn from the numerical studies, education spending has a causal relationship with economic growth in the short term. The second result is that there is a bilateral relationship between education spending and economic growth in the long term.
23 CHAPTER 3
METHODOLOGY
In many studies, individuals, firms, or countries are collectively examined by panel data analysis at a specific interval of time. In this part, the methods used in the study to understand of the relationship between education expenditure and growth will be explained. To scrutinize the relationship between these variables, panel unit root analysis, panel (Pedroni) cointegration test, Granger panel causality test, (FMOLS) called by fully modified least squares test and panel dynamic ordinary least square (DOLS) estimates are operated in this paper. For the first group of 5 countries (Turkey, Switzerland, Hongkong, Argentina, South Africa), it is used panel unit root test, panel cointegration test, panel causality test panel fully modified ordinary least square (FMOLS) and panel dynamic ordinary least square (DOLS), For the second group of 5 OECD countries (Turkey, Switzerland, France, Denmark, Finland), Panel Pedroni cointegration analysis, panel causality test, panel unit root test and Panel least square tests are used.
3.1. Aim and Significance of The Study
In this context, when inflation and exchange rates are taken under control, the effects of education expenditures of countries on their GDPs have been investigated in this study.
3.2. Limitations of The Research
This research is limited to the data between 2011-2018 of five OECD European countries including Turkey, France, Finland, Denmark and Switzerland and 5 other countries including Turkey, Switzerland, Hongkong, South Africa and Argentina. In addition, the study was limited to the variables of education expenditure, inflation rate, exchange rate (Dollar/National Currency) and GDP. Of these
24
variables; education expenditure was determined as the independent variable, inflation rate and exchange rate (Dollar/National Currency) were determined as the control variables and GDP was determined as the dependent variable.
3.3. Research Model and Hypotheses
The final version of the equation created within the scope of the research is shown in Equation. In the equation, GDP (GDP) is considered as a function of education expenditure (EDU), inflation rate (INF) and exchange rate (Dollar/National Currency) (EXC).
The final version of the equation created within the scope of the research is shown in Equation.
∆ln GDPt = β0 + β1∆ln EDUt + β2∆ INFt + β3∆ln EXCt + εt
3.4. Pedroni Cointegration Test
A relationship between educational spending and GDP growth is searched by operating cointegration framework presented by Pedroni (1999) in the other stage of analysis. It authorises the authorisation of heterogeneous panels, in which heterogeneous slope coefficients, constant aspects and individual distinctive deterministic trends are allowed. This structure contributes cointegration assess for both heterogeneous and homogenous panels with seven regressors depend on seven residual-based stats. Cointegration check Pedroni panel indicates zero hypothesis that there is no common integration of data models in panel. When Pedroni (1995) used two sets of variables for study of cointegration, multivariable regression sets were used in Pedroni (1999). Not only does it allow the dynamic and stable effects to vary between the parts of the panel, but it also allows the cointegrated vector to vary between parts. In all the tests provided by Pedroni are based on the residuals obtained from as below given equation (Pedroni, 1999). Cointegration tests is used to ensure that linear combinations of non-stationary variables are stationary in the long term, hence co-integration of variables, modelling and predicting the
long-25
term relationship between time series. The presence of cointegration between variables means a true long-term relationship.
3.5. Panel Unit Root Test
Many studies deal with Time Series require that the variables used be subjected to stasis tests. at the end of the third quarter of the 20th century, Granger and Newbold (1974), who suggested that most studies dealing with time series analyses gave incorrect results, modelled that such regressions contained aberrant coefficients and had non-finite variances. In this revolutionary work, spurious regressions such as named and that the results of the regression R2 values is deceptive in extremely high mostly low DW (Durbin-Watson) value to be obtained, R1>d to measure, a valid regression analysis to be diagnosed in order to rule hunch is characterized as a sham. The main argument cited as the reason for doubting the results of phony regressions is: “time series analyses examine data from processes that have a characteristic feature of their own within a given time interval. The characteristic mentioned here refers to the fact that the data was obtained as a result of a static probabilistic process. Because the time series obtained by random walk model (random walk) has a stochastic structure and its characteristic cannot be determined in this sense. Therefore, time series analyses on data obtained by this method may not contain a prediction. These results are mostly fictional”. For this reason, T and F tests on the results obtained in this way are also meaningful, but they do not provide accurate results. In the case of a random variable, the variance of a random variable depends on the distance between the two periods and not on the period in which this common variance is calculated. This type of stasis is also called a weak stable probabilistic process, and for many analyses such stasis is sufficient (Gujarati, 1999). In panel data unit root tests, the point to be considered first is whether there is a relationship between horizontal section units. When performing panel cointegration analysis, firstly, it is necessary to check whether the series are stationary and panel unit root tests are applied.
26 3.5.1. Phillips-Perron Unit Root Test
Philips and Perron (1988) have suggested that DF and GDF tests are inadequate when assumptions are not followed or when the series suffers a structural fracture. To get out of this situation, they considered making a nonparametric addition, which was intended to correct error terms. This correction mechanism is nothing other than that the DF and GDF models contain AR corrections, as well as the addition of Ma (moving averages) corrections. Therefore, PP testing is an Autoregressive Moving Average process.
The model accounts the constant term, the trend coefficient, the number of observations. While the error term average in all models is equal to zero, it may be consecutively dependent or may violate the co-variance conjecture (heteroskedasticity). Thus, the PP test is not dependent on the assumptions of the DF or GDF test. This is because the PP test eliminates consecutive dependence using a Newey-West error correction mechanism and fulfils the conjecture of co-variance. Therefore, the PP test continues to use all the critical values that the Dickey-Fuller test uses. The hypothesis test is done by testing the hypothesis H0
over its equality, as tested in the DF test, and the rejection of H0 shows us that the
series does not contain a unit root, i.e. it contains a stable probabilistic process characteristic.
3.6. Panel Causality Test
Causality analysis; For a functional structure given as y = f (y (t-i), x (t-i)), the past period values of an (X) variable are used to investigate whether (Y) has a statistical contribution in predicting the future values of the variable. If (X) delayed values of the variable, (Y) makes a statistically significant contribution in predicting the future values of the variable, variable (X) is the Granger cause of the variable (Y). The causality test is used to test whether there is a cause-effect relationship between the two variables and the direction of the relationship, if any. Granger causality test is one of the most preferred methods due to its easy application. Relationships
27
between variables were examined within the framework of Granger Causality and VAR Granger Causality / Block Exogeneity Wald causality tests.
As an inspirational paper, Granger (1969) improved a technique for construing the causal relationships between time series.
3.7. Panel FMOLS and DOLS Estimates
In addition to other approaches, DOLS and FMOLS tests are used in the study as well. Pedroni (2001) proposed a stronger test measured to single equation methods that precisely investigate the situation in the co-integration vector required for strong correlation. Moreover, these methods authorize us to construct the null hypothesis in a higher innate pattern, so that we check whether the strong relationship between education spending and GDP growth is consistent for whole countries of the panel.
3.8. Panel Least Squares Analysis
The least squares method is a form of mathematical regression analysis used to assign the line of best fit for a set of data, supplying a visual showing of the relationship between the data points. Each point of data offers the relationship between a known independent variable and an unknown dependent variable. The most common application of this method, which is sometimes touched to as linear or ordinary, aims to composed a straight line that minifies the sum of the squares of the errors that are effectuated by the results of the crony equations, such as the squared residuals resulting from differences in the observed value, and the value expected, based on that model.
28 CHAPTER 4
DATA & RESULTS OF OECD COUNTRIES
In this part of the study, dataset and the tests applied to analyse relationship between education spending and Economic Growth (GDP Growth) for OECD group of 5 countries (Turkey, Finland, Switzerland, France and Denmark) ,will be explained in detail and the results will be mentioned together with the analyses. In this chapter, analyses were applied separately, for the OECD country group and then for the other 5 countries groups will be mentioned in chapter 5. As indicated in the third (Methodology) chapter, different methods and different analyses were applied for the group of OECD countries.
In fact, the main reason why Turkey and Switzerland are in both groups is that there is more accessible data about these countries.
4.1. Data of OECD Countries
In this thesis, the effect of education spending on GDP growth in two different groups of 5 countries analysed. For this stage of thesis The study covers the years from 2011 to 2018 and datas are calculated anually. There are 5 countries for OECD group for the period from 2011 to 2018, in other word there are 40 observtions in this analysis. This quintet country group consists of Turkey, Switzerland, France, Denmark and Finland. The momentous point here is that, this group of five countries have common characteristics cause of being OECD members.
Basically, we have 4 different variables. Main dependent variable is GDP. Other variables are Inflation, Total educational spending and Average currency rate (usd = x). Variables are designated as ; GDP ( Gross Domestic Product), EDU(Educational Spending), INF (Inflation) and EXC ( Currency Rate ) for the first group of countries. (Turkey, Switzerland, France, Denmark, Finland).
29
In this data set, datas are taken on an annual basis between 2011 and 2018. For the countries involved in the study, examined the impact of total education spending on GDP growth, however for these countries, annual inflation and foreign exchange parity play an impressive role. Another interesting point is that the analysis on countries that can meet in common denominator and countries that do not have much connection will produce different or similar results.
In the scope of the research, five European countries' (Turkey, France, Finland, Denmark and Switzerland) annual data including 2011-2018 period is used. GDP and educational spending data were gotten from TÜİK official website http://www.tuik.gov.tr, OECD and World Bank’s official website https://www.worldbank.org), (http://www.oecd.org/) and also inflation and currency rate data are taken from (http://www.xrates.com/) . Data from 2011-2018 for the study can be stated above.
The units of the variables in the analysis are determined; -GDP and education expenditure as billion dollar,
-Inflation rate as percentage annually (%),
-Exchange rate as Dollar/National Currency (%) annually (For Turkey, USD/TL; for France and Finland USD/EUR; for Denmark USD/DKK; and for Switzerland, USD/CHF).
In the following section, more particular information about the data is provided with tables and graphs.
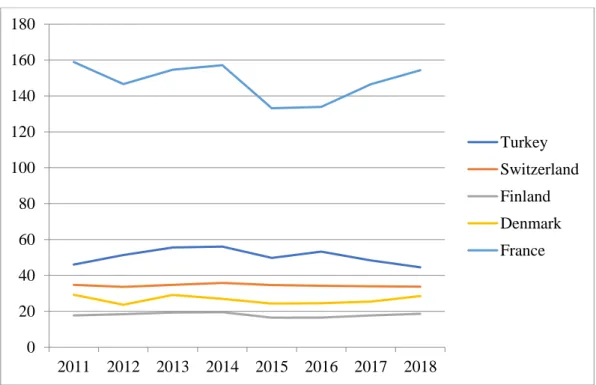
Table 4.1 Descriptive Statistics for the Education Expenditures of Five European OECD Countries
Country Minimum Observed Value Maximum Observed Value Mean Standard Deviation Turkey 44,53 56,05 50,6 4,23 Switzerland 33,62 35,82 34,45 0,71 Finland 16,46 19,49 18,03 1,16
30
Denmark 23,68 29,22 26,47 2,30
France 133,13 158,86 148,12 10,08
Looking at the table, it is observed that;
-The mean for the education expenditures of Turkey is 50,6 billion dollars; the minimum observed value is 44,53 billion dollars (2018), the maximum observed value is 56,05 billion dollars (2014),
-The mean for the education expenditures of Switzerland is 34,45 billion dollars; the minimum observed value is 33,62 billion dollars (2012), the maximum observed value is 35,82 billion dollars (2014),
-The mean for the education expenditures of Finland is 18,03 billion dollars; the minimum observed value is 16,46 billion dollars (2015), the maximum observed value is 19,49 billion dollars (2014),
-The mean for the education expenditures of Denmark is 26,47 billion dollars; the minimum observed value is 23,68 billion dollars (2012), the maximum observed value is 29,22 billion dollars (2011),
-The mean for the education expenditures of France is 148,12 billion dollars; the minimum observed value is 133,13 billion dollars (2015), the maximum observed value is 158,86 billion dollars (2011).
The graphs of the education expenditures of five OECD European countries for the period 2011-2018 are shown in Graph 4.1.
31
Graph 4.1 Mean of the Education Expenditures of Five OECD European Countries for 2011-2018 Period
The descriptive statistics for the inflation rates of countries are presented in Table 4.2.
Table 4.2 Descriptive Statistics for the Inflation Rates of Five OECD European Countries Country Minimum Observed Value Maximum Observed Value Mean Standard Deviation Turkey 6,16 20,30 10,22 4,44 Switzerland -1,14 ,94 -,09 0,67 Finland -,16 3,32 1,52 1,26 Denmark ,25 2,76 1,15 ,93 France ,10 2,30 1,23 ,88
Looking at the Table 4.2, it is observed that;
0 20 40 60 80 100 120 140 160 180 2011 2012 2013 2014 2015 2016 2017 2018 Turkey Switzerland Finland Denmark France