KADIR HAS UNIVERSITY
GRADUATE SCHOOL OF SCIENCE AND ENGINEERING
CONCEPT MAP BASED LEARNING SYSTEM
DUYGU ÇOLAK
Duygu Çol ak MS c The sis 20 14 S tudent’ s F ull Na me P h.D. (or M.S . or M.A .) The sis 20 11
CONCEPT MAP BASED LEARNING SYSTEM
DUYGU ÇOLAK
Submitted to the Graduate School of Science and Engineering in partial fulfillment of the requirements for the degree of
Master of Science in
Computer Engineering
KADIR HAS UNIVERSITY June, 2014
Ben, Duygu Çolak, bu Bilgisayar Mühendisliği Yüksek Lisans Tezinde sunulan çalışmanın şahsıma ait olduğunu ve başka çalışmalardan yaptığım alıntıların kaynaklarını kurallara uygun biçimde tez içerisinde belirttiğimi onaylıyorum.
i
CONCEPT MAP BASED LEARNING SYSTEM
ABSTRACT
Concept Map is a training technique, which accelerates, facilitates and consolidates the learning process. Concept map uses concepts and connections between concepts to train and transmit the information during education. A web application which is based on this technique has been developed. The application is designed for the teachers from different branches, students for various ages and everyone who wants to teach and learn any subject.
The application is web based and designed for different screen sizes, so users may access the application via their mobile devices for instance mobile phones or tablets and personal computers.
Tutor adds course content, determines the concepts and relations from the content, and connects them on drawing area in order to form a map. Student chooses one of the courses, reads the course content and tries to draw the concept map by deciding on concepts and relations. The application gives feedback to the student while drawing the map, which has been defined by the course teacher, thus facilitates the drawing and learning. Student may compare his concept map with the teachers’, thus continues the drawing operation until the learning process completes.
ii
CONCEPT MAP BASED LEARNING SYSTEM
ÖZET
Concept Map (Kavramsal Harita) eğitim tekniğinin, öğrenme sürecini hızlandırdığı, kolaylaştırdığı ve pekiştirdiği bilinmektedir. Eğitimin ve eğitimde aktarılan bilginin kavramlar ve aralarındaki bağlantılar üzerinden anlatıldığı bu tekniğe bağlı bir web uygulaması geliştirilmiştir. Uygulama farklı branş öğretmenleri ve çeşitli yaşlardaki öğrenciler, herhangi bir konuyu öğretmek ve öğrenmek isteyen herkes için tasarlanmıştır.
Uygulama web tabanlı olup, farklı ekran boyutlarına gore tasarlandığından, mobil cihazlardan, tablet bilgisayarlardan veya kişisel bilgisayarlardan kullanılmaya uygundur.
Öğretmen ders anlatımını ekleyip, anlatım üzerinden kavramları ve bağlantıları belirleyip, bunları çizim alanı üzerinde bir grafik oluşturacak şekilde birbirine bağlar. Öğrenci derslerden birini seçer, anlatımı okur ve belirlediği kavram ve bağlantıları birbirine bağlayacak şekilde grafik çizer. Çizim sırasında, öğretmenin belirlemiş olduğu uyarılardan yardım alır ve böylece çizim ve öğrenme kolaylaşır. Öğrenci kendi çizmiş olduğu grafikle, öğretmeninkini karşılaştırabilir, böylece doğru grafiği oluşturana kadar çizim işlemine devam ederek, öğrenme süreci tamamlanır.
iii
ACKNOWLEDGEMENTS
I would like to express my special appreciation and thanks to my advisor Asst. Prof. Dr. Selçuk Öğrenci, for his support and encouragement from the beginning of my research. Your support on both research as well as on my career have been priceless. Additionally, I want to thank the other professors in my program and my graduate assistant friends.
A special thanks to my family. Words cannot express how grateful I am to my lovely mother, father, and brother to being beside me and support me endlessly.
I would to like express my deeply appreciation to my beloved husband İsmail Çolak for all of the sacrifices that you’ve made on my behalf.
Finally I would like to dedicate my thesis to my father who is also my teacher and my colleague, without his guidance I could never finish this thesis.
AP PE ND IX C
iv TABLE OF CONTENTS ABSTRACT ... i ÖZET ... ii ACKNOWLEDGEMENTS ... iii TABLE OF CONTENTS ... iv LIST OF TABLES ... vi
LIST OF FIGURES ... vii
LIST OF ABBREVIATIONS ... viii
INTRODUCTION ... 1
CONCEPT MAP ... 2
2.1.Background on Concept Map ... 2
2.2 Rote vs. Meaningful Learning ... 3
2.3 Constructing Concept Map ... 5
2.4 The CMapTools ... 5
CONCEPT MAP APPLICATION ... 6
3.1 Overview ... 6
3.3 Product Functions ... 7
3.4 Operating Environment ... 8
3.5 Design and Implementation Constraints ... 8
3.6 Current system ... 8
3.7 Functional System Requirements ... 8
3.8 System Models ... 25
3.8.1 Scenarios ... 26
SYSTEM ANALYSIS AND DESIGN ... 28
4.1 System Flow Diagram ... 30
4.2 System Flow Diagram Description ... 31
4.3 Data Flow Diagram ... 32
4.4Data Analyze ... 34
4.5 Database Modeling ... 35
4.5.1 Database Tables ... 35
4.5.2 Relation Between Tables ... 37
4.5.3 Database Tables ... 39
USED TECHNOLOGIES IN THE SYSTEM ... 44
5.1 XML (EXTENSIBLE MARKUP LANGUAGE) ... 44
5.2 DOM (DOCUMENT OBJECT MODEL) ... 44
5.3 JAVASCRIPT ... 45
v
5.5 AJAX (ASYNCHRONOUS JAVASCRIPT AND XML) ... 46
5.6 HTML5 ... 47
5.7 TWITTER BOOTSTRAP ... 49
5.8 CSS (CASCADING STYLE SHEETS) ... 51
5.9 SVG (SCALABLE VECTOR GRAPHICS) ... 52
5.10 SNAP SVG ... 52
PROGRAMS AND PROCESSES ... 53
6.1 Libraries, Tools and Components ... 53
6.2 Concept Map Drawing Process ... 56
6.3 Algorithm of Drawing Concept Map ... 58
CONCLUSION ... 61
References ... 62
Appendix A : Symbols ... 65
System Flow Diagram Symbols ... 65
Data Flow Diagram Symbols ... 66
vi
LIST OF TABLES
Table 1: Database Tables and Relation Types ... 37
Table 2 : Database Tables, Column Names and Data Types ... 42
Table 3 : System Flow Diagram Symbols ... 65
Table 4 : Data Flow Diagram Symbols ... 66
vii
LIST OF FIGURES
Figure 1 : Add / Insert User Form ... 9
Figure 2 : Add / Update User Form ... 10
Figure 3 : Search Departments Form and Example of List of Departments ... 11
Figure 4 : Add / Edit Department Form ... 11
Figure 5 : New Password Form ... 13
Figure 6 : Change Password Form ... 14
Figure 7 : Login Form ... 15
Figure 8 : Search Courses Form ... 16
Figure 9 : Search Educator's Course Form ... 17
Figure 10 : Add / Edit Course Form... 18
Figure 11 : Add / Edit Lecture ... 19
Figure 12 : Search Courses Form and List of Courses Example ... 20
Figure 13 : Search Modules Form and List of Modules ... 21
Figure 14 : Drawing area and Concept Map Toolbar Error! Bookmark not defined. Figure 15 : Concept Map Page ... 24
viii
LIST OF ABBREVIATIONS
WWW World Wide Web
IHMC Institute for Human and Machine Cognition HTML Hypertext Markup Language
DOM Document Object Model XML Extensible Markup Language AJAX Asynchronous JavaScript and XML CSS Cascading Style Sheet
SVG Scalable Vector Graphics GUI Graphical User Interface CD Compact Disc
DFD Data Flow Diagram
WSDL Web Services Description Language WAP Wireless Application Protocol WML Wireless Markup Language RSS Rich Site Summary
RDF Resource Description Framework OWL Online Writing Lab
SMIL Synchronized Multimedia Integration Language GIF Graphics Interchange Format
JPEG Joint Photographic Experts Group PNG Portable Network Graphics IE Internet Explorer
W3C World Wide Web Consortium API Application Programming Interface URL Uniform Resource Locater
1
CONCEPT MAP BASED LEARNING SYSTEM Chapter 1
INTRODUCTION
Develop a mobile application to incorporate concept maps into learning. The mobile application will have different modules to be used by different user groups such as Concept Map creation, Concept Map deployment, Concept Map practicing.
Concept Map creation: by the teacher or expert, there will be a repository of Concept Map based lecture modules. Each Concept Map module will have a source text and its associated Concept Map which consist of concepts and relations.
Concept Map Practice Configuration: by the teacher, the teacher will configure how the Practice will be displayed to the students. Main parameters for configuration:
Enable/disable highlighting of concepts and relations in the text Enable/disable feedback
Enable/disable display of solution Enable/disable timing
Enable/disable grading
Enable/disable automatic grading of the Concept Map Enable/disable display of the grade to the student
Concept Map Practice/Test: used by the student, aim is to "draw" the Concept Map by reading the text. Based on the configuration, options can be enabled/disabled. The student will be guided by feedback if the practice is configured in this manner. Once the student finishes the exercise, the grade of this work can be calculated automatically or, the teacher is going to supply a grade for it.
2
CONCEPT MAP BASED LEARNING SYSTEM Chapter 2
CONCEPT MAP 2.1. Background on Concept Map
Concept map is a graphical tool to transfer knowledge, to help and ease the creation of new knowledge and way to evaluate the transferred knowledge. It is kind of a schema or plan, which depicts the knowledge as concepts and relationships between them. Concepts are shown with boxes or circles and texts inside these shapes are used for labeling them. Lines connecting two concepts, are called linking words or phrases, show the relationships between the concepts.
At least two concepts connected with a line, form a meaningful statement or a proposition which corresponds an event or an object in the universe.
Concept maps are constructed hierarchically which means most general concepts are at the top of the map and least general, more specific concepts are at the bottom. It is best to start from top and move through bottom. The way to find a starting point is to decide on a question so called “Focus Question” and construct the map while trying to give answer to this question.
Moreover there are lines connecting concepts from different domains in a concept map, is called cross-links. Cross-links strengthen the relation of different segments and ease the meaningful learning.
Examples of concepts may be used in concept map to clarify the given concept. Usually they are not encapsulated with boxes or ovals.
Concept maps were first developed in 1972 on a course, was based on David Ausubel’ s learning psychology which identifies learning as assimilation of existing, old concepts into new concepts by the learner.
3 2.2 Rote vs. Meaningful Learning
Surrounding events that are observed by individuals or transmitted using words or symbols between the age of 0 and 3, is called discovery learning process. Individual is in the center of the learning and make the definitions by himself/herself through the continuum.
Learning that is mostly obtained by questions and answers method and combining old information with the new ones, is called reception learning process. This term starts after the age of 3. Through this process information received from others. Three conditions should be provided for meaningful learning:
1. Education should be in the student’s native language or learner should connect his/her old information with the new ones and concepts should be in this clarity and meaning.
2. Learner should have adequate information associated with the new information.
3. Student should possess a willing to learn with this method.
This conditions are not available in rote learning. Both reception learning and discovery learning can cause meaningful learning or rote learning according to tendency of learner and order of the given materials. Unless individual does not have relevant level of knowledge and sense about the learned subject in a questioning and researching method, meaningful learning does not occur.
Concept map is an evaluation tool, which encourages the meaningful learning at the same time. [13]
4
Information comes to the working memory makes a connection with long-term memory in the learning process. Working memory has a limit for learning, thus it can operate small number of units.
Learning whether with rote learning or meaningful learning, it is constructed in long-term memory. But meaningful learning provides stability by strengthening ties between neurons because it establishes a link between old and new information. Learning by memorizing, this links remain incomplete. Because the absence of repetition, information are quickly forgotten in rote learning. In addition, because the absence of meaning, individual cannot develop himself and if there is a mistake while learning, it continues and he cannot use the information for long periods and for problem solving. On the other hand meaningful learning promotes creativity and ability of judge. [22]
There must be flow of information sequentially and continuously between long and short term of memory for processing large amounts of information. Concept map ensures the flow of information to be constructed this way, thus facilitates meaningful learning.
Obviously, our brains store people we meet, photographs and images easily and we called it iconic memory. Sounds are also recorded and remembered easily as images are and such memory called archic memory.
In an experiment conducted on 23 alumni and faculty students at Harvard University, students try to find an answer why do we have seasons? 21 of the 23 students did not manage to explain it correctly. This study demonstrates the importance of meaningful learning and concept map is a very helpful tool for achieve it. It is also clear that learners who get used to rote learning, have a hard time drawing concept maps.
Individuals who have intensive level of semantic knowledge and insist on producing new knowledge, sufficient for the creative process.
5 2.3 Constructing Concept Map
The best starting point for whom learning to construct a concept map is, to start with a context he has knowledge. It is suggested to use a focus question for this. People who tries to create a concept map, frequently encounters the same error, going beyond the scope of the context and deviate from focus question. Concept map was built but focus question did not answered at the end. After deciding on a focus question, almost 15 or 25 concepts are determined and a list, which is ordered from general to specific, is created from these concepts. Concepts can be written on Post-its or using software programs initial concept map is constructed. Post-Post-its and digital tools simplify group working and facilitate the drawing by moving around concepts easily. Final concept map is drawn out of preliminary concept map after two or three revisions. Concepts can be added or deleted during the reviews. Software programs ease the revisions because it is straightforward to add new concepts, move the concepts along in the map with linking statements and allow group working for individuals in the same room or anywhere in the world.
Cross-links which indicate the relations between different segments or domains, thus clarify the comprehension of sub-domains in a map should be added to the initial map.
2.4 The CMapTools
The CmapTools is a software program to construct concept maps. It was developed at the Institute for Human and Machine Cognition (IHMC). It has a word processor which is used for labeling concepts and links. It uses Internet to allow learners to interact while constructing concept maps and share their maps with others via World Wide Web (www). User can search Internet for more information regarding to the subject of their map. Resources such as photographs, graphics, images, web pages, videos or other concept maps can be linked to the map. These resources may located on the Internet or user local computer. The tool facilitates group working so enhances learning. All maps that is saved in CMap Server, can be accessed via browser. Two maps can be compared graphically. Every step while drawing the map is recorded and it can be played back.
6
CONCEPT MAP BASED LEARNING SYSTEM Chapter 3
CONCEPT MAP APPLICATION 3.1 Overview
An educational application was developed, which has only two users: tutors and students.
It is suitable for all types of courses if the contents of the subject can be demonstrated by concept map technique. Users may access the application via their mobile phones or tablets or personal computers. Tutor adds course materials, like course contents and draws related concept map. Student chooses the course, reads the course content and tries to draw the concept map by deciding on concepts. The application gives feedback to the student while drawing the map, to help the student to remember the concepts and connections between them. Finally the student can compare his own concept map with the tutors’.
3.2 Product Objective
This web application is for educational purpose and suitable for all type of computers which has internet connection and a modern browser. The goal is to help students to learn the courses easily and fast with the concept map methodology. And by using the mobile devices features like touch screen and mobility, it is more convenient to draw concept maps with drag and drop attributes and users can access the application anywhere if only they have an internet connection to download the course context.
7 3.3 Product Functions
1. Application supports multi languages, defaults are English and Turkish. More languages can be added later.
2. System has 3 different user roles which are admin, teacher and student role. 3. System administrator save the users to the system and assigns the appropriate role. Roles can be teacher or student.
4. Each student must have a certain department and a class. 5. Department data is entered by the admin.
6. System sends an e-mail to the new user, with user’s password.
7. Users get an e-mail to change the password they have, if they forgot their current password.
8. All users may change their passwords by using system’s password change functionality.
9. All users login to the system by using their e-mail address and given password. 10. Tutor may search for all courses, modules and lectures in the database.
11. Tutor may add new courses, modules and lectures.
12. Tutor enters the course data which consists of documentation or text information of the course and draws a concept map.
13. Student sees the list of courses that are assigned to his/her department and may choose one of them to study.
14. Student searches for available courses.
15. Student choose a lecture to study, reads the passage of the lecture, and by selecting concepts from the text draws a concept map.
16. Students may compare concept map with the compare option. System gives results of the comparison.
8 3.4 Operating Environment
Although the application is developed to be a web application especially for mobile devices, it is designed as if it can run on any hardware platform that have an internet connection and a browser. The browser should support HTML5.
3.5 Design and Implementation Constraints
Application should be delivered by the end of June 2014. 3.6 Current system
This system will be standalone and new. 3.7 Functional System Requirements
Application supports multi languages, defaults are English and Turkish. More languages can be added later.
System has 3 different user roles which are admin, teacher and student role: All users including admin should login to the system to gain access to the system functions.
Admin user has all the privileges to manage the system. He has access to all functions of the system. He introduces other users and assigns their roles or change/withdraw the given roles. He may also act as a teacher or as a student. Teacher creates courses, modules and lectures. He may enter or copy/paste the text data of the lecture. He may draw concept maps. Students search for courses, choose modules and lectures, study the passage (text) of the lecture and draw the concept map.
9
System administrator save the users to the system and assigns the appropriate role. Roles can be teacher or student:
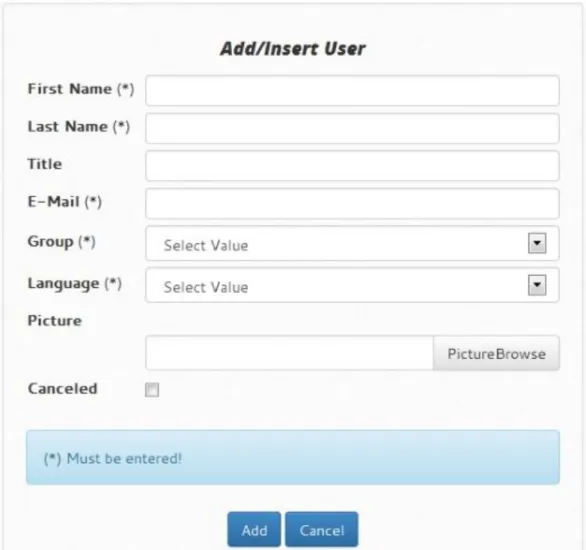
Admin user may define users to the system, after logins in. Users are created by filling the form of new user. User form has user title, first name, last name, e-mail address, role group, language and picture fields. As soon as a new user is saved to the system, an e-mail with an account information is send to the user’s e-mail address.
10
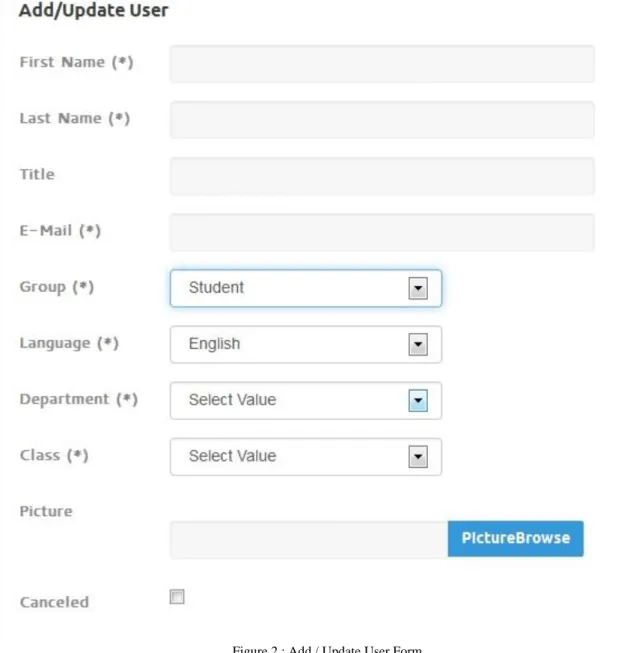
Each student must have a certain department and a class:
Admin user defines users to the system. Add/Update User Page is accessed via menu option called “Users”. All fields except Department and Class is same for all user roles in this form. If group option is selected as student, department and class fields becomes visible to the user. Department and class fields are mandatory for student user. Students gain access the courses automatically which are defined for student’s department.
11
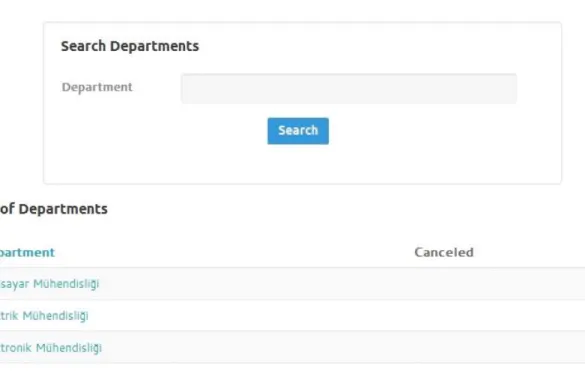
Department data is entered by the admin:
Department page lists the departments that is saved in the database. Admin user enters new departments. Course data is linked to departments, thus ease the way of retrieving and listing course information to the users.
Figure 3 : Search Departments Form and Example of List of Departments
12
System sends an e-mail to the new user, with user’s password:
According to the user, system sends an e-mail written in user’s language. This feature is performed by looking for a related e-mail template from mail templates table in the database, with matching language of users. Mail template table has subject and body columns for creating an e-mail. An example for e-mail template is, Subject: Your new password for {1}. Body: Dear {1} {2}, Your new password for CMAP is {3}. You may enter our site with your E-Mail and new password. At first entering to our site, we advice you to change your password. Best
Regards. {4}{5}.
Those numbers in body part of the e-mail written in curly braces are references which are fetched from users personal information like name, last name, password, name of admin user and last name of admin user respectively.
13
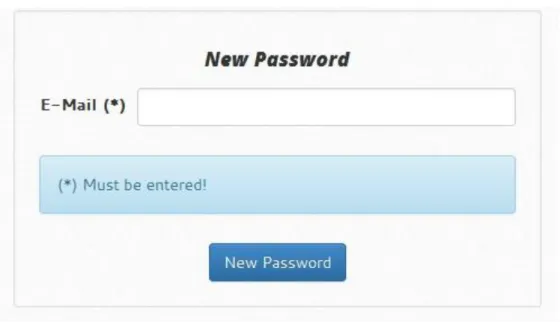
Users get an e-mail to change the password they have, if they forgot their current password:
If a user forgets password for login, he may use the “Password Remember” option in the menu. User receives an e-mail by entering the e-mail address. E-mail address should be same with the e-mail address in the system. If the user’s e-mail address were not found in the database, user receives an error. Otherwise, if there is a matching e-mail address, user gets an e-mail with a link inside. By clicking the link in the e-mail, user access a form called New Password. Form has a two fields to get a new password. User has to enter the new password twice. Example of password remember e-mail is, Dear {1} {2}, to get a new password please click the link below {3}. You may enter our site with your E-Mail and new password. At first entering to our site, we advice you to change your password. Best Regards. {4} {5}
14
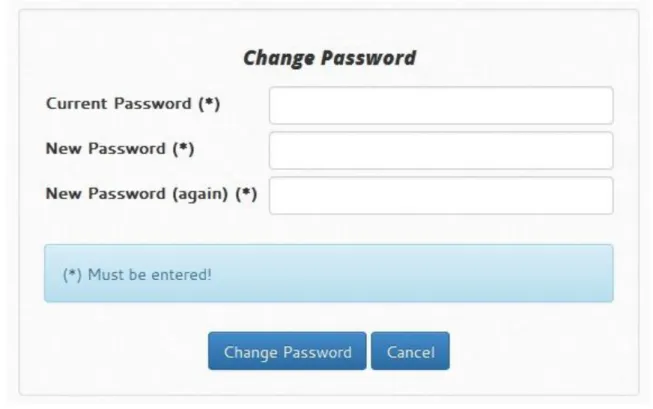
All users may change their passwords by using password change functionality:
Every user have a “Change Password” option on their menu after login to the application. Change password page has three fields. These are current password, new password and new password (again). Although user cannot access the page if he did not login, current password is asked for security. If current password is not equal to the user’s login password, operation is canceled. This way, if a user forget to logout from the system and another person access to the user’s page by using the same machine or device, he may have access to the pages but cannot change the password.
15
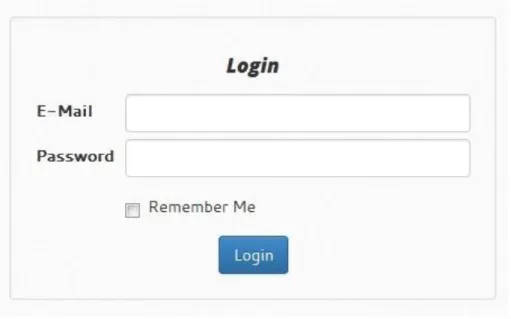
All users login to the system by using their e-mail address and given password:
System security is provided by a login mechanism. Login page has two fields, an e-mail and a password field. Application needs user’s e-mail address in order to send information about user password and other notifications about the application. It is more secure and useful to use e-mail address rather than usernames. Information which is entered to the e-mail and password fields are checked to meet the correct format and if the format is proper fields are controlled to match the correct data. “Remember Me” checkbox saves the login information to the browser’s cookie, further ease the login action performed without entering e-mail and password data again.
16
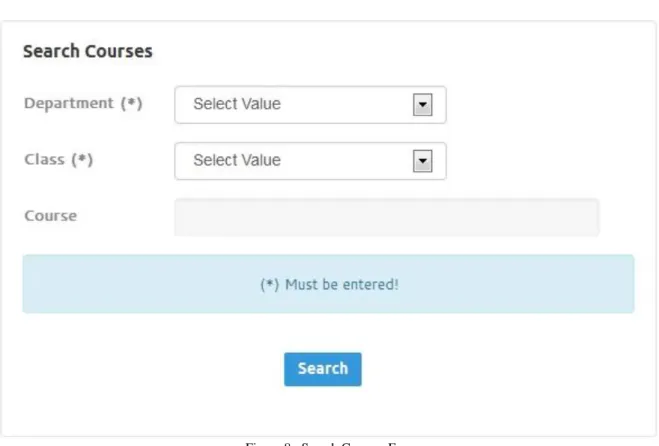
Tutor may search for all courses, modules and lectures in the database: Search form consists of three fields: department, class and course. First two fields are mandatory, last field is optional. Teacher may choose to select department and class and in addition type the course name to the course field to search the required data. Department and class fields are selected from list boxes. Course field is written into the text box.
17
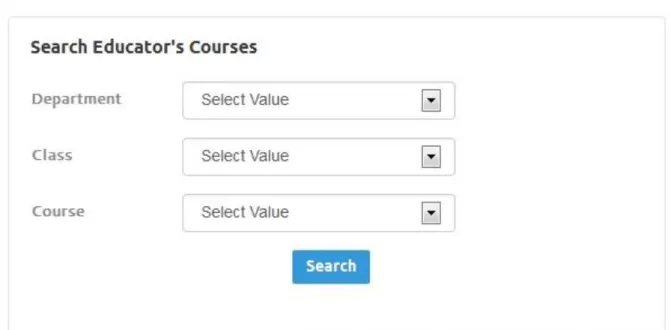
Tutor can access courses from two different menu options. These are “Courses” and “My Courses”. My courses menu option lists educator’s courses. All courses that are given by the educator is listed above the search form in the page. Educator may also choose to use search form to access the required data easily. All fields are
mandatory in the search form.
18
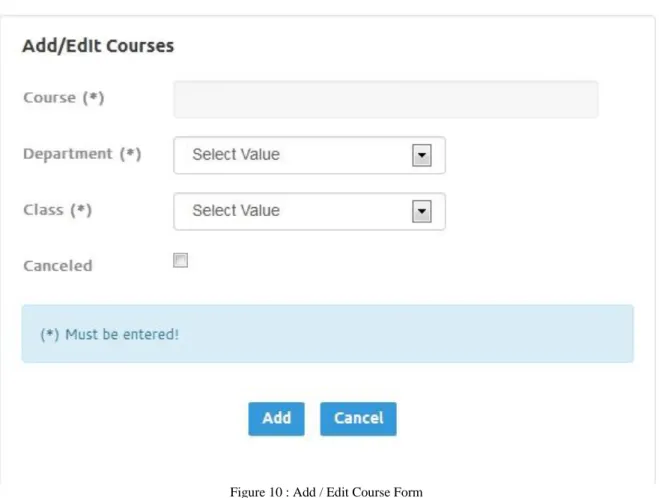
Tutor may add new courses, modules and lectures:
Tutor adds courses, modules and lectures respectively. Adding course is done from the “Add Course” page. While the teacher is creating the course details by entering course name, module name and lecture name, there might be a course, module and lecture with the same name in the database. There is a restriction for tutors to create the same courses, cause the concept map of a course is almost the same for different tutors. This limitation is controlled by the system algorithms. Courses are given under a department and a class. This means, students in that department and class are automatically reach those courses.
19
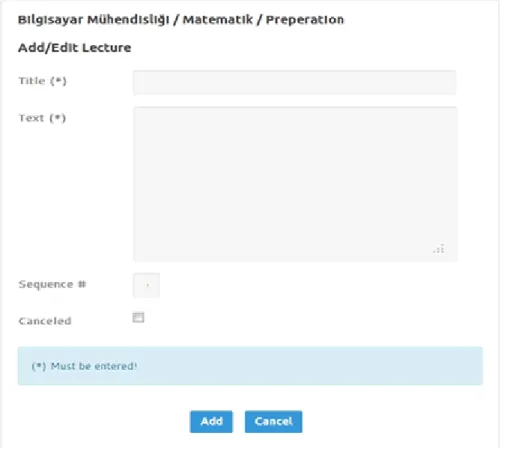
Tutor enters the course data which consists of documentation or text information of the course and a concept map:
Course content which is the text or passage part of the lecture and a concept map are, entered by the tutor of the course. The application is based on courses that is taught by the lecturer so this function has the highest priority. Tutor enters the password. If the password is correct, he accesses to a GUI that helps to create course information. Tutor enters the title, adds passage of the lecture, draws the concept map. Course data is written to the related database tables.
Only users with the tutor role will have a permission to create courses. This is restricted by the login mechanism. Tutors that have an account can enter the system with a user name and a password. Concept map creation page is same for lecturers and students except for one difference which is student page has an evaluation/comparison button. Teacher enters a title, a reading passage, which can include texts and images, determines concepts, draws concept map by using concepts and indicates relations between concepts with links and choose description of the links from passage.
20
Student sees the list and study the courses that are assigned to his department:
Student may search his courses by typing the name of the course to the search form. My Courses menu option automatically lists all the courses that is given under the same department as student’s. This page only shows courses which is given under the student’s department. For other courses, student’s menu has an options named Courses and Modules.
21 Student searches for available courses:
Other search options are also available for students. Courses and Modules menu options has three fields in common. These are department, class and course. Modules menu has also Module search option. Learner may prefer to search courses or modules. List of courses with related modules and lectures are listed.
22
Student choose a lecture to study, reads the passage of the lecture, and by selecting concepts from the text draws concept map:
Student choose a lecture by clicking the name in the list of available courses. He reads the passage and tries to draw the concept map. Concepts are marked by clicking and selecting the word/words in the passage. While concepts are selected one by one, they are pasted in the palette’s text area, facilitates drawing concepts and links. Texts are automatically written inside boxes or ovals and written on lines between concepts.
Concept map drawing palette has different type of buttons for performing various tasks while drawing the map. Rectangle buttons are for demonstrating concepts. Concepts are drawn automatically by clicking on a rectangle shape and then clicking somewhere on the drawing area. Line button is used for connecting concepts. Text box which is laid on the left-bottom of the palette, is used for labeling concepts or links. Users, who like to create their concept map colored, may use the color palette before drawing objects. Undo and redo buttons make the drawing easy for users, who tend to make mistakes. Delete button is passive by default. When an image or a schema is selected with a click, button turns to active. It is used to delete one image at a time. Bin button is used to clear the drawing area. Users may save their concept map by using save button, after they finish drawing.
23
Students may compare concept map with the compare option. System gives results of the comparison:
To improve the learning process, evaluation of the concept maps are very important. After creation of the concept map and getting the feedback, students may like to recreate the concept map. This is done by ‘Clear All’ button which deletes the drawing area then user can create the concept map again. User may choose to evaluate concept map by comparing it to the one that is depicted by the tutor. By clicking on a “Compare” button, system gives the results of correct, wrong, missing and excess concepts and relations.
24 Concept maps are drawn by the users of the system:
Both tutors and students draw concept maps, which is one of the significant feature of the system.
After selecting the concepts or links, users draw concept map. Concepts are dragged to the drawing area one by one. Users draw lines between concepts to show the links between them. Links are named by users. Students get feedback which are determined by the lecturer of the course, these are highlighted words, different colored boxes and slow/fast moving shapes while drawing the concept map.
25
Educator of the lecture may choose to give points over hundred to the students while comparing operation:
Teacher may set the ratio value for both concepts and relations. Total ratio must be over hundred. If teacher sets the penalty values when entering the lecture information, student will get penalty from excess concepts and relations.
Student’s missing concepts over total concepts which are determined by educator is multiplied with the ratio of concepts. Relations which are not drawn by the student is divided to the total relations which are depicted by lecturer is multiplied with relations’ ratio. These values are added to set the point over hundred.
If educator sets the penalty values, each excess concept and relation gets a negative value, which is subtracted from the point.
Educator sets the feedback options of the lecture:
There are two types of feedback in the application which are highlighting words or phrases based on their object type or weight and giving visual responses while learner is studying actively on drawing area. Teacher may set feedback options separately for each concept and relation type.
Concepts are shown with yellow colors, links are depicted with blue on text area. Strong weighed objects are underlined and weak objects are written italic.
If one of the drawing feedback is open, excess concepts and relations begin to move and finally disappear with animation, right after the object is created on the drawing area. Wrong weighed objects are colored with pink.
Strong weighed objects are moving slowly, weak objects are rather running away from the mouse pointer when student tries to drag the objects on the drawing pane.
26 3.8 System Models
3.8.1 Scenarios
Prof. Selçuk Öğrenci opens his tablet’s browser and enters the application web address on a search bar. Application main page opens. He clicks ‘Login To CMap’ link to add a course regarding his profession area which is ‘Relational Databases’. He enters his e-mail address which is his username and password to the related fields of the login page. Application searches the database, verify the account credentials and let him access his page. He has “Courses”, “My Courses”, “Answers”, “Change Password” and “Logout” menu options on his page. He likes to add a new course by clicking on a “Courses” menu option. He clicks “Add New” button at the bottom of the Courses page. He enters course title as ‘Introduction to the RDBMS’ and choose department, class values. He clicks on “Modules” link and add new module on Modules page. He writes Module name and assign a sequence to the module. Then he clicks on “Lectures” link to create a new lecture. He enters the title of the lecture, copy-paste the lecture’s text from a word document which is located in his file system, assign a sequence to the lecture and select “Show Concepts” help option. He clicks on “Concept Map” link to generate the concept map. Concept Map page has the text and drawing area. He specifies the concepts of the course as ‘schema’, ‘database’, ‘tables’, ‘users’, ‘rows’, ‘columns’, ‘foreign keys’, ‘primary key’, ‘constraints’, ‘views’, and ‘sequences’. He creates a concept by selecting the word ‘database’ on the text and clicking on a drawing area. He then creates the ‘schema’ concept below the database concept on the drawing area. He selects these two concepts by control clicking to create a link between them. He clicks the phrase of “is collection of” and a line from palette’s menu, makes a link between two. He continues the same way and completes concept map and save it to the application’s database.
27
Duygu opens his mobile phone and enters the application web site’s address to her browser’s address bar. She logins to the system by entering her e-mail address and password. She looks for available courses to study from “My Courses” menu option. She finds out that Prof. Selçuk publishes a course about relational databases. She clicks on the course name, then module name and finally selects the first lecture. Concept map page with lecture text and a blank concept map drawing area opens. She reads the lesson and tries to draw the concept map. Concepts are shown with yellow colored on the text which was defined by the teacher. She clicks on the concepts to draw the map. She has to decide on connections between these concepts. She saves her concept map with clicking on “Save” button. She finishes her concept map and clicks on ‘Compare’ button. She finds out that she has three correct and four wrong and one excess object. She tries to correct her wrong objects until she has not wrong and excess objects.
28
CONCEPT MAP BASED LEARNING SYSTEM Chapter 4
SYSTEM ANALYSIS AND DESIGN
Analysis and design is the major phases for a software project, to become successful or failure. It should be managed correctly and differently according to type of system which will be developed. System analyst analyzes, designs, recommends and maintain many types of systems for users and businesses. Analyst should consider all levels of organization and all phases of project which is how to process data for business transactions, how to support data workers, how to integrate information systems which are existing on different management levels, how to help decision makers with business strategies and executives for making decisions.
Business experts and executives prefer to carry their business activities and implement new business rules to web systems. Web technologies and environments increase the availability and usability of services, allows 24-hour access for users and enhance globalization, thus giving possibility to reach more people than local without worrying about time and localization.
System development is a seven step loop which is called system life-cycle. Steps are determining problems and/or objectives, identifying requirements, analyzing system and user’s needs, designing the desired system, developing and documenting the software, testing and maintaining the system and implementing and evaluating the system respectively. First four steps are done by system analysts and designers. In some organizations and approaches sometimes this two can be done by one expert called analyst.
29
System analyst use some tools in analyzing and designing phase of the system and this tools depicts the constructed system graphically. Some of them are system flow diagram, context-level data flow diagram, logical flow charts, entity relationship modeling and use-cases.
Some of the tools is used for analyzing to achieve the quality, robustness and success of newly created system.
30 4.1 System Flow Diagram
ADMIN TEACHER STUDENT
Admin creates user As a teacher
An e-mail is sent to
the new user Teacher logins to the system.
USER User information An e-mail which includes password is received.
Teacher searches for courses Teacher creates course data. Course text and concept map is created. Admin creates user
as a student
An e-mail is sent to the new user
An e-mail which includes password is
received.
Student logins to the system.
Student searches for courses
Student choose a course to study
Student creates his own concept map.
Student compares his concept map.
31 4.2 System Flow Diagram Description
System admin adds a user as a teacher to the system.
System sends an e-mail to new user’s e-mail address, which includes, system password.
Teacher logins to the system using the password and e-mail address. Teacher searches for courses, modules and lectures.
Teacher creates a course, module and a lecture respectively. Teacher adds or copy/paste text of the lecture.
Teacher draws concept map by selecting concepts and links one by one from the text of the lecture and using tools from the drawing palette.
Student logins to the system using the password and e-mail address. Student searches for courses, modules and lectures.
Student starts to study one of the lectures. Student reads the text part of the lecture.
Student tries to draw concept map by clicking the word/words from the text and using the tools in the drawing palette menu.
Student clicks to compare button to compare the concept map he draws with the concept map which is drawn by the teacher.
32 4.3 Data Flow Diagram
Data flow diagrams are way of demonstrating and designing logical model of the system. DFDs depict the process and flow of data in to and out of the system. DFDs show inside of the system, using entities and data flows between the data storage and transactions. External entities that are outside the scope of the system, are not included in this graphical tool.
Boxes are showing entities which demonstrate data resources. Rectangles without one edge shows the data storages. Data storages can be magnetic discs, CDs, text files or any type of document. Arrows are demonstrating the flow of data from entities to data storages or data storages to entities. Data names are shown on these arrows. Rectangles with rounded borders indicate data processes. Processes are not defined with long sentences rather with semantic words. Data Flow Diagrams are used only for analyzing the process of data.
Some business processes are too complex to shown by one data flow diagram. Decomposition is the process of demonstrating the system in a hierarchy of data flow diagrams. Child/sub diagrams represent a part of the parent/super diagram in greater detail.
33 SYSTEM
ADMIN USER
User information
User Data User information
Educator Student User assign ment Sending e-mail Educator e-mail, password Student e-mail, password EDUCATOR STUDENT password password
Courses, modules, lectures search Course data Course data Create New lecture Lecture Lecture textCmap,
Choose a lecture Lecture text Draws cmap Answer Cmap, userID, LectureID
34 4.4 Data Analyze
Although data flow diagrams show data and flow of data, the data storages should be analyzed more deeply to create successful database model. Designing of the database model and creating physical database based on database models is highly important for success of the project. Database modeling in software projects that are not analyzed well, may create proper databases in the beginning of the project, but may fail later when trying to add new tables or modify the existing tables while maintaining or adding new features to the project.
Data analyzing ease the modeling of data. It shows database tables, relations and relation types between database tables, column names, types and lengths in the tables.
35 4.5 Database Modeling
4.5.1 Database Tables
Users
User ID#, User Title, User First Name, User Last Name, User E-Mail, User Password, User Group, User Language, User Picture, User Status, User Row ID
Student
Student ID#, Student User ID, Student Department ID, Student Class, Student Status, Student Row ID
Educators
Educator ID#, Educator User ID, Educator Course ID, Educator Status, Educator Row ID
Student Courses
Student Course ID#, Student ID, Course ID, Student Course Status, Student Course Row ID
Departments
Department ID#, Department, Department Upper ID, Department Status, Department Row ID
Courses
Course ID#, Course, Course Department ID, Course Class, Course Status, Course Row ID
36 Modules
Module ID#, Module, Module Course ID, Module Sequence, Module Status, Module Row ID
Lectures
Lecture ID#, Lecture Title, Lecture Module ID, Lecture Course ID, Lecture Text, Lecture CMap, Lecture SVG, Lecture Sequence, Lecture Helper1…LectureHelper12, Concept Ratio, Relation Ratio, Concept Penalty, Relation Penalty, Lecture Status, Lecture Row ID
Answers
Answer ID#, Answer User ID, Answer Lecture ID, Answer CMap, Answer SVG, Answer Evaluation, Answer Correct, Answer Not Exact, Answer Missing, Answer Excess, Answer Status, Answer Row ID
Mail Template
Mail Template ID#, Mail Template Reference, Mail Template Subject, Mail Template Body, Mail Template Language, Mail Template Canceled, Mail Template Row ID
37 4.5.2 Relation Between Tables
Database Tables
TABLE RELATIONAL
TABLE
RELATIONS RELATION
TYPE
Users Students Connected n:1
Users Educators Connected n:1
Users Answers Connected n:1
Departments Students Connected n:1
Departments Courses Connected n:1
Courses Educators Connected n:1
Courses Modules Connected n:1
Courses Lectures Connected n:1
Courses Student Courses Connected n:1
Students Student Courses Connected n:1
Lectures Modules Connected 1:n
Lectures Answers Connected n:1
38 Database Tables and Relations
USERS STUDENTS EDUCATORS STUDENT COURSES LECTURES COURSES MODULES ANSWERS DEPARTMENTS
39 4.5.3 Database Tables
Table Names Field Lengths Field Data Types
Users
User ID# 10 Integer
First Name 45 VarChar
Last Name 45 VarChar
E-Mail 255 VarChar
Password 255 VarChar
Group 10 Integer
Language 2 Char
Picture 255 VarChar
Status 1 Tiny Integer
RowID 20 VarChar
Students
Student ID# 10 Integer
User ID 10 Integer
Department ID 10 Integer
Class 10 Integer
Status 1 Tiny Integer
40
Table Names Field Lengths Field Data Types
Educators
Educator ID# 10 Integer
User ID 10 Integer
Course ID 10 Integer
Status 1 Tiny Integer
Row ID 20 VarChar
Student Courses
Student Course ID# 10 Integer
Student ID 10 Integer
Course ID 10 Integer
Status 1 Tiny Integer
Row ID 20 VarChar
Departments
Department ID# 10 Integer
Department 100 VarChar
Upper ID 10 Integer
Status 1 Tiny Integer
41
Table Names Field Lengths Field Data Types
Courses
Course ID# 10 Integer
Course 100 VarChar
Department ID 10 Integer
Class 1 Tiny Integer
Status 1 Tiny Integer
Row ID 20 VarChar
Modules
Module ID# 10 Integer
Module 255 VarChar
Course ID 10 Integer
Sequence 10 Integer
Status 1 Tiny Integer
42
Table Names Field Lengths Field Data Types
Lectures
Lecture ID# 10 Integer
Title 100 VarChar Module ID 10 Integer Course ID 10 Integer Text 2256 Text Cmap 2256 Text SVG 2256 Text Sequence 10 Integer
Helper1..Helper12 1 Tiny Integer
Concept Ratio 3 Integer
Relation Ratio 3 Integer
Concept Penalty 2 Integer
Relation Penalty 2 Integer
Status 1 Tiny Integer
Row ID 20 VarChar
43
Table Names Field Lengths Field Data Types
Answers
Answer ID# 10 Integer
User ID 10 Integer Lecture ID 10 Integer Cmap 2256 Text SVG 2256 Text Evaluation 2256 Text Correct 10 Integer NotExact 10 Integer Missing 10 Integer Excess 10 Integer
Status 1 Tiny Integer
Row ID 20 VarChar
Mail Template
Mail Template ID# 10 Integer
Reference 128 VarChar
Language 2 Char
Subject 256 VarChar
Body 2256 Text
Canceled 3 Tiny Integer
RowID 20 VarChar
44
CONCEPT MAP BASED LEARNING SYSTEM Chapter 5
USED TECHNOLOGIES IN THE SYSTEM
5.1 XML (EXTENSIBLE MARKUP LANGUAGE)
XML is a language which is used for storing data. It is designed to meet some requirements like it should be straightforward to transfer data between all sorts of applications, should be easy to create and process XML documents, should be prepared quickly, should be easy to interpret by human and should be written formally. It is not for displaying data and it has not predefined tags like HTML. XML tags are defined by the author of the document.
Some of the popular XML applications are
WSDL for describing available web services, WAP and WML for handheld devices, RSS for news feeds,
RDF and OWL for describing resources and ontology, SMIL for describing multimedia in web
5.2 DOM (DOCUMENT OBJECT MODEL)
Document Object Model is a tree of objects, which is used for accessing and modifying of documents. HTML documents are becoming dynamic with JavaScript, which uses DOM to structure and style HTML elements. HTML DOM is a programming interface for HTML. It defines HTML elements as objects and their attributes, methods and functions.
45 5.3 JAVASCRIPT
ECMAscript which is more widely known as JavaScript is one of the most popular scripting language in web context. A Script is a programming code which does not need to be compiled to run. JavaScript is used mostly in web and mobile programming to enhance the interactivity, visuality and usability of applications to give ability of desktop applications to web pages.
JavaScript is first used by Netscape’s web browser in 1995. It is now interpreted by all major browsers such as Mozilla Firefox, Safari, Google Chrome and Internet Explorer. It uses DOM to access HTML elements and language standards to add events and content, change source and styles, validates the input of the elements.
JavaScript is executed when a page is downloaded by a browser or an event is triggered by a user. For example, content of a web page or an element can be changed, inputs can be validated when a button is clicked, part of a web page can be loaded without reloading the whole page by using AJAX technology, style of an element can be changed and location of a device can be retrieved.
JavaScript uses HTML DOM object model to access elements in the page, modify elements in the page, change styles of elements, remove elements and attributes, add new elements and attributes, react to all pre-defined events and add new events.
5.4 JQUERY
JQuery is a JavaScript library which ease the way of writing JavaScript in web. It is much more simpler, lightweight which is only 32KB and compatible with cross browsers. It also supports CCS3.
46
5.5 AJAX (ASYNCHRONOUS JAVASCRIPT AND XML)
AJAX is a web technology, which is a different way for the client to communicate with the web server. It requests and gets response from the web server in an asynchronous way which means required data can be requested and received without loading the whole page from scratch.
In a standard client-server communication, when the user clicks on a button or selects an option from a list box, it evokes a standard request that sends to a web server, server prepares the response and send it back to the client. Server’s response received by the client’s browser and data, which is a web page, is loaded to the client’s computer. This is an extra load between the server and client communication and superfluous process when the data that is transferred is rather small to reload the page.
AJAX technology enables the data to be transferred between client and server using JavaScript and XML technologies. The page does not have to be reloaded and data transfer is minimized. User does not wait long to get the response. Client can send more than one request at a time while waiting for other responses.
47 5.6 HTML5
HTML5 is the last version of HTML (Hypertext Markup Language), core language of the web. It has new elements and attributes such as video and audio tags for media content, canvas tags for 2D drawing, plugins to reduce external plugins like Flash, web storages for local storage of data, animations, graphics and APIs. It is designed to build complicated web applications.
The previous revisions of HTML5 is HTML and HTML 4.0. HTML 4.0 was being used since 1999. The use of Internet and mobile devices has changed a lot in web standards and needs. Some of the elements that is not used in 4.0 are removed from new version of HTML.
HTML5 is device-independent, means it is compatible to run in cross-platforms like PCs, Tablets, Smart phones and Smart TVs. Its new features are based on HTML, CSS, DOM (Document Object Model) and JavaScript standards.
Three different image formats are dominant from the beginning of the web. GIF, JPEG and PNG images are raster images and they have been used for different purposes. GIF images are created with 256 different colors, can be set to transparent and able to order images to make an animation. PNG format supports 32-bits colors and has transparency property.
These image formats cannot be modified programmatically, meaning display of the image cannot be rendered dynamically. HTML5 has two new tags to fulfill this problem.
Canvas element is a two-dimensional grid to draw graphics in a web page. It is a rectangular container without content and border. A scripting language, usually JavaScript, is used for drawing graphics on canvas element and integration with DOM gives interactive solutions. It has some cons when comparing with SVG, such as it only supports pixel-based images like JPG or GIF, rendering is done pixel by
48
pixel which is slow, no support for event handling, resolution dependent means it is not scalable and scale up with loss of quality.
SVG is a programming language for drawing two-dimensional graphics since 1999. It is part of HTML5 and is based in XML format. It is an open standard. Graphic objects that is described by SVG are vector based graphics such as straight lines and curves, images and texts. SVG graphics can be zoomed in or out or resized without losing any quality, animated, created and edited with text editors, searched, indexed, scripted and compressed, printed with high quality at any resolution. SVG is supported by some versions of major browsers like Firefox, Opera, Safari and IE.
49 5.7 TWITTER BOOTSTRAP
Twitter Bootstrap is a set of tools to develop interfaces which consistent between incompatible browsers. It was developed by Marc Otto and Jacob Thornton at Twitter. The framework avoid the use of multiple libraries while creating web applications or web pages that look and work the same way in various browsers. It is supported by all major browsers. It is also compatible with different sizes of devices.
Bootstrap is a front-end framework which has designed templates, fonts for enhanced typography, basic HTML elements such as forms, tables, buttons, images that is more sophisticated with CSS classes, components such as navigators, alerts and icons for better usability and visuality, other interface elements such as buttons with pagination feature, progress bar, breadcrumb navigation, thumbnails and jQuery plug-ins such as carousels, tooltips, pop-ups and auto-completion for input fields without the need of writing JavaScript codes.
The application which is developed should be eligible for various screen sizes. Users may like to access the application via tablet or mobile devices or even via desktop computers. Web page layout development that is designed to fit into the different screen sizes like tablet, mobile phones, PCs, is called responsive design. Twitter Bootstrap ease the development of responsive web pages by its responsive grid system feature and predefined classes.
Twitter Bootstrap’s grid system is made up of rows and columns. Number of columns inside a row can be scale up to twelve as the screen size of device increases. It uses Div elements to create rows and columns. Rows must be enclosed inside a container. Columns are created inside of rows by specifying number of twelve available columns.
50
Every element that appear on a web page such as navigation bars, buttons, menus, forms and tables should be all congruent with Twitter Bootstrap. Otherwise page layout or elements that reside in a web or mobile page interlace and do not work properly. Therefore nearly all components that is used in the application are basic HTML elements extended with Bootstrap classes.
51 5.8 CSS (CASCADING STYLE SHEETS)
Cascading Style Sheets, abbreviated as CSS, was included in HTML4.0 to add styles to web pages. HTML had some tags such as <font>, <center>, <b> for bold, <i> for italic and attributes like color, border, cell spacing and more to style the elements in a web page. It was time consuming and exhausting for a web developer to add style to a web page, with adding tags and attributes to every single element. When it comes to change the design of some elements or redesign a web page from scratch, large web sites consisting of many pages should be revised and modified from the beginning.
CSS is a World Wide Web Consortium (W3C) standard. It defines fonts, sizes, colors and layouts according to the type of HTML tags, group of elements or for an individual element. Style of a web page is included in an external CSS file, thus separating HTML from CSS. This separated CSS files can be used with any markup language or with many different web pages, ease the updating and maintaining styles and can be designed to support varied screen sizes.
CSS3 is the latest version of CSS. It has new modules and features such as
Adding rounded corners to elements, Creating boxes with shadowed borders, Adding multiple background images,
Using gradient effect to reduce the rendering time of the page rather than different background images,
Adding shadow to texts,
Supports different web fonts which is not included in user’s computer, 2D and 3D transformation,
Add flash like effect when changing between one style to another,
Create animations which can replace animated images, JavaScript and flash objects,
Create columns and gap between columns for texts, Resize elements dynamically without using JavaScript.
52
5.9 SVG (SCALABLE VECTOR GRAPHICS)
Scalable Vector Graphic is a W3C recommendation for 2D graphics. It is widely used in many business areas and supported by many industries such as Apple, Adobe, Corel, Canon, IBM, Kodak, Microsoft, Nokia and Sharp. It is an XML file and has an API for programming graphical interfaces. SVG is for drawing shapes, texts and raster graphics. It has different painting features and styles. It supports scripting by JavaScript and animations. SVG is used to design web graphics, graphical interfaces, animations, mobile applications and high quality shapes.
SVG graphic objects can be vector graphics, images and texts. SVG objects can be grouped, styled and transformed. Scripting and Document Object Model (DOM) for SVG makes drawing and animation of graphic objects dynamic, straightforward, interactive and efficient. It is compatible with other Web technologies such as scripting and events like onmouseover and onclick can be attached to SVG objects.
5.10 SNAP SVG
SNAP SVG which is used in this project to draw SVG objects, is a JavaScript library. It is compatible with jQuery JavaScript library. The library facilitates and gives the ability to users to draw concept maps. It is included into the HTML pages by giving reference to JavaScript libraries and other supporting files. It supports basic shapes like rectangles, circles, ovals; images; interactivity; text; transformations; styles; masking and gradients. Rectangles are used for depicting concepts, lines are used for showing links and texts are used for labeling concepts and links.
SNAP SVG is free and open-source which is licensed under Apache2. It is designed for all major browsers’ latest versions such as Google Chrome, Firefox, Internet Explorer, Safari and Opera. Therefore the library can support many SVG feature like masking, clipping, pattern and groups.
53
CONCEPT MAP BASED LEARNING SYSTEM Chapter 6
PROGRAMS AND PROCESSES
6.1 Libraries, Tools and Components
Jquery-ui library is used to drag and drop elements in canvas.
The application used a theme called Zeina. It has a JavaScript library with the same name and it uses more JavaScript libraries to design, animate and manage elements in HTML pages. Some of them are activeaxon_menu for application’s top menu, animationEnigne for menu animations, ie-fixes and jquery.validate.
snapsvg.js library is the library for drawing canvas and concept map components.
bootstrap-colorpalette is a JavaScript library which is used to select different colors while drawing concept map. It is the same library which is used by Google but also compatible with bootstrap.
cmap library includes collection of codes for md5 encryption of pages that has password sending to the server like login page, setting and getting cookies, file uploading, creating list boxes using AJAX, saving the application from robot attacks to mail addresses by modifying mail address’ parameters and getting URL parameters.
textselect is another JavaScript library which implies text selecting by clicking and scanning.
perfect-scrollbar.js manages scrollbars in pages. It can also disable scrollbars of browsers.
54
svg.js has all necessary codes for drawing concept maps. It creates canvas which is the main area for drawing concept map. It sets the size of sketchpad when page is loading and while screen size is changing. It loads previously drawn concept maps on to the canvas. It has functions for dragging and dropping objects and drawing various types of objects such as rectangles, lines and texts. It measures the mouse position from start point to the end point while dragging and drawing objects. It has also functions for handling all actions created by buttons that generates concept map menu bar such as undo, redo, delete, clear and save. The library sets menu bar buttons enability and disability according to the actions that is performed by the user. Finally, the library has a functionality to find the suitable text color while drawing concept map objects to manage the best visibility of concepts and texts on them.
55
The application consists of thirty-eight different program, thirty-two CSS files to manage style of elements, seven different font files to manage typefaces, eighty-one image files for displaying images, buttons, menus, icons, navigators and bullets, nine files to configure the database connections, manage site parameters and global functions, seven files to enable JQuery features, fifty-eight different JavaScript library files, twelve files to adjust different menus for different type of users and for English and Turkish languages and three files to create list boxes with AJAX. The application is totally made of two hundred forty seven files.
All pages include libraries, header and footer files. Libraries files mostly consist of CSS files and a few JavaScript files. Header file includes logo, navigation menu, breadcrumb (easy access links to previous pages of the current page) and loading indicator. Footer contains social media links and most of the JavaScript references of the application.
Programs are restricted for the non-authorized users. This restriction is provided in the beginning of the program with the user role number and the page security settings. Users’ security role is set in the database table.
The application is available in two languages, these are English and Turkish. Infrastructure of the application supports multi languages, so more languages can be added later. All texts inside the application are references which is searched and filled with the proper translation from language files according to the user language. This structure is also supported within the database for example appropriate language is chosen from the e-mail templates table and e-mail is sent to the user with the user language.
56 6.2 Concept Map Drawing Process
Concept map drawing page is divided into two sections. Lecture’s reading area is on the left hand side of the page, drawing area is on the right hand side. After reading the passage of the lecture, lecturer or student starts to draw the concept map. Concept maps consist of concepts and connections. The application has a set of tools that facilitates the drawing process.
Concepts can be depicted by using squares, circles or ovals in concept map learning method. Application’s toolbar has different sets of square shapes for users to draw different weight of concepts. Links are shown with lines, the toolbar has three types of lines to show different connection types. Users may prefer to draw their concept map by using various colors from color palette which is located in the toolbar next to lines. Users would like to continue their work or check what they did previously any time they wish, therefore save button is used for saving the concept map to the database not to lose any data before leaving the page. If the user saved the concept map, he accesses the concept map when he enters the page. Objects can be selected by using click key combination. Cross button is used for deleting the object when an object is selected. Users may take back their last action with Undo button. “Clear All” button removes all objects from canvas.
Every concept and every link that connect concepts must have a text, thus before creating concepts and links users should select text from the passage or enter appropriate words to the text box which is located in the toolbar of the sketchpad. A word can be selected by double clicking or by moving the cursor from beginning to the end of the phrase. After selecting the text, concepts are added to the drawing area by selecting the appropriate type of square shape and by clicking the area on canvas. Links between concepts are generated by clicking on a line type in the toolbar. Text of a link is also generated same way as text of a concept. Connection between two concepts is done with selecting the concepts by clicking and clicking somewhere on the canvas. Objects’ position can be changed whether they have a connection with other objects or not. By clicking on a concept without releasing the mouse, concepts can be dragged anywhere on the area.