1
LOGISTICS PROCESS IMPROVEMENT OF KAPIKULE BORDER
CROSSING
Çekyay B., Işık M., Ülengin F., Kabak, Ö., Ekici, S., Ozaydin, O., Palut, P.T., Bozkaya, B., Topcu Y.I.
Abstract – In this study, logistics process improvement of Kapikule Border Crossing, one of the largest
customs gates, has been evaluated. It is obvious that, any decrease in trade time is expected to realize positive impact on the logistics competitiveness of a specific country. In order to reduce time across all dimensions of the border process, the improvement of physical infrastructure and the proliferation of procedures are the most important issues that should be focused on. The aim of the study is to improve the Kapikule border crossing by reducing the process time. For this purpose, first, in-depth interviews were conducted with the Kapikule customs gate authorities in order to reveal explicitly the process flows. Subsequently, the current situation at the gate was simulated using the Arena simulation software. Finally, several improvement scenarios were tested to identify the ones that will have the highest impact on reducing the queues and the delays at the border.
Keywords: Process analysis, simulation, border crossing
1. INTRODUCTION
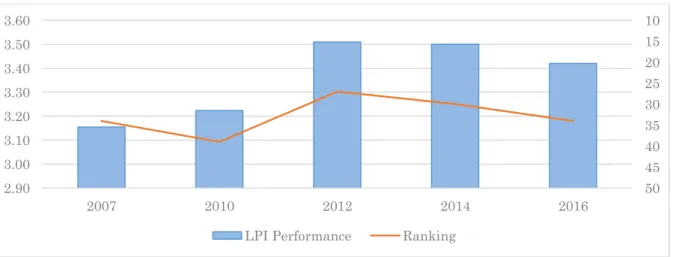
The Logistics Performance Index (LPI), which is published on the website of the World Bank, is an important index for the evaluation of the logistics performance of 155 countries according to six basic indicators. The indicators used in the calculation of the index are: the customs, the infrastructure, the international shipments, the service quality, the tracking and tracing, and the timeliness [1], [2]. As the backbone of international trade, logistics plays an important role in the development of public policies, which are formulated by the national governments and regional and international organizations. In fact, in the countries with good roads and predictable customs clearance, the delivery times will be both shorter and more certain [1]. The development of the logistics sector is expected to have a positive impact in terms of increasing production, consumption and trade, thus stimulating the economic growth. In addition, better infrastructure will contribute to attracting foreign direct investment [3], [4], [5] and [6].
Logistics is critical to the underlying value of businesses, the growth potential, and the economic competitiveness. Unfortunately, logistics is often disrupted owing to border delays, security concerns, and infrastructure constraints. These issues create an environment of uncertainty in the business community, which deters investment, job creation, and economic prosperity [7].
By closely observing the indicators of the LPI report, the international shipment indicator is defined as “The ease of arranging competitively priced shipments” [1]. The LPI measures this factor based on several indicators; among these, the import and export time are used for the measurement of logistics
2
performance. As there is a considerable amount of shipment time variability in the developing countries, it substantially increases the generalized cost of haulage and, thus, has a negative impact on international trade. Therefore, any decrease in trade time is expected to create a positive impact on the LPI. For this, it is necessary to reduce time across all dimensions of the border process, and to enact reforms that focus on the prevalence of physical inspection and the proliferation of procedures and bureaucracy. In a country with better road infrastructures as well as predictable and quick customs clearance, there will be shorter and more certain delivery times, which will develop the SCM sector and will cause that country to gain competitive advantage. Hence, a country has to focus on improving customs, logistics quality, and timelines of its logistics operations. Logistics performance is inevitably highly dependent on government interventions such as investing in improved road infrastructures, developing regulatory transport service regimes, and implementing efficient customs clearance procedure. Governments play an important role on designing operations, processes, and infrastructures for modern and efficient customs and cross-border transport. Nevertheless, customs is not the only agency involved in border management, collaboration among all border management agencies and related stakeholders is especially important.In this study, the ways of improving efficiency of a cross border, and, hence the logistics performance of a country, will be analyzed in detail. The Kapikule cross border was selected as our case study with the aim to develop a comprehensive system that facilitates fast, safe, secure, and efficient movement of goods.
Figure 1 LPI performance score and ranking of Turkey
As can be seen in the literature review, typically, simulation has been used as a tool to model, plan, control, and to analyze the processes and improvement of complex systems, such as cross-border operations. Various discrete event simulation software tools such as Arena, ExtendSim, FlexSim, and Simul8 are used for this purpose [8]. For this reason, in this study, we used simulation analysis to examine the impact of different policies in reducing the waiting times at the Kapikule border crossing, which has become Turkey’s gateway to the West with its 12 directorates, such as customs, property administration, food, and Agriculture and animal husbandry. At the Kapikule border crossing, 250
10 15 20 25 30 35 40 45 50 2.90 3.00 3.10 3.20 3.30 3.40 3.50 3.60 2007 2010 2012 2014 2016
3
personnel are on duty during the working hours, and there are 100 additional personnel during the night shift.When logistics competitiveness of Turkey is investigated for the past decade, it may be observed that Turkey should particularly focus on customs, as well as on logistical quality and competence (Kabak et al., 2016).
Therefore, in this study, we aim to focus on the Kapikule border crossing to improve the custom border efficiency of Turkey. The Kapikule border crossing was selected as a case study since it is one of the largest customs gates, with a 333,000 m2 area that connects Turkey to Europe via road transportation. The present work is organized as in the following: First, the existing situation, process, and problems of the Kapikule border crossing will be investigated, and all the process flows will be derived. Subsequently, the existing situation will be simulated using the Arena simulation software. Finally, the impact of different improvement scenarios will be tested; the scenarios that present the highest impact on reducing the delays will be analyzed in order to provide a road map to the government authorities.
2. RESEARCH METHODOLOGY
The first step of the research methodology is to analyze all the processes that are carried out at Kapikule. The processes are categorized as import and export-related. For this purpose, initially, the stakeholders were identified, the process value maps were created, and document flows and decision nodes were determined. The stakeholders include individuals, such as customs officials (e.g., clerks, veterinarians, and agricultural engineers), truck drivers, and department managers, as well as other actors in the system, who deliver or receive the customs services.
Subsequently, each process was modeled in the Arena simulation software; a number of scenarios were executed to reduce the bottlenecks, hence speeding up the process and, consequently, providing strategic recommendations.
Process Analysis
In the first step, the goal is to lay out the existing situation at the Kapikule border crossing with all the relevant parameters. For this purpose, the sequences of activities that describe how various entities, such as trucks, drivers, cargo, documents, and information in general, move through the system were defined. In order to collect this information a total of five site visits were conducted, which started in March, 2016. Each visit consisted of two five-member teams working separately on the import and export processes. At this step, the team members observed each activity in each department, and conducted in-depth interviews with customs officers and the department managers of all the departments, namely Customs, Immigration Office, Plant Standard and Certification Office, Agriculture, Fisheries, Food and Drug Administration, Animal Quarantine, and Disease Control. After the observations were completed and the draft process flows were laid out, they were shared with the stakeholders for feedback and confirmation. Based on their responses and feedbacks, further
4
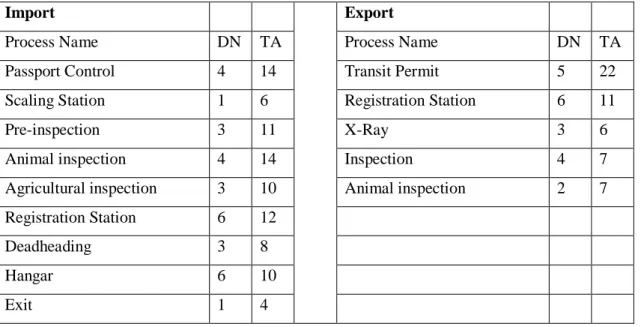
changes were made, and the process flows were finalized. The process value maps were developed such that all activities at the Kapikule border crossing would be inter-connected. Subsequently, time measurements and data collection for each step of each process are conducted to be used as input for our simulation models.The number of decision nodes and transactions were obtained from the process analysis and data collection steps, and are listed in Error! Reference source not found..
Table 1. Number of decision nodes and transactions
Import Export
Process Name DN TA Process Name DN TA
Passport Control 4 14 Transit Permit 5 22
Scaling Station 1 6 Registration Station 6 11
Pre-inspection 3 11 X-Ray 3 6
Animal inspection 4 14 Inspection 4 7
Agricultural inspection 3 10 Animal inspection 2 7
Registration Station 6 12
Deadheading 3 8
Hangar 6 10
Exit 1 4
DN: # of Decision Nodes, TA: # of Transactions
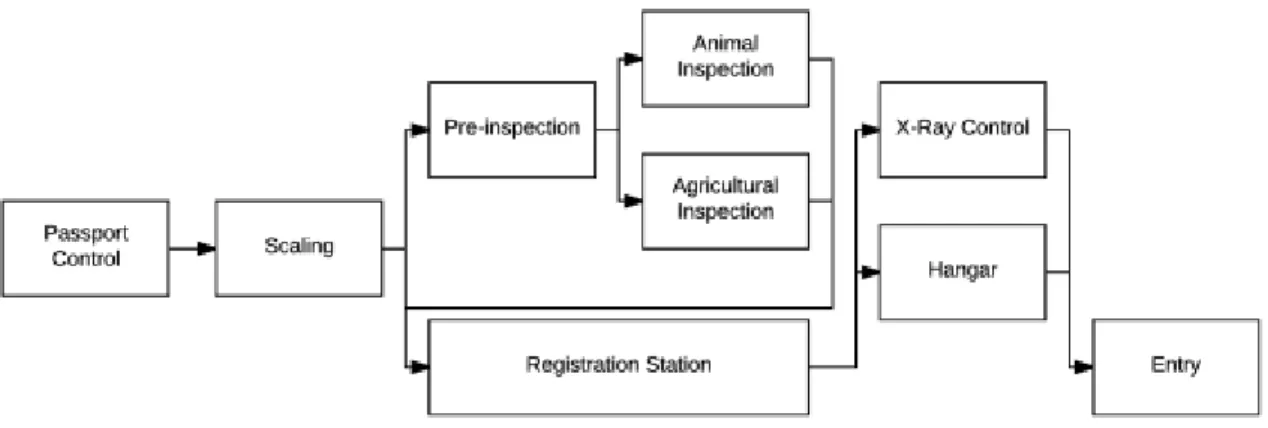
A general representation of the import process is illustrated in Error! Reference source not found.. As we may observe, after passport control, the truck must enter scaling, which is the first controlling point in the area. Then, the truck must proceed to pre-inspection, where the level of gasoline is controlled. Next, the sub-processes to be followed depend on the type of the load. Freight classified under livestock is diverted to animal inspection, whereas freight classified under agricultural products is diverted to agricultural inspection. The remaining freight proceeds directly to the registration station, where the trucks that have already passed through animal inspection or agricultural inspection must proceed to as well. After the registration process, the truck enters X-ray and/or hangar sub-processes, if necessary; this concludes the import process.
5
Figure 2 Import process flowchart
A general representation of the export process is presented in Error! Reference source not found.. As can be seen, after the truck leaves the park, it has to pass through passport control and scaling before the registration sub-process. According to the freight type of the truck and/or the inspection code that the truck belongs to, the truck must proceed to the animal and agricultural inspection sub-process or to the X-ray control and inspection sub-processes. Before leaving Turkey, the truck enters the gas station to purchase tax-free gas.
Figure 3. Export process flowchart
Data collection
The data collection approach for the process value maps involves obtaining on-site time measurements and using previously published statistical data. For the latter, the activity times for various customs tasks published by the Ministry of Customs and Trade and other agencies for the period May 1, 2016 to June 17, 2016 were used (Ministry of Customs and Trade, Turkish Union of Chambers and Commodity Exchanges, Customs of Trade and Tourism, International Transporters' Association) In addition, to collect the activity times, the data on the weekly truck entrance/exit counts and the truck queue lengths for the year 2016 were analyzed. The average annual exiting truck queue length is approximately 5 km (up to 10 km for 20% of the year), and the average annual entering truck queue length is approximately 3 km (up to 11 km). To better understand the problems and bottlenecks
6
regarding the customs processes, the aforementioned traffic information was used; the simulation scenarios were executed using the weekend data, which represent the busiest period.Simulation Results and Scenario Analysis
The Arena simulation software that was used in this study offers a variety of detailed functionalities for input and output data analysis, scenario analysis, and visual animation, which are the most critical elements of a successful simulation study.
The model that was built as a result of the simulation analysis was then used to determine potential improvements according to various scenarios. To achieve this, first we validated the model to ensure that the simulation model reflected the current status, which will hereafter be referred to as the status quo scenario. The results regarding this scenario were investigated in two sections, namely the import and export sections.
Import–Related Scenario Results
For the status quo scenario set for import activities that take place within the Kapitan Andreevo border crossing, investigation window is specified as 48 hours. Within this period of time It was assumed that the current level of truck activity would remain the same as the daily average of 1245 trucks. However, according to the simulation results only 59% of them (equals to 719) can be served. Since (for import section) the capacity of the servers is not sufficient, an additional 526 trucks waiting to be processed on the side of the Kapitan Andreevo border crossing.
The main reasons for the long waiting times are the registration, the booth operations, and the veterinary and agricultural control operations performed by the Ministry of Food, Agriculture and Livestock. The average number of trucks waiting before the registration booth is 25, whereas before the veterinary operations, the average number of trucks is 29.
A validation has been done for the import processes. For this purpose, the status quo scenario was executed 1000 times for a 48 h window, and the period during which Kapikule was most crowded was investigated. All data within the model had been acquired from the field, with only one exception, namely the time between the arrivals of the trucks at the border. The data acquired were the time between the trucks entering the parking area; however, the required data were the time between each truck joining the end of the queue. Unfortunately, these exact data could not be obtained; instead, the time difference between arrivals at the parking area was modified to reflect the increasing number of trucks arriving. In this manner, the truck arrivals could be modelled as being more crowded.
7
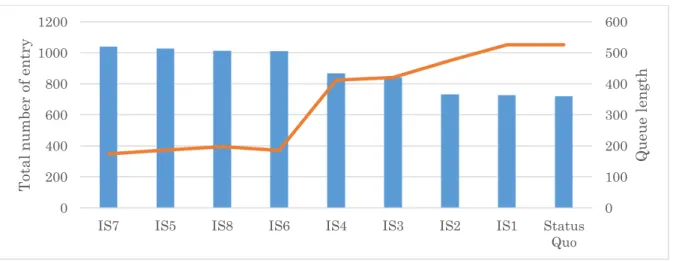
Figure 4 Scenario Analysis results (Import Section)
To resolve these bottlenecks in the most efficient manner, several scenarios were tested. In the first scenario (IS1) the number of lanes is increased by one. The second scenario (IS2) assumed that the passport control and scaling processes were integrated to the registration station. In the third scenario (IS3) the improvement that could be achieved by increasing the number of registration stations from four to seven is investigated. IS4, analyzed the impact of reducing the ratio of the average number of trucks passing from the inspection and X-ray after registration to the total number of entering trucks to 5%. The improvement that could be achieved by placing an officer of the Ministry of Food, Agriculture and Livestock on a 24/7 duty is investigated by scenario 5 (IS5). Scenario 6 (IS6) assumed that the personnel of the Ministry of Food, Agriculture and Livestock actively worked for 21 h a day. The last two import scenarios (IS7 and IS8) are aggregated improvement scenarios in which a combination of IS1, IS2, IS3 and IS5 is investigated by IS7 and a combination of IS1, IS2, IS3 and IS6 is analyzed by IS8.
Export-Related Scenario Results
The results of the status quo scenario can be summarized as follows. During the 48 h investigation window, an average of 3188 trucks arrived at the border. Only an average of 1609 trucks were able to exit, and a queue with an average of 520 trucks was formed. During the same period, the average time between arrival and exit was 13.7 h, out of which an average of 83% (11.4 h) was allocated to waiting in the line, and 15% corresponded to when the drivers are waiting in the parking area or finalizing the required documents. The official operations accounted for less than 2% (15 min)
The corresponding waiting times for each station are as follows. A truck that enters the queue outside the parking area waits for an average of 6.7 h. A truck waits an average of 2 h in the parking area. When a truck is cleared to exit the parking area, it waits for an average of 2 min. The average waiting time from the truck park to the passport control is 20 min, from the passport control to the scale is 3.8 min,
0 100 200 300 400 500 600 0 200 400 600 800 1000 1200
IS7 IS5 IS8 IS6 IS4 IS3 IS2 IS1 Status
Quo Q u eu e len gt h T ot al n u m ber of e n tr y
8
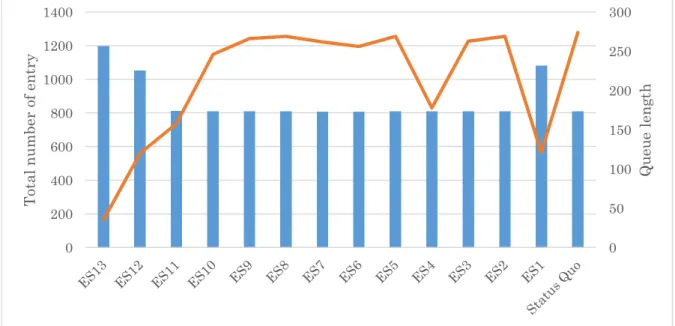
and from the scale to the registration booth is 1.22 h. From this point, if the truck is not due for X-ray, inspection, or refueling, it crosses to the Bulgarian side in 1.2 h. This time increases to 3.2 h, if the truck needs refueling. If a truck is directed to X-ray, then the average waiting time increases to 4.4 h, and if it is directed to inspection, the waiting time increases to 3.8 h.In the first export scenario (ES1) the number of active registration platforms in Bulgaria increased from five to eight. The second scenario ES2 examined the situation in which the second exit lane would be available. In the third scenario (ES3), the situation in which mutual vehicle passing is provided through four exit lanes. The effects of increasing the parking area capacity to 500 is investigated in ES4. In scenario 5 (ES5), all the operations were assumed to be performed at a single station. ES6 assumed that the gas station processing time was zero, and all trucks were assumed to join a single exit lane after the registration station. The situation Doubling the Number of Registration Stations is tested in ES7. In the 8th scenario (ES8), the ratio of trucks directed to the X-Ray or inspection stations after the registration station was decreased to 5%. ES9 scenario assumed that all officers work 24 h per day. The last 4 scenarios were aggregated scenarios. In ES10 scenario, ES2, ES5, ES6 and ES7 were simultaneously applied. ES11 scenario aggregated ES2, ES4, ES5, ES6, ES7, and ES9. In ES12, a combination of ES1, ES2, ES5, ES6, and ES7 were applied and in ES13, ES1, ES2, ES4, ES5, ES6, ES7, and ES9 were simultaneously applied.
Figure 5 Scenario results (Export Section)
3. Conclusions and Further Suggestions
In this study, we made efforts to increase the efficiency of the Kapikule border crossing through process improvement techniques. For this purpose, the current process flows at Kapikule were specified through in-depth interviews, and were simulated via the Arena simulation software. The model was verified and validated to examine whether the constructed simulation would perform exactly as the actual system
0 50 100 150 200 250 300 0 200 400 600 800 1000 1200 1400 Q u eu e len gt h T ot al n u m ber of e n tr y
9
performs. Subsequently, several scenario analyses were conducted to reveal the strategies that should be implemented in order to achieve the highest possible increase in the efficiency at the border. In order to analyze the efficiency of the aforementioned scenarios, three indicators, namely the length of the queue outside the truck park, the number of exiting trucks, and the average time spent in the system, were investigated. The measurement of the average time spent in the system started when the truck joined the queue outside the truck park.According to the results, the most effective scenario for import is found to be IS7, which is the combination of scenario options IS1, IS2, IS3, and IS5. According to this scenario, it was observed that the average number of trucks entering Turkey increased from 719 to 1039. Under IS7, the total number of trucks waiting to enter to the border gate minimized to 174 trucks. Scaling and passport control did not appear to be bottleneck stations. For this reason, the level of recovery was limited. Within the scenarios that provided the highest positive impact, it was observed that the most crucial action was to change the shift time for the personnel of the Ministry of Food, Agriculture and Livestock. For import processes—rather than infrastructural improvements—the homogenization of the personnel working periods is expected to provide the highest impact on the decrease in the waiting times.
On the other hand, for the export case, there are five scenarios that can make a significant difference in the number of exiting trucks, as well as in the time spent in the system. Their common feature is the inclusion of ES1, which means that the system of the Bulgarian side accelerates its processes. As long as the system of the Bulgarian side does not accelerate, no scenario can make a difference.
The relation among ES11, ES12, and ES13 is interesting. This relationship suggested that the acceleration of the system of the Bulgarian side is essential, and that other policies start to take effect once this condition is met.
The best scenarios with respect to the average time spent in the system are ES1, ES12, ES13, ES14, and ES15. These scenarios present a difference of 6–7 h when compared with the first three scenarios, where the possible projects were implemented. An additional 3 h could be saved in ES14 and E15, which can be considered utopian; in ES14, almost all randomness was removed from the system and in ES15, the resting periods in the truck park were eliminated.
There are eight scenarios that are effective in terms of the length of the queue outside the truck park. These are ES1, ES4, ES10, ES11, ES12, ES13, ES14, and ES15. The slight improvement caused by scenario ES10 can be seen as the total effect of several development policies. However, this effect is rather limited. As ES4 and ES11 scenarios are effective, increasing the capacity of the truck park to 500 was found to be important in reducing this queue length. Nevertheless, the acceleration of the system of the Bulgarian side alone has proved to be more effective. It is clear that ES1 and ES12 caused a further shortening of the queue length compared to ES4 and ES11.
When the collective improvement scenarios ES11, ES12 and ES13 were investigated, it was found that ES13 was the best performing scenarios with respect to the number of exiting trucks and the truck queue
10
outside the truck park. In ES13, in which the gas station was removed, the truck park capacity is increased from 250 to 500, the number of registration booths is increased from four to eight while integrating all operations to one booth, and a 24/7 working-hour schedule is implemented.The contribution of this research is the simulation results, as well as the proposed practical framework for the analysis of the design of the border crossings, with similar traffic and cross border patterns. As a further suggestion; a group decision support model can be developed in order to rank the strategies to focus on according to their order of importance in a way to increase the efficiency at the border. For this purpose the above-given scenarios will be taken as alternatives and a Group Decision Support System will be used to evaluate each alternative from the perspective of different shareholders according to different criteria such as waiting time at the border, sustainability, border security, Investment Cost, Operations Cost, Satisfaction of beneficiaries
In order to achieve the best performance at the border crossing, another further suggestion would be to conduct similar analyses at the Kapitan Andreevo border crossing in Bulgaria and to investigate the possibility of collaborative improvements.
Acknowledgments
The authors are grateful to the Kapikule authorities, the Ministry of Customs and Trade, and the International Transporters’ Association (UND) for their support and cooperation in supplying background on the problem, data required for the research, and for specifying the scenarios for evaluation. This support is gratefully acknowledged; nonetheless, it does not imply any endorsement of the findings.
References
[1] Arvis, J.-F., Mustra, M. A., Ojala, L., Shepherd, B., & Saslavsky, D. (2012). Connecting to Compete: Trade Logistics in the Global Economy - The Logistics Performance Index and Its Indicators (Connecting to Complete). Washington, D.C: The World Bank.
[2] Ojala, L., & Rantasila, K. (2012). Measurement of National-Level Logistics Costs and Performance (International Transport Forum Discussion Papers No. 2012/04). Retrieved from http://www.oecd- ilibrary.org/transport/measurement-of-national-level-logistics-costs-and-performance_5k8zvv79pzkk-en
[3] Banister, D., & Berechman, Y. (2001). Transport investment and the promotion of economic growth. Journal of Transport Geography, 9(3), 209–218. https://doi.org/10.1016/S0966-6923(01)00013-8 [4] Berechman, J., Ozmen, D., & Ozbay, K. (2006). Empirical analysis of transportation investment and
economic development at state, county and municipality levels. Transportation, 33(6), 537–551. https://doi.org/10.1007/s11116-006-7472-6
[5] Gunasekaran, A., Lai, K., & Edwincheng, T. (2008). Responsive supply chain: A competitive strategy in a networked economy☆. Omega, 36(4), 549–564. https://doi.org/10.1016/j.omega.2006.12.002 [6] Hooi Lean, H., Huang, W., & Hong, J. (2014). Logistics and economic development: Experience from
China. Transport Policy, 32, 96–104. https://doi.org/10.1016/j.tranpol.2014.01.003
[7] Figueroa, A., Lee, E., & Van Schoik, R. (2013). Realizing the Full Value of Crossborder Trade with Mexico. Arizona State University, North American Center for Transborder Studies. Retrieved from https://www.azmc.org/wp-content/uploads/2013/07/Realizing-the-Value-of-Crossborder-Trade-with-Mexico-report.pdf
11
[8]
Swain, J. J. (2013, October). Simulation Software Survey - Simulation: a better reality? INFORMSOR/MS Today, 40(5), 49–59