A NEURAL-STATISTICAL MODELING APPROACH FOR KEYSTROKE RECOGNITION ALGORITHMS M.S. THESIS Özlem GÜVEN 200291003 ADVISOR Prof. Dr. Mithat UYSAL
JANUARY-2006 Istanbul
The main problem of the computer and information systems is the security, which is to
protect the system from the attacks of imposter or unauthorized users. In order to supply
better security, it must be determined clearly while system access that if the claimed one
is authorized user known by the system or not.
Recently, biometric security systems technology is developed and added to the typical
authentication systems, which are consist of username and PIN or password query,
aiming to get higher security in system access.
The keystroke pattern recognition system is chosen as one of the biometric security
system and proposed to perform a classification in this thesis. In order to achieve this, a
perspective is developed under the knowledge of the classification algorithms used earlier
in keystroke pattern recognition systems. According to this, a model is designed which
uses hybrid combination of two different algorithms. One of them is the statistical
algorithm which is the very firstly used one in pattern recognition and the other one is the
neural networks. In the model, the statistical algorithm formulations are embedded into
the neural network architecture. Designed algorithm model is described in detail and
tested with sample user datasets and performance results are presented.
When thinking about need of new approaches in the classification algorithms in
keystroke pattern recognition, this study can be a starting point to further enhancements
with its perspective on the subject.
Bilgisayar ve bilgi sistemlerinin ana problemi olan güvenlik, sistemi yetkisiz ve kötü
niyetli kimselerin saldirilarindan korumaktir. Iyi bir güvenlik seviyesi saglayabilmek için,
sisteme girmeye çalisanlarin sistem tarafindan yetkilendirilmis kullanici olup
olmadiklarindan kesinlikle emin olunmalidir.
Son zamanlarda, biyometrik güvenlik sistemleri teknolojisi gelistirilmis ve tipik yetki
sorgulama sistemleri olan kullanici ve PIN veya sifre sorgulama sistemlerine ek olarak
daha yüksek bir güvenlik saglamak amaciyla kullanilmaya baslanmistir.
Bu tez çalismasinda, biyometrik güvenlik sistemlerinden yazma ritmi tanima sistemleri
seçildi ve siniflandirma algoritmalari uygulanmaya çalisildi. Bunu basarabilmek için
yazma ritmi tanima sistemlerinde, önceleri kullanilmis olan siniflandirma
algoritmalarinin bilgisi altinda yeni bir perspektif gelistirildi. Buna göre iki farkli
siniflandirma algoritmasi kullanan hibrid bir model dizayn edildi. Algoritmalardan bir
tanesi bu alanda kullanilan ilk siniflandirma algoritmalarindan olan istatistiksel algoritma,
digeri ise yapay sinir aglaridir. Model, istatistiksel algoritma formülleri yapay sinirsel ag
yapisi üzerine gömülerek elde edilmistir. Dizayn edilen modelin algoritmasi ayrintilariyla
verilmis ve örnek kullanici girdileriyle test edilerek sonuçlar açiklanmistir.
Yazma ritmi tanima biyometrik güvenlik sistemlerindeki siniflandirma algoritmalarina
yeni yaklasimlarin ihtiyaci düsünülürek yapilan bu çalisma getirdigi perspektif ile daha
ileri düzeydeki çalismalar için bir baslangiç noktasi olabilir.
1. INTRODUCTION
Today’s fast developing computer-based technology forces us to carry plenty of smart cards with PIN’s (Personal Identity Number s), to memorize many user -id and password pairs for computer network access, e-mail accounts, internet access, bank ATM’s and even internet banking for each bank.
Ownership -based security systems like smart cards, magnetic stripe cards, and photo ID cards are physical keys. They can be lost, stolen, duplicated or left at home. On the other hand knowledge -based security systems usually use one user-id and password pair, which can be forgotten, shared or observed by someone else with bad intentions.
In this difficult predicament of computer-based systems security, an increasingly helpful technology is biometric-based security. Biometric systems are developed to verify and recognize the identity of a living person on the basis of physiological characteristics like retina, iris, fingerprint, facial and hand geometry or behavioral characteristics like handwriting, sig nature, voice and keystroke dynamics.
Biometric devices are engineered and developed keeping in mind user needs. Design of the interfaces is enhanced for ease of operation since they are used every day; for instance identification and verification steps should not take too much of the user’s time and be simple to use. In daily life, people in most cases prefer usage of these techniques to memorizing pins or passwords, in most cases.
Biometric methods have been widely used in forensics, such as criminal identification and prison security, and have the potential to be used for a large range of civilian applications.
Biometric security systems technology has evolved to incorporate prevention of unauthorized access toATMs, cellular phones, smart cards, desktop PCs, workstations and computer networks. The systems can be used alone for recognition of an individual’s identity without any extra things like smart cards and passwords, or they can be used as extra systems aiming at verification of identity. Also they can be used during transactions
conducted by telephone and internet (electronic commerce and electronic banking). In automobiles biometrics is about to replace keys with keyless entry devices.
The purpose of this thesis is to develop a new approach to the area of keystroke pattern recognition systems with a statistical modeling algorithm embedded into neural network architecture.
The content of the first chapter in the thesis is a brief introduction. B iometric security systems are categorized as being dependent on behavioral or physiological features of human beings. These features are explained and their different aspects compared with each other in chapter two. The third chapter is an explanation of keystroke pattern recognition system s in detail. The standard architecture and classification methods of keystroke pattern recognition systems are described and the literature search results are stated. The neural-statistical modeling approach to keystroke biometric systems which is the main subject of our study is described and the results are presented in chapter four. The fifth chapter is conclusion including with proposal for future work.
2 . BIOMETRIC SECURITY SYSTEMS
Biometric security systems are developed based on the physiological and behavioral features of human beings. Physiological and behavioral features of individuals are accepted as unique, cannot be used by someone else, and unchangeable.
Iris, retina, face, fingerprint and hand geometry pattern recognition techniques are dependent on the physiological characteristics of a human. Behavioral characteristics are traits that are acquired or learned by a person during his life, individually. Voice, signature , handwriting and keystroke pattern recognitions rely on behavioral characteristics.
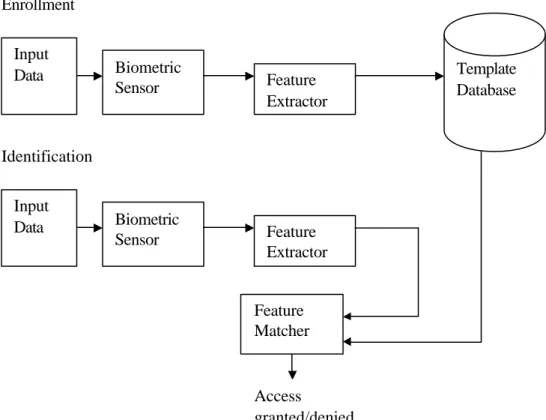
Biometric security system configurations change according to the chosen biometric feature, but there are some basic procedural functions that every system must include (Mroczkowski, 2004). The s o called system architecture is shown in Figure 2. 1.
Figure 2.1 Biometric s ecurity system architecture
Biometric Sensor Input Data Feature Extractor Template Database Input Data Biometric Sensor Feature Extractor Feature Matcher Access granted/denied Enrollment Identification
In figure 2.1 two basic phases can be seen clearly , one of them called enrollment and the other one identification. The enrollment phase takes some pattern datasets with the help of the system’s own biometric sensor as input, and then generates reference parameters as output, with the help of feature extractor function, to be kept in template database. In the case of the identification phase the input data is the one that needs to be recognized. In this phase the feature matcher function takes referenced parameters for each user from the template database and then a decision is made according to the classification algorithm used by the system.
2.1. The Types of Biometric Security Systems
Biometric security systems can be grouped into 8 categories depending on the biometric features that they use. These are explained below.
2.1.1. Iris Pattern Recognition
The iris is the colored part of the eye, surrounding the pupil, regulating the amount of light allowed into the eye. The pattern of each iris can be different in the eyes of one person.
To take the iris pattern, a black-and-white camera is used from 10 - 40 centimeters away so that the iris pattern does not rely on iris color. Only being motionless is required, and there is no need for any kind of illuminator during the operation.
This method can be used on real-life, while users were wearing colored lenses, glasses or non-reflective sunglasses (www.securitydocs.com). As there is no difficulty on usage on user’s part the system is practical and useful. The iris pattern does not change in time, unless affected by a special illness.
After scanning the unique random patterns of the iris, the system software makes cle ar the characteristics of the curves in it. Comparison methods are used at the decision stage . Comparing each data in a huge database containing 4.000.000 iris codes is done very fast by modern computers. So we can say that iris recognition technology is very fast relative to
other biometric pattern recognition systems. The reliability of it is quite high. The probability of two people having the same iris code is 10-52 (Cho et al., 1999).
2.1.2. Retinal Pattern Recognition
The retinal pattern is a kind of map formed by the vein network, beneath the retina surface in the eye. The retina scanning process is older than the iris scanning process.
The retinal pattern can not be seen without an illuminator. A digital map of the retinal pattern is obtained by projecting a low -intensity or infrared light into the eye (Jain et al., 2000). During this process the user has to focus on a given point without moving her eyes.
The digital image of the vein network in the retinal surface is analyzed in order to obtain characteristic points. Since the retinal surface is much more durable than the iris surface in terms of illness, characteristic features of it do not change. Because of this, usage of this biometric pattern recognition system is suitable for high-security access.
The retinal pattern recognition method is not user friendly and has high cost requirements at the data collecting stage.
2.1.3. Facial Pattern Recognition
People know each other in society using a natural face recognition biometric system. We implement this technique in our lives through our eyes instead of cameras.
Face recognition can be done in two ways as an identification method of the authentic user. One of them is to figure out the image of the face using ordinary cameras, the other one is to figure out the facial heat emission by using infrared cameras.
Face image recognition depends on how eye, nose, chin and lips are located on the face and their special relationships. There are several approaches to modeling facial images in
the visible spectrum such as principle component analysis, local feature analyses , neural networks , elastic graph theory and multi-resolution analysis (Dugelay et al., 2002).
One approach to finding a face metric is done by measuring the distance between the elements located in the face , like eye s, eyebrow s, chin and lips. Afterwards, one tries to obtain a mathematical expression for each face image, using the distance between eye s, the distance between the nose and mouth etc .
Another approach is the Eigenfaces Method, which is quite new and at the beginning stage of evolution in recent years. In this method the face image is divided into 150 pieces. Some 40 of them are chosen as carrying characteristic features and afterwards these pieces are used to discrimina te the user’s face image.
All these techniques have difficulties discriminating twins and similar-looking people. In addition, imposter users can mislead the system by changing their faces through plastic surgery.
Recently, the vasc ular system of the human face has been claimed to be unique in each individual and it has several advantages over face image recognition techniques. Using infrared cameras this face recognition technique can also increase reliability, because the thermogram of the face is measured. However the face thermogram may change depending on different factors such as the emotional state of the subjects or the body temperatures (Jain et al., 2000).
2.1.4. Voice Recognition
Voice recognition systems use acoustic features, derived from the speech spectrum in order
to discriminate different speakers. Acoustic patterns inform the system about anatomy (size and shape of the throat and mouth) and learned behavioral patterns (e.g., voice pitches,
speaking style) of the speech owner.
Voice recognition systems are mainly divided into three categories based on text used. These are
-text dependent,
-text prompted,
-text independent,
The first two methods are easy to use but, insecure. The last one discriminate s the identit y of the speaker irrespective of the text that speaker saying, but has difficulties over text-dependent methods in implementation. This method is more secure than the others.
Voice recognition systems do not require expensive infra-structure, except for large space for template storage. On the other hand, the system is negatively affected by local acoustics, network and background noise, microphone quality and the emotional state of the human body. Voice recognition is recommended for systems used by ordinary users where no high security is intended.
2.1.5. Fingerprint Recognition
A fingerprint is the pattern of ridges and furrow s on the surface of a fingertip . These patterns are unique and permanent. Identical twins have different fingerprints, and for the same person fingerprints are different from hand to hand and from finger to finger (Dugelay et a l., 2002).
Fingerpr int recognition methods are the best known and widely used ones to discriminate individuals. People have been aware of the differential features of fingerprints for hundreds of years. The history of this method is older than computer technology history. The first fingerprint method was used in China by authors, in order to sign articles written by them. The system was used in India by the police department assigned by the English government to discriminate prisoners in the early 1800’s. The system was called the Henry methods.
Fingerprint patterns can be taken using ink and paper or the live-scan method. In the former, the fingertip is wet in a little ink, afterwards rolled on a paper that can be scanned. The patterns can also be taken easily using the live-scan method without any paper or ink. The only ne cessary equipment is an optical, thermal or electromagnetic scanner.
The system ’s reliability changes depending on the situation of the fingertip, such as it being cut, injured or wet.
2.1.6. Hand Geometry Recognition
Hand geometry recognition systems depend on the characteristics of the person’s hands and fingers, whose shapes do not change in time. A hand geometry recognition system takes the length and weight of the fingers and, the size and specific lines of the hand as the parameters of the pattern. There are many methods for taking patterns; the ones mainly used are optical and mechanical.
Hand geometry is commonly used in physical access control in commercial and residential applications in time and attendance systems. It is not currently in wide deployment for computer security applications; primarily because it requires a large scanner. It can be said that because of the low accuracy of these kinds of systems, they can be used in general personal authentication applications.
2.1.7. Signature Recognition
Signatures have been used by people on their own handwritten texts as an identifier since ancient times. A signature is accepted for verification of identity.
The signature recognition technique, used nowadays , is based on measurin g the dynamics of the signature during the act of signing, instead of comparing the signature with the one in storage, such as done before. The system's three-dimensional dynamic signature
verification examines the changes in speed, style, pressure and timing that are unique to an individual, and are accepted as impossible to duplicate.
This handwriting system has already been used to restrict access to computers, and it is used on handheld PDA’s too. The only things needed are some special tablets and special pens (it is also possible to use fingers for particular tablets) as access tools. It can be difficult for a user to sign the same signature as in usual life, while using special pens or table ts.
The major advantage of this technique is that it is not possible to obtain the characteristics of sig ning by looking at the signature. Another advantage is that the acceptance among users for this method is at a very high level.
The system can be designed to learn the natural changes of a signature over time, and accommodates the usual slight variations in a handwritten signature.
Since the system captures all the dynamics of each signature, fraud is possible only in the case of the behavioral characteristic dynamics of the signature being learned by someone else.
An important area for this technology has been e-business applications, where a signature is an accepted method for personal authentication.
2.1.8. Keystroke Pattern Recognition
Keystroke pattern recognition systems deal with how individuals type or press keys on a keyboard. Of course the importance of a typed password or text changes, depending on the designed architecture of the keystroke recognition system as a biometric security system.
The idea behind keystroke dynamic technology originated from the early recognition that telegraph operators could be reliably identified by the unique rhythm, pace and syncopation with which they employed the telegraph key (www.biopassword.com).
Nowadays keystroke pattern recognition systems are one of the most popular systems in the computer security area due to the cost efficiency relative to other biometric security systems. This is because the only needed things are well designed software for keystroke pattern recognition, a pc and an ordinary keyboard.
2.2. The Data Storage Aspect of Biometric Systems
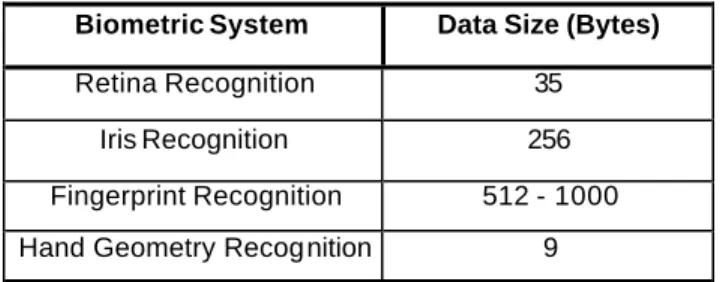
A major factor in choosing a kind of biometric system is data size. The data size affects the capacity of the storage system where the biometric identity pattern is kept. Below Table 2.1 gives information about data size for several biometric systems (Güven and Sogukpinar, 2000).
Table 2.1 Data size required for each unit of various biometric systems
Biometric System Data Size (Bytes)
Retina Recognition 35
Iris Recognition 256
Fingerprint Recognition 512 - 1000 Hand Geometry Recognition 9
The storage capacity used in a biometric system device changes according to the data size. At the same time, data size per biometric unit differs depending on the preferred biometric method. If fingerprint recognition and hand geometry recognition database requirements are compared, it is clear that almost 57 times larger data storage is required for a fingerprint pattern than a hand geometry pattern. So this makes a biometric security system designer think about storage cost when choosing the biometric method, because for a bigger database, the system needs additional storage devic es. Also bigger data size has other disadvantage s like causing overload on computer network traffic.
In Table 2.1 it can be seen that hand geometry and retina l pattern recognition systems require less database capacity than other biometric systems.
2.3. FAR and FRR Performance Measurement Factors of Biometric Systems
The performance of an identity authentication system is measured by means of two rates of error. One is the ratio of rejected authorized user s by the system , called the False Rejection Rate (FRR). The other one measures in case of imposter users accepted by the system and is called the False Acceptance Rate (FAR).
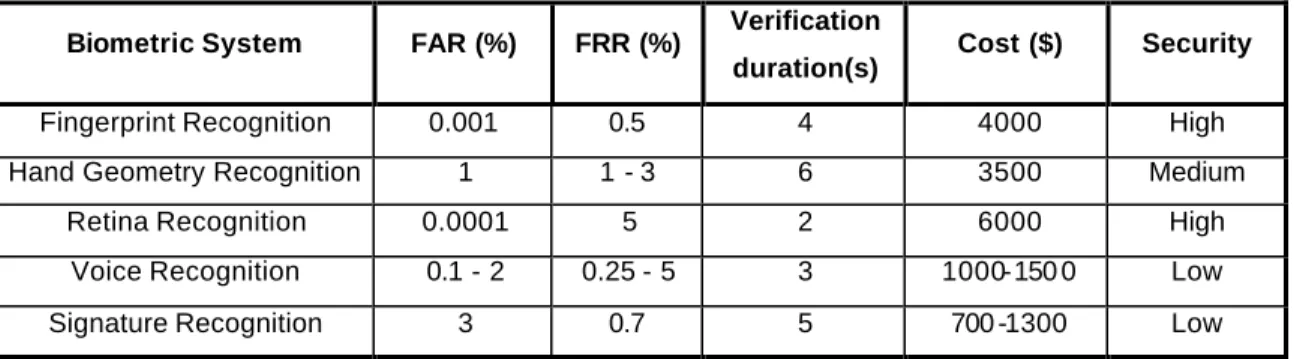
Naturally, it is demanded that these two kinds of error rates be as small as possible but they are inversely proportional. In the verification of user phase, the FAR and FRR degrees change so that while one of them increases , the other one decreases, according to the threshold value. The table below shows a comparison of different biometric systems with respect to FAR, FRR, verification duration, cost, and reliability (Cho et al., 1999).
Table 2.2 Comparison of biometric systems based on FAR, FRR, verification durations, cost and security
Biometric System FAR (%) FRR (%) Verification
duration(s) Cost ($) Security
Fingerprint Recognition 0.001 0.5 4 4000 High
Hand Geometry Recognition 1 1 - 3 6 3500 Medium
Retina Recognition 0.0001 5 2 6000 High
Voice Recognition 0.1 - 2 0.25 - 5 3 1000-150 0 Low
Signature Recognition 3 0.7 5 700 -1300 Low
As seen in Table 2.2, the retina recognition system has high reliability with the smallest FAR rate although it has the highest cost requirement in -between the others.
3. KEYSTROKE PATTERN RECOGNITION SYSTEM S
A keystroke dynamics biometric system analyzes the way a user types at a terminal by monitoring the keyboard events. Identification is based on typing rhythm patterns which are considered to be a good sign of identity.
Observation of te legraph operators in the 19th century revealed personally distinctive patterns when keying messages over telegraph lines, and telegraph operators could recognize each other based only on their typing dynamics. Conceptually , the closest correspondence to ot her biometric identification systems is signature recognition. In both signature recognition and keystroke dynamics the person is identified by their writing/typing dynamics which are assumed to be unique to a large degree among different people. Keystroke dynamics is known by a few different names: keyboard dynamics, keystroke analysis, typing biometrics and typing rhythms (Obaidat and Sadoun, 1997), (Miller, 1994).
Keystroke dynamics include s several different measurements which can be detected when the user presses keys on the keyboard. Possible measurements include:
• Latency between consecutive keystrokes, • Duration of the keystroke, hold time , • Overall typing speed,
• Frequency errors (how often the user has to use the backspace),
• The habit of using additional keys in the keyboard, for example writing numbers with the numpad,
• In what order does the user press keys when writing capital letters; is shift or the letter key released first,
• The force used when hitting keys while typing (requires a specia l keyboard).
Systems do not necessarily employ all of these features. Most applications measure only latencies between consecutive keystrokes or duration of keystrokes (Ilonen, 2003).
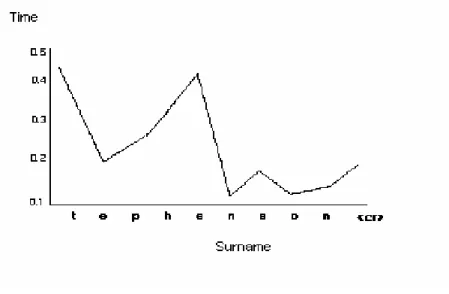
There are different experimental studies on the subject, among of the m one done by Rick Joyce and Gophal Gupta, in 1990. In their research a user is required to write his surname and the timing is measured during writing on the keyboard.
Stephenson
is the surname of the user, and a graph is drawn of the durations.Figure 3.1 Keystroke writing pattern graph belonged to Stephenson word
Figure 3.1 gives us some information about the user’s keystroke dynamics. The user can pass quickly between letters the “n” and “s” or “s” and “o” in spite of losing more time between the letters “t” and “e”.
Rick Joyce and Gophal Gupta tried to figure out typing rhythms of users from the durations between two consecutive characters (Joyce and Gupta, 1990). Actually this is the most used parameter by researchers in this area.
The difference of this study from the ones before is that in addition to determining the durations of passing from one character to another, the timing of hitting each character is determined. Collected keystroke hold durations are used in order to strengthen the a lgorithm in their study.
The biometric methods explained before require specific equipment in order to collect biometric data for use in the decision algorithm. The biggest advantage of the keystroke dynamics biometric system is that there is no need for any specific equipment in the implementation phase. When designing a biometric system using keystroke dynamics, the only equipment needed is normal PC hardware. Because of this reason, latencies between keystrokes and durations of keystrokes are popular measurements in the biometric systems area.
Both key press and release events generate hardware interrupts. Gathering keystroke dynamics data has however a few complications. Several keys can be pressed at the same time – a user presses the next key before releasing the previous one – and this happe ns quite often when typing fast. Depending on what is being measured, there might even be negative time between releasing a key and pressing the next. It also increases the complexity of keystroke dynamics slightly if it is desired to know n when the user presses SHIFT, ALT and other special keys (Lau et al., 1990).
Another challenge is that there is a very wide variety of typing skills, and the biometric systems should work for all users. First of all, the speed of typing can be widely different between different users. An experienced touch-typist writes easily several tens of times faster than a beginner using a “hunt-and-peck” style with one finger. Also the predictability of a fast writer is much greater – there is no need to stop and think where some le tter is located on the keyboard. The typing can also be affected if the user is on a lower level of alertness, for example sleepy or ill. Additionally, sometimes users have accidents and
consequently write in an abnormal fashion for a few weeks when a finger is bandaged, or type with one hand when holding a cup of tea in the other hand, and so on. Changing keyboards to a different model or using a laptop computer instead of a normal PC can also affect keystroke dynamics tremendously. All these factors have to be taken into account when designing a keystroke dynamics system (Ilonen, 2003)
3.1. User Verification and Identification
Keystroke analysis systems can be used for both verification and identification. They have clearly different applications:
Verificat ion: Access to computer systems is mainly controlled by user accounts;
usernames and passwords. If someone knows a username together with the password, one can access the computer system. Passwords are often quite easy to guess. They may have direct connection to the person the account belongs to (birthday, name of member or pet, and so on), they may be normal dictionary words which are easily guessed by trying all of them, or the password might actually be written on a post-it note attached to somewhere near computer. So, there is a clear need for strengthening passwor d-based authentication. Keystroke dynamics is a sensible choice because a normal username/password scheme can be easily extended to use also keystroke dynamics and there is no need for additional hardware (Obaidat and Sadoun, 1997).
Identification: In the case of keystroke dynamics identification means that the user has to
be identified without additional information besides measuring his keystroke dynamics. A short predefined text could be used for identification, i.e., profiles of all the users typing a certain text are stored and later the user is identified when the same text is written again. However, this kind of identification would not offer any advantages over a verification system where all the users write a different text (username and password). The user has to write some predefined text to be identified, so why not use different texts known only for individual users (passwords) and change the harder identification task to a more straightforward verification task?
So, identification in this case is mainly useful for constant monitoring. Identification w ith keystroke dynamics is implemented by using a background task for collecting keystr oke dynamics profile of the user’s typing. Such a system is not limited to short texts, but on the other hand there is no possibility of using only some predefined texts, for identification. Thus, more general keyboard dynamics statistics have to be gathered. For example latencies between keys in all different key-pairs can be gathered-what is the average latency between “a” and “s” when the user writes “as” and so on for all key-pairs (Ilonen, 2003).
3.2. Standard Architecture of a Keystroke Dynamics Biometric System
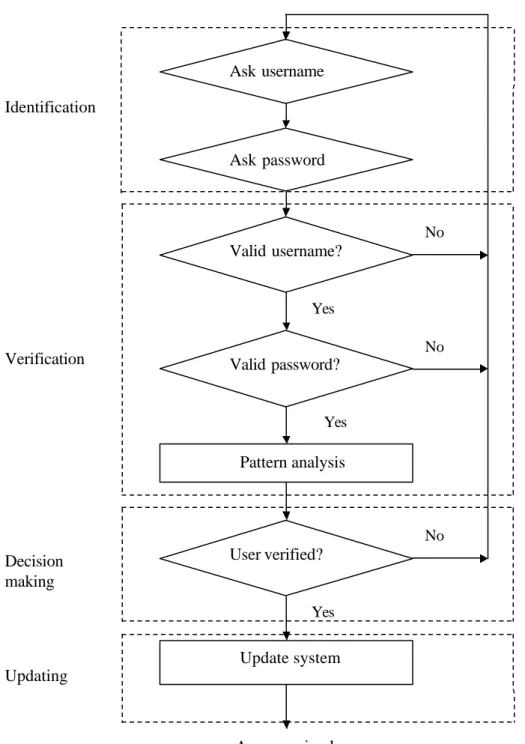
While every biometric device and system has its own structure and operating methodology, there are some general rules of thumb that can be expected and found in any system. The steps of a standard keystroke dynamics system design are listed below. These steps are the main structure of the block diagram shown as dotted areas , in Figure 3.2.
1. Identification 2. Verification 3. Decision Making 4. Updating
The keystroke dynamics system’s steps given above are executed in hierarchical order , from top to bottom . Operational steps work directly with each other. Each operational step takes needed parameters from the result of the previous step and so on. The parameters have to be right for the proper working of the system. In the case of any disorganization between steps, the system halts or gives false results. The decision making operation can be specialized to increase security performance if needed. Flexibility in the decision making operation is the responsibility of the person charged with security or the manager.
Figure 3.2 Standard authentication procedu res, dotted areas are mainframe
3.2.1. Identification
The first step, which is the most important step in the system, can be called a parameter sensor. This one is the very first contact point of the system for users who are either
Yes User verified? Pattern analysis Update system Access gained No Valid username? Valid password? Ask username Ask password Yes Yes No No Identification Decision making Updating Verification
authenticated or imposter. Here is the point for querying the username and password parameters. When there is an entrance , the system starts to work. The operational function of this step is to keep data and to record pattern data composed during the entering of parameters by the user. Afterwards recorded parameters of the claimed user are sent to the next step as a result of the identification step.
3.2.2. Verification
In the verification step, parameters which are taken from identification are compared to the template ones. The first operation done here is to find out if the claimed username is defined in the database. When the result is positive, password control is done to find out if the password is the same as in the database. Afterwards, if there is no problem, comparison of the biometric parameters starts. Referenced biometric data is taken from the database and tested to see if it is compatible with the claimed user’s according to the chosen algorithm. New parameters are obtained at the end of this operational stage. These new parameters will be most important for the decision making step.
3.2.3. Decision Making Step
Parameters obtained as the result of the verification step are accepted into the algorithm of the Decision Making stage. There could be 2 different states the system can be in. Respectively they are:
1- High-Medium-Low Level Security
2- System Halted
3.2.3.1. High-Medium-Low Level Security: The security state can be adjusted to
different levels; generally these are high, medium, and low levels. The system accepts the user according to threshold from referenced values depending on the system designer’s choice.
3.2.3.2. System Halted: This option is used in the case of the system closing for any
reason according to the system design.
3 .2.3.3. Updating
Keystroke dynamics recognition systems can be de signed dynamic. In this case the updating function is operational in the form of an update system. This kind of system design is called a learning biometric system. Learning occurs for example when updating referenced values in the system w ith the last authorized user’s biometric pattern data. Afterwards, when the same user wants to enter the system again, this time the system uses the last modified referenced data. So, the dynamic system has the ability to follow up users’ evolution in time. Biometric systems’ biggest problem is dealing with changes happening to users’ biologically chosen metrics. A learning system design is one solution to that problem in keystroke dynamics pattern recognition systems (Capuano et al., 1999).
3.3. The Previous Works in User Recognition Systems by the Keystroke Rhythm
Studies in the subject started in the 2. World War, the aim was to recognize telegraphers who were using Morse code. During those days, it was realized that a telegrapher w ho was sending telegraphs in Morse code had an individual and unique rhythm.
The first studies improving the theory that everyone has a unique keystroke rhythm took place at the end of the 70’s. In the year 1980, R. Stockton Gaines, William Lisowski, S. James Press, and Norman Shapiro, who were working under the sponsorship of the Rand Corporation, used 7 secretaries to type 3 separate texts on one page (Gaines et al., 1980) . Four months later the same secretaries were asked to type the same texts. The first text was ordinary English, the second text was random English words , and the third one was randomly chosen English phrases. In this study the period between character couples (diagraphs) that were in limited quantity as well as those that were repeated more than ten times was measured. The T-Test statistical method was used with the idea that diagraph time averages and the variances were the same. Although the experimental studies were encouraging, since the number of secretaries was limited to seven and as it has taken
longer time for the users to introduce themselves to the system, unfortunately, system couldn’t be successfully applicable in the result.
In the year 1988, Saleh Bleha prepared PhD thesis in a related subject. In 1989, Bassam H., Maclaren R., and Bleha S., worked in the same field to add a different dimension to the same thesis (Bassam, et al., 1989). In this study Minimum-Distance and Bayes classification algorithms are used. Two types of password are used in the basis of personal names and some special phrase. The phrase was used in the identification and personal names were used in the verification and general recognition system. Ten volunteers were used in tests, in the identification phase %1.2 failed. 26 volunteer s were used in the verification phase with result of %8.1 FAR and %2.8 FRR. Among 32 volunteers, the phase of the general recognition system result of %3.1 FAR and %0.5 FRR were taken. In this study in the identification phase, password length, password type (personal names and phrases), data quantity needed for the reference pattern and decrease of the pattern dimensions were the topic . In the verification phase, sufficient threshold level effects are observed in the classification algorithm. It was seen that personal names were more easily recognized than phrases. In a definite result, if there are many data entries in the system and if the password length is long under these conditions the error ratio is smaller. For instance Bayes classification had a %30 smaller error ratio than minimum distance classification when using short passwords. Another strange result of this study is as follows. If the users enter the same dataset twice the shortest passwor d gives better results when compared to average values (Shuffling Procedure).
In the year s 1985-1991 similar studies were undertaken by Glen Williams, John Leggett, David Umphress together with 17 other computer programmers. T he result of these studies reported as 5.5% FAR and 5% FRR. At the end of their work, the users who had %60 similarity between the reference pattern and the test pattern and also the ones who were within 0,5 standard deviations of the average diagraph were given permission to enter into the system. But just same as in former experiments, users had to introduce themselves to the system. Because of this reason more than 1000 wor ds had to be written. Since the FRR was so high, this did not allow the system to be used practically. In addition, another method had to be used in these studies to reject the unauthorized users. For the users who
were defined in the system a unique 500ms low permeable time filter was used (Yalçin and Sogukpinar, 2002) .
In the mid 1980’s, J. Garcia, J. Young, and R. Hammon made studies. Garcia used the covariance matrix reference of time latency vectors between consecutive keystrokes as the measure for approving users (Garcia, 1986) (Young and Hammon, 1989). Afterwards, to show the similarity between the reference pattern and the test pattern, Mahala nobis Distance function was used by Garcia in his study. Young and Hammon used the Euclidean Distance Measurement Technique on a few specification vectors like the pressures on the keys and the duration to write down a certain number of words. In 1986 and 1989, the se two studies led to a patent. That is the reason why at the present there are no datasets describing the perform ance of these systems.
A step forward in keystroke rhythm recognition studies was taken in 1990 by Rick Joyce and Gupta Goyal (Joyce and Gupta, 1990). T heir approaches to the topic were simple but very effective. The positive consequences were apparent. The system was designe d on the basis of users being recognized during the system entrance. The users were requested to enter their names, surnames, user ID’s and passwords 8 times into the system. The average reference vector was determined; later on the reference pattern and system entrance patterns are compared. If the difference was below a certain threshold level, the user was permitted to enter into the system. FAR ratios of 0.25% and FRR ratios of 16. 36% were obtained.
In 1990 Saleh Bleha, Bassam Hussein, and Charles Sliv insky, in 1993 Marcus Brown and Samuel Joe Rogers, 1996 Thomas J. Alexandre, in 1999 Sungzoon Cho, Chigeun Han, Dae Hee Han, Hyun_II Kim (I) used an artificial neural network approach to recognize users and to distinguish them (Bleha et al., 1989) , (Brown and Rogers, 1993), (Alexandre, 1996), (Cho et al., 1999). For small databases with the backpropagation algorithm good results were obtained, but as the user recognition phase of the system had to be repeated for every new user introduction, especially in systems that were the target of communication cont rol, this system have been so expensive and there was a waste of time. However the process of separating the database into small pieces was applied in order to solve the systems finding
out problem, it has taken too long time for the system to manage to find out once again as the training stage. So that is the reason why this could not be applied in the proper way.
In 1993, in the study of Gentner, it was observed that experienced employees who were using ke yboards in writing did the score of 96ms for average key transition time, while inexperienced employees had a score of 825ms (Gentner, 1993). Because of this reason a 500ms low enterance time filter was used by Glen Williams, John Leggett and David Umphress, which accepted people who were experienced in using keyboards and rejected the rest. It was determined that there were improvements in the approval phase when measuring the character couples keystroke transition time with the filter in place.
In 1997, as an addition to the above-mentioned keystroke transition times theory, Fabian Monrose and Aviel Rubin studied keystroke hold times (Monrose and Rubin, 1997). Along with personal names and phrases, they used freestyle texts. They formed a sample group consisting of different nationalities, cultures and educations. The people were grouped according to their speed in writing. They passed through tests using E uclidean distance measurement, non-weighted probability, weighted probability, and Bayes classification algorithms. The users could be recognized with ratios of 83.22%, 85.63%, 87.18% and 92.14% . In the non-weighted probability algorithm, the hypothesis that the dispersion is similar to a normal dispersion and the nearest neighbor algorithm is used as well. In the weighted probability algorithm, features of the English language were taken into consideration. It was observed that “th”, “cr”, “re” character couples are used more often than “qu”, “ts” character couples, and it was proposed to make measurements taking into account of character couples concentrations. In 1999, Fabian Monrose and Aviel Rubin prepared another article on a related topic (Monrose and Rubin, 1999).
In 1997, another study took place by Dawn Song, Peter Venable, and Adrian P errig (Dawn, et al., 1997). In this study the major difference with previous ones is that the typing rhythm of users was observed continuously, not only during the system entrances. The transition period between two character couples was modeled in by mean values and variance. The users were distinguished in the structure of Markov chain. In the related
article, there is no explanation about the error ratio s of the algorithms and the experimental studies.
In 1999 Fabian Monrose, Michael K. Reiter, and Sus anne Wetzel used polynomials to make typing rhythm recognition more resistant to offline attacks . The main difference in this study is that the keyboard typing rhythm code was used in the coding of the files and in the communication of the VPN. But the users in these tests were in limited quantity and in the experimental studies the different values of the parameters were not observed in detail. T he recognition ratio obtained was 77.1% (Monrose, et al., 1999).
In 2000 Alen Peacock asked users to enter the ir names, surnames and phrases 20 times. Using a modified K Nearest Neighbor rule, 92% of the users could be recognized. In the study carried out on a web database 11 users were tested, and 95 unauthorized e ntrance trials were resulted in 4 passes. So the FRR ratio was 4.2%. The four successful experiments involved the same us er (Peacock, 2000).
In 2000 there was another study by Güven and Sogukpinar ; an algorithm was developed based on measuring vector angles with the idea that the key hold duration 10%, the transition time between the keys 90% are effective (Güven and Sogukpinar, 2000).
The same year Abd Manan Ahmad and Nik Nailah Abdullah studied keystroke pattern classification using neural networks. They designed 2 different neural networks , one of them ADALINE and the other backpropagation. According to their study backpropagation neural network wins over the ADALINE one because it is better in generalization with the ability to classify patterns and it can solve a non-linear problem (Ahmad and Abdullah, 2000).
In the last few years, some studies are done to show that the keystroke typing rhythm can easily be obtained by the hackers. In a related study in the UNIX system, in order to code communication between client and server secure Shell was used in two ways. First the transmitted packets are padded only to an eight-byte boundary, second in interactive mode, every time a key was pressed (except for some meta keys such shift, control, etc…) the
code was sent in a separate IP packet. So the user has seen that the code of 7, 8 characters can be decoded 50 times shorter than by a normal Brute -Force attack. So SSH is not a safety system. In the HMM algorithm, 142 character couples were tested, and the character couples that the user typed were analyzed as to whether he used different/same hands, different/same fingers, numbers or not. The results were showed that the character couples typed with the same hand took a longer time than the character couples typed with different hand. It was thought that reason for this that the different hands have been used parallel. For example in this study, if the duration of a two character couple is more than the 175ms, this couple have been writte n by using single hand. If longer than 300ms, the character couples have been typed by the same hand (Song, et al., 2001).
Although some of the articles which are mentioned in this sec tion have not been obtained till the writing phase of this thesis , they’re given in the references aiming to help researchers who will study on the subject.
3.4. The Main Classification Algorithms Used on Keystroke Pattern Recognition
A biometric system as a kind of pattern or trace recognition system usually depends on the method of comparison of the reference values with the pattern data set obtained after processing with a classification algorithm. The working principle for classical pattern recognit ion can be seen in Figure 3.3.
Figure 3.3 C lassical pattern recognition models
In classical cla ssification systems, rough datasets which need to be identified are turned into meaningful ones. In order to do this, rough data sets are put into an algorithm called a
Rough data Feature Extractor Classifier Class 1, 2 …….n X1 X2 Xn . .
feature extractor. Output data obtained from this algorithm is taken into the classification algorithm in order to decide which class it belongs to. Rough data is taken into the extractor, converted to X values, whic h form a combine d X vector. The classifier algorithm then takes this vector and matches it with a class.
There are many methods used in keystroke dynamic recognition systems. These methods are generated by the help of main approaches. One of them is vector-based one which are as below; (Guven and Sogukpinar, 2000)
• Minimum-Distance Classification (Euclidian) • Mahalanobis Classification
• K Nearest Neighbor Classification (KNN) • YARDS Algorithm
These methods are explained briefly because they are not the main focus of this thesis. Two different statistical-based methods are explained. In Neural-Statistical modeling, the statistical based approach is used.
• Non-weighted Probability Algorithm • Weighted Probability Algorithm
3.4.1. Minimum-Distance Classification (Euclidian)
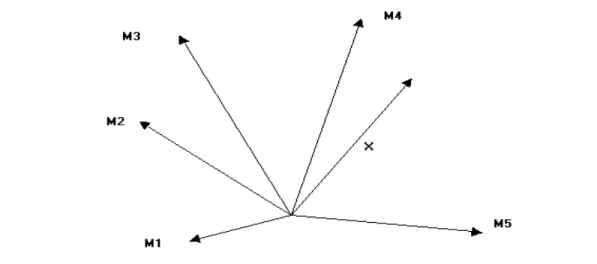
The mathematical description of minimum-distance classification is simple. There are two vectors one is the X vector which is going to be classified and the other one is the M template vector is cleared from noise. Distance vectors are calculated and the classification is done by choosing the smallest one as shown in Figure 3.4 and Figure 3.5.
Figure 3.4 Distance vectors
Figure 3.5 Minimum-distance classification systems
Minimum-distance Algorithm Minimum-distance Algorithm Minimum-distance Algorithm M1 M2 MN X X X Class Items Class
3.4.2. Mahalanobis Classification
The mahalonobis classification method is better and more reliable than the minimum-distance classification method. The metric and classification processes are improved in Mahalonobis classification.
For example let X be a pattern vector. The elements of the X vector can be shown as X(1),X(2),X(3),X(4),….., X(n). Arithmetical mean of these vector elements is,
M=[X(1)+X(2)+X (3) +…..+X (n)] / n (3.1)
M is called a mean block. The variance of the elements is calculated as
V=[(X(1)-M)2+(X(2) -M)2+(X(3)-M)2+…..+(X (n)-M)2]/ (n-1) (3.2)
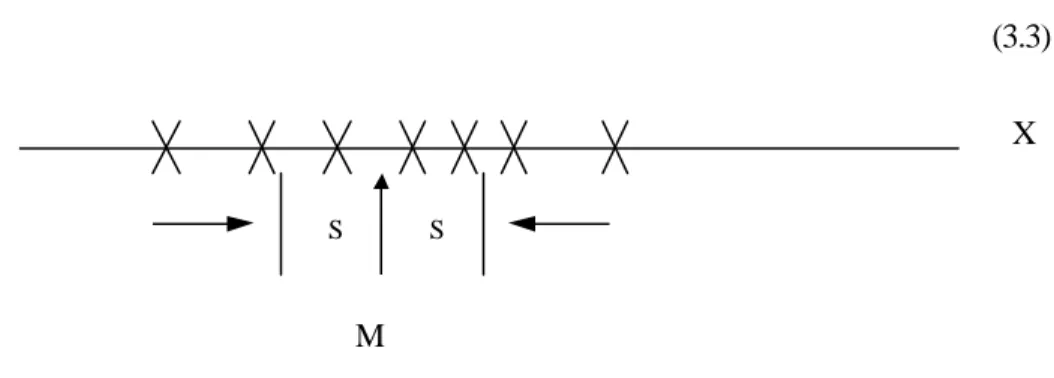
As seen above X and M have the same dimensions, but V is different (the square of X). If V’s square root is calculated then standard deviation can be found.
S=sqrt(V) (3.3)
Figure 3.6 Dispersion of the elements of X
It is clear that, % 68 of the pattern data falls within a range of +s and –s around the M mean block. If the scale is changed to +2s and -2s, then %95 of the pattern data falls within this range as shown in Figure 3.6.
S S
M
3.4.2.1. Covariance Metric
Aiming to get better results on Mahalanobis classification, a helper metric named Covariance is used. Pattern data is converted to a matrix form and a calculation is done. This method provides a better calculation of differences between vectors.
If we take a D dimensional vector, then the Covariance matrix of this vector is defined as below, C(1,1) C(1,2)………..C(1,d) C(2,1) C(2,2)………..C(2,d)
. . .
. . .
. . .
. . .
C(d,1)C(d.2)………..C(d,d) (3.4)In the expression y = Ax, the A matrix takes the x vector into the y vector. These kinds of matrices are called conversion matrices.
When calculating the distance between points x and y in vector space, the following equation is used.
r2=[(x-m)/s]2=(x-m)(1/s2)(x-m) (3.5)
3.4.2.2. Mahalanobis Metric
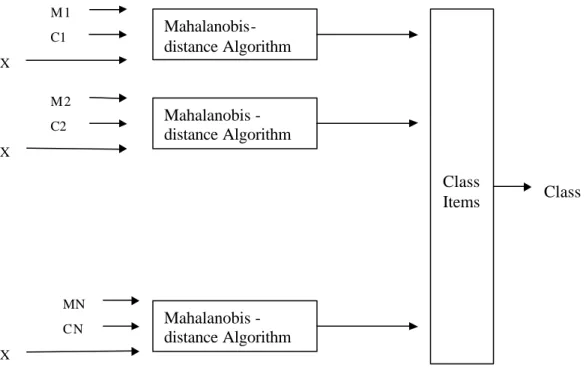
The covariance matrix is used in the Mahalanobis metric. The mahalanobis distance between two points is expressed in the equation below.
Figure 3.7 Mahalanobis classification
M values are the master (reference) values. X values are values belonging to the pattern vector. C1, C2, C3, C4… CN stand for values of the covariance matrix. The metric is obtained after putting these values into the algorithm (www.cs.princeton.edu).
The advantages of Mahalanobis classification over Minimum-distance Classification are:
• It automatically accounts for the scaling of the coordinate axes , • It corrects for correlation between the different features, • It can provide curved as well as linear decision boundaries
Mahalanobis-distance Algorithm Mahalanobis -distance Algorithm Mahalanobis -distance Algorithm M 1 M 2 MN X X X Class Items C1 C2 CN Class
3.4.3. KNN Classification
One of the other classification methods is the K Nearest Neighborhood method. This method‘s theory is very simple and it is based on the assumption that examples located closer in instance space belong to the same class. Thus, while classifying an unclassified X example, the effects of the k nearest neighbors of the example are considered. It yields accurate results in most cases but takes a long time to classify an instance, proportional to the product of the number of features and the number of training instances (www.vias.org).
Figure 3 .8 Example of K Nearest Neighbor Dispersion
3.4.4. YARDS Algorithm
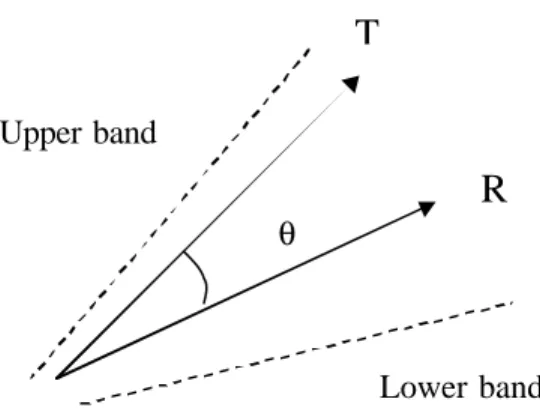
Yards is an algorithm developed by using a vector approa ch to keystroke pattern recognition. This algorithm uses the angle difference between template and real time vector s. If the difference is in between certain error levels, the algorithm matc hes the vector. A A A A A A A B B B B B X A
Figure 3.9 T and R vectors with angle ? .
Let T and R are be N dimensional vectors. Then angle between them θ is given by
Cos θ = T·R / [(ΣT2)+( ΣR2)] ½ (3.7) For identical vectors T=R we have Cosθ =1,
so then for two vectors which are quite similar to each other:
T ˜ R , Cosθ ˜ 1 (3.8) and for two vectors which are quite different from each other:
T ? R , Cosθ ˜ 0 (3.9) Yards is an algorithm which deals with and analyzes the value of angles, unlike other vector methods, which use the magnitude of vectors.
Magnitude s of N dimensional vectors are not important in this algorithm. Orientation is much more important for decision making (Güven and Sogukpinar, 2003).
θ
R
T
Upper band
3.4.5. Non-Weighted Probability Algorithm
In Non-Weighted Probabilit y algorithm there are U and ,R as N-dimensional patterns, R stands for the Reference pattern values and U are our input values. Let each component of the pattern vectors are the quadruple µi,σi,O ,i Xi , representing the mean, standard deviation, number of occurrences and actual data values for the ith feature. Assuming that each feature for a user is distributed according to a Normal distribution, score is calculated between a reference profile R and unknown profile U as
∑
==
N i uiS
U
R
Score
1)
,
(
(3.10) where ( ) − =∑
= i u i i i i o j r r u ij u u O ob X S 1 ) / ( Pr / 1 µ σ (3.11) and ( u) ij X is the thj occurrence of the ithfeature of U. The score for each u is based on the i probability of observing the values uij in the reference profile R given the mean (, µri)
and standard deviation (σri) for that feature in R. Higher probabilities are assigned to values of uij that are close to µri and lower probabilities to those further away (Monrose and Rubin, 1997).
3.4.6. Weighted Probability Algorithm
During the study of non-weighted probability algorithm, empirical tests showed that it might be reasonable to attach weights to the features (Monrose and Rubin, 1997). Some features are more reliable than others simply come from a larger sample set or have a relatively higher frequency in the written language; example in English “er ”, “th”, “re”,
should constitute greater weights, than “qu” or “ts”. Then formulation of score is now changed by the weights as
(
)
∑
==
N i u uiweight
iS
U
R
Score
1*
)
,
(
(3.12) where( )
=
∑
=otherwise
O
O
blank
is
r
or
u
if
weight
N k u u i i u k i i 1,
/
,
0
(3.13)In the study of Monrose and Rubin (1997), the non-weighted and weighted statistical methods were used and it was shown that the weighted probability algorithm performs better than non-weighted probability algorithm.
4 . NEURAL–STATISTICAL MODELING APPROACH TO KEYSTROKE BIOMETRIC SYSTEM S
A detailed literature search has been completed; many recent studies on the keystr oke pattern recognition have been examined. It has been observed that neural networks are popular and proper studies continue to get better results in terms of performance and reliability.
It is known that neural networks are used for prediction/forecasting, classification, data correlation etc. Classification is the major factor in keystroke pattern data recognition. Many different methods are used for the classification of pattern databases in order to discriminate keystroke rhythms.
In this thesis, a model is developed for recognizing a user by his personal typing rhythm on the keyboard, using the architecture of neural network embedded with the statistical formulations. Although this study is neither a statistical algorithm nor a neural network, it is a modeling study to make combination of two different classification methods.
The idea behind the neural–statistical modeling is come from an advisory of proper research study done in the Universiti Teknologi Malaysia . In their advisory, it was stated that one approach to refine the methodology used along with keystroke dynamics is to include some representations of the Euclidian distance as an additional inputs to the neural networks. “The Euclidian distance is a vector, which compares the distance of certain cluster to find the shortest distance to the center of the part/point. It is hoped that this will add the additional sensitivity and the keystroke dynamics should be able to breathe new ideas into identification problems.” (Ahmad, A.M. and Abdullah, N.N., 2000). Neural-statistical modeling is developed according to this advisory for future work study.
The statistical algorithm is chosen instead of Euclidian distance , because it is one of the main classification algorithms for keystroke rhythm. Two different statistical algorithms have been looked at in a previous study, the non-weighted probability algorithm and weighted probability algorithm (Monrose and Rubin, 1997) as explained formerly.
Non-weighted probability algorithm formulations are used and embedded into the architecture of the neural network. This means that the neural– statistical modeling is not an exact neural network, but only carries the characteristics of the neural network structure.
The designed model has been coded in one programming language , processed, and tested with some user datasets. Testing the model has given us information about the success rates FRR and FAR, which are known as reliability metric s in keystroke recognition.
4.1. Formation of User Datasets
The datasets used at the preprocessing and testing stages of the neur al-statistical model are supplied from the study done by Aykut Güven and Ibrahim Sogukpinar in 2000. The database of profiles was collected over a period of approximately 5 months. There are 16 users’ datasets with different numbers of trials getting into the system using their own passwords. All participants were asked to use a password with only 8 characters, not less or more than 8. Typing proficiency was not a requirement in this study although almost all the participants were familiar with computers. Participants ran the experiments from their own machines at their convenience.
Datasets were collected by a program written in C++ and exported to MS Excel in order to be used by other programs like Matlab. The content of the part of the dataset sheet which belonged to participa ting user number 16 is shown in Ta ble 4.1, and complete of that Excel sheet can be seen in Appendix1. In that Excel sheet, each row shows latencies between consecutive keystrokes in milliseconds.
As seen in Table 4.1, for one sample pattern data , there are 7 time delays. The first time delay be gins when the first key is released and ends when the second key is pressed. This was the way of recording the key transition times till the end of every password entrance. So, 7 time delays were obtained in milliseconds , while the user typed the password in each access trial.
Table 4. 1 The part of the dataset sheet for participant user number 16 Access trials 1.st delay 2.nd delay 3.rd delay 4.th delay 5.th delay 6.th delay 7.th delay 1 45332 123221 134312 444795 389385 722024 156351 2 78746 145276 123189 455829 134287 167498 111954 3 78742 156427 100992 356161 100920 167558 134211 4 78679 123025 111917 278525 101076 200750 123046 5 89796 145347 112058 267477 100891 167503 123132 6 78798 156376 123160 322789 89743 167461 111999 7 89978 145324 112060 223059 78787 167510 111906 8 1276639 622203 134087 112096 289520 112069 156371 9 78699 134238 123039 389400 100862 145356 101021 10 67753 134101 122971 311662 156360 189662 112040 11 67747 156372 123215 289587 145430 167564 100838 12 78711 134358 123088 344931 134250 200659 112125 13 78735 156380 145298 311780 156375 178502 123071 14 78604 145283 123006 256217 145340 167514 134082 15 56442 134032 112031 234021 178685 178610 100964 16 78788 134297 123112 23408 4 167650 234073 112132 17 67565 134156 123044 256217 134254 178500 112053 18 67750 167493 134201 189742 189728 167550 123120 19 78887 145234 112094 211951 178600 189627 123199 20 67669 156420 112118 211933 178607 189752 123193 21 67672 145293 123115 223013 167398 200745 123265 22 89870 123128 123111 245274 178570 200774 111923 23 67610 134206 123138 289558 200900 234103 134258 24 78653 123173 111924 200689 156299 189823 112025 25 78838 123158 123116 267355 156583 189658 123083 26 67795 134293 11195 7 244988 167464 167467 111986 27 89785 145345 122894 211979 178500 178648 111972 28 67621 156284 134311 344980 178781 178826 123134 29 67586 123091 123236 300551 178616 167455 112061 30 67557 134110 112076 256252 167557 189586 100965 31 67631 134242 112100 234030 178581 189688 112025 32 67779 145244 123074 256282 178651 178679 123079 33 89762 145335 123144 278506 200768 200684 123197 34 78972 156484 134273 223028 189658 211928 123128 35 89873 134265 123210 422544 167581 178714 123181 36 89871 156 573 123202 245129 178585 189728 112118 37 78824 123161 123111 233965 145368 178633 111989 38 89920 145313 123106 311750 189707 189657 123136 39 100860 134224 112021 278365 167465 200752 112006 40 78780 145249 123120 289975 178456 178589 112222 41 78792 145239 123143 300621 167554 200826 111933 42 89839 156469 112088 300642 189605 189656 123125 43 89860 156344 134221 311702 189798 189714 123184 44 67531 156362 112059 223123 167486 189701 112008 45 78643 134421 134189 189738 167503 200802 101008 46 67563 156570 123034 223060 178559 211995 123008
Keystroke pattern recognition studies depend on the idea that every person has a unique typing rhythm when using a keyboard. According to the idea, one person typing the same word (here the password) has a special rhythm each time. This can be seen easily in a graphical form in Figure 4.1, for the user data given in Table 4.2. Table 4.2 shows a small dataset taken from the datasheet of user number 16.
Table 4.2 Sample datasheet for 10 access trials of user number 16
1st delay 2nd delay 3rd delay 4th delay 5th delay 6th delay 7th delay 20.access trial 67669 156420 112118 211933 178607 189752 123193 21.access trial 67672 145293 123115 223013 167398 200745 123265 22.access trial 89870 123128 123111 245274 178570 200774 111923 23.access trial 67610 134206 123138 289558 200900 234103 134258 24.access trial 78653 123173 111924 200689 156299 189823 112025 25.access trial 78838 123158 123116 267355 156583 189658 123083 26.access trial 67795 134293 111957 244988 167464 167467 111986 27.access trial 89785 145345 122894 211979 178500 178648 111972 28.access trial 67621 156284 134311 344980 178781 178826 123134 29.access trial 67586 123091 123236 300551 178616 167455 112061 0 50000 100000 150000 200000 250000 300000 350000 400000 Characters of password Time (ms) 1. access trial 2. access trial 3. access trial 4. access trial 5. access trial 6. access trial 7. access trial 8. access trial 9. access trial 10. access trial
In Figure 4.1, the latency durations are shown on the Y-axis, and the typed password characters are shown on the X-axis. Only 10 access trials for the user number 16 are used to illustrate that every access trial has a simila r typing rhythm.
4.2 . Mathematical Model and Algorithm of the Designed Neural–Statis tical Model
The neural-statistical modeling approach aims to make a hybrid combination of statistical algorithms with neural networks on keystroke pattern recognition. Non-statistical formulations are embedded into the designed model. The diagrams below show the preprocessing and testing stages, which will be explained in detail.
While modeling, first of all, we need referenced pattern values in order to decide whether a user’s typing timings belong to an authorize user or not. The standard deviation is another necessary quantity, in order to decide how close user typing timings must be to the referenced ones for them to be accepted to the system. These parameters are preprocessed in the first stage, as shown below in Figure 4.2.
Figure 4.2 Neural -statistical algorithm model, preprocessing stage
Pi,k is a training dataset, where i numbers the training datasets for one user, and k is the number of character transition durations in each password entrance. Reference pattern values and standard deviations are calculate d in pairs for each user, which is shown as PTk , sk in Figure 4.2.These values are the outputs of the preprocessing stage of the model and calculate d for each character transition of the user password.
s
k, P
TkP
i,k?
The standard deviation is the quantity most commonly used to measure the variation in a dataset, given by the equation,
v
=
σ , (4.2)
where the variation ? is,
n x x
v =
∑
( i− )2/ , (4.3)In Equation 4.3, xi stands for Pi,k and x is the mean value stands for PTk and n is the number of password entrance s in the designed model. Plugging Equation 4.3 into the standard deviation formula, we obtain:
∑
− = (xi x)2/nσ (4.4)
The outputs of the preprocessing stage are used in the testing stage of the model as seen in Figure 4.3.
Figure 4.3 Neural-st atistical algorithm model, testing stage
The modeling approach is designed as seen in Figure 4. 3, with aspects of the MADALINE neural network model. MADALINE is a neural network which consists of more than one ADALINE unit, which is a processing element developed to take multiple input values and produce a single output. MADALINE networks usually contain 2 layers. There can be different numbers of ADALINE network units in each layer.
The training rule is the same as in the ADALINE network units. The important point in the MADALINE neural network is that it agrees with classical logic theory. In the case of using AND gate s the total output is 1, when all ADALINE network units produce 1 as their outputs. Otherwise a 0 (or -1) value is produced as the MADALINE network result. In the
? ? ? (0, 1) Pi,1 Pi,2 Oi,k = Pi,k - PTk PT1 PT2 s2 s1 sk Pn,k PTk -2sk < Oi,k < 2sk ?
case of OR gate s, an output of 1 in any ADALINE network unit is enough to give 1 as the MADALINE network output (Öztemel, 2003).
In the Figure 4.3, Oi,k is the difference between Pi,k and PTk. Pi,k values are the input datashee t for every access trial of one user. Here k numbers the key delays for each access trial. The number of password characters can be found easily as k+1. PTk and sTk values come from the preprocessing stage of our neural-statistical model, described earlier.
When designing the model, a hard-limit transfer function is used in the case of the first transfer function. According to the function, if Oi is greater than -2s and smaller than 2s then the output is 1, otherwise 0. The outputs of the hard-limit transfer function are given as the inputs of the AND gate in the final step. Here, used AND gate as the output function which means that all the units have to produce 1 output, in order to make the output of the AND gate 1. The output 1 at the end means that the user is authorized and access is granted. In the case where the output is 0, the user is unauthorized and access is denied.
4 .3. Implementation of the Designed System
The mathematical formulations of the designed model are completed and the major parameters figured out. The designed model, with the preprocessing and testing stages, has been coded using the Matlab programming language.
The Matlab program consists of two modules; one of them does preprocessing for the network with every user’s training dataset in order to find referenced parameters belonging to it. The reference parameters are the outputs of this module: sigma, which stands for the standard de viation, and the average, which stands for the mean value of each key delay column of the user training dataset. The flow chart for this program module is shown below in Figure 4.4.
Figure 4.4 Neural -statist ical algorithm preprocessing stage, flow chart
The other module is coded to take the test pattern dataset as input and to give authorization to some of this pattern dataset according to the neural-statistical modeling algorithm. So the outputs of this module are accepted and rejected number of pattern data. This module is shown below in Figure 4.5.
Figure 4.5 Neural -statistical algorithm testing stage, f low chart
During the implementation phase of the system, choosing the threshold value for the standard deviation has bee n an issue. The s tandard deviation is the parameter which is used to decide the closeness of the sample patterns to the reference pattern. When using a smaller standard deviation threshold, the FAR becomes lower and accepting of imposters by the system is made more difficult. While in the bigger standard deviation threshold case, the FRR becomes lower and rejection of authorized users by the syste m becomes less frequent. This relation can be seen as in Figure 4.6.