Special Issue of the 6th International Congress & Exhibition (APMAS2016), Maslak, Istanbul, Turkey, June 1–3, 2016
Optimization of Cutting Parameters, Condition
and Geometry in Turning AISI 316L Stainless Steel
Using the Grey-Based Taguchi Method
G. Basmaci
a,∗and M. Ay
baMehmet Akif Ersoy University, Faculty of Engineering and Architecture, 15030, Burdur, Turkey bMarmara University, Faculty of Technology, Department of Mechanical Engineering, 34722, Istanbul, Turkey
In this study, experimental optimization of cutting forces, surface roughness and the hardness of material after turning of AISI 316L stainless steel, using conventional and wiper insert cutting tools under dry, CO2 and MQL cutting conditions, is presented. The influences of feed rate, cutting depth, and cooling system on surface roughness, cutting force and material hardness were examined. In order to optimize the turning process, Grey relational analysis optimization method was used. The optimal machinability parameters of AISI 316L stainless steel with coated carbide insert were successfully determined.
DOI:10.12693/APhysPolA.131.354
PACS/topics: 81.05.–t
1. Introduction
The steel materials used in the manufacturing indu-stry are becoming more advanced day by day. Stainless steel, is commonly used in a wide range of applications in the manufacturing sector, due to its high mechani-cal properties, corrosion resistance and low thermal con-ductivity [1]. Although it is more expensive, compared to other forms of steel, stainless steel is becoming increa-singly popular for use in many fields, ranging from food to health, chemistry to electronics, from defense industry to nuclear power plants and automotive to aerospace, due to its superior mechanical properties and unique corrosion resistance [2–4]. Stainless steel is a type of steel which contains 11–18% of chromium in its composition [5].
Austenitic and ferritic stainless steel is used particu-larly in machinery and manufacturing industry. These forms of steel fall under the “difficult to machine” mate-rials class with their low thermal conductivity properties. Low thermal conductivity, leads to high shear force, high cutting temperatures, rapid tool wear, produces difficult to break chips, causes chips to bond to the cutting edge and leads to poor surface quality [6]. In addition the energy used for plastic deformation of the workpiece du-ring machine turning is converted to heat and it is well known that heat mostly occurs in the primary deforma-tion zone. However, heat generated during deformadeforma-tion is closely associated with friction and shear force in the tool-chip interface, which vary according to tool geome-try and cutting parameters. Tool-chip contact length and therefore tool geometry directly affect tool life and ma-chining efficiency [7].
In recent years, it is possible to come across many experimental studies investigating the effects of cutting
∗corresponding author; e-mail: [email protected]
parameters on shear force and surface roughness, occur-ring duoccur-ring machining of various forms of stainless steel. In one of these studies, the machinability of AISI 304 and AISI 316 stainless steel with coated cemented carbide cutting tools was investigated and cutting speed was re-ported as an important parameter for surface roughness Ra [8]. In another study, the Fc generated during the
turning of AISI 304 austenitic stainless steel with TIC-coated cutting tool, was theoretically and experimentally evaluated and it was indicated that the theoretical appro-ach could be used with 80% average accuracy [9]. Ra is reported to decrease parallel to the decrease in cutting sound pressure level during the turning of AISI 304 stain-less steel at low feed rate and high cutting speeds [10, 11]. In another study, the verification tests conducted ac-cording to the optimum cutting parameters for surface roughness and cutting force during turning of austeni-tic stainless steel, resulted in a 23.4% improvement [12]. A variance analysis on the Ra resulting from the machi-ning of AISI 304 stainless steel, revealed that feed rate had a 51.84% effect on Ra [13].
Time, volume and efficiency of production are not the only factors that should be taken into consideration in the assessment of success of a production method. Ot-her important considerations must include the effect on the environment and human health. Machine turning ap-plications, which use cooling techniques that respect hu-man health and the environment, have been developed. The performance characteristics of the alternative cool-ing technique were found to be superior to the conven-tional cooling techniques [1, 3-22]. The MQL technique which delivers reduced tool wear and improved surface quality thanks to a reduction in the heat generated in the tool-chip and workpiece-chip cutting zone are impor-tant results [23]. Liquid nitrogen, and carbon dioxide are also used as alternative cooling systems for the cooling of the cutting zone. A 55% reduction in edge wear was reported following the use of liquid nitrogen cooling [24].
In this study; the effect of feed rate, depth of cut and cooling system on surface roughness and cutting force during machine turning of AISI 316L stainless steel is investigated. Taguchi Grey analysis technique was used in the optimization of the turning process. Furthermore, variance analysis was conducted to determine the effect of each parameter on the results. As a result of this analysis, the effect of feed rate, depth of cut and cooling system on surface roughness and cutting force during machine turning of AISI 316L stainless steel was determined.
2. Materials and methods
AISI 316L was used for the purposes of this study. The experiment samples were rod-shaped, 130 mm in length and 25 mm in diameter. During the machining process, CNMG 12 04 08 mm cutting tips, produced by Sandvik company were used. The Johnford TC 35 CNC Fanuc OT, an x-z axis CNC machine was used during the experiment. A perhometer M1 type surface roughness meter, manufactured by Mahr was used in the experi-ment. Surface roughness can be determined with vari-ous parameters according to DIN, ISO, JIN, AISI stan-dards. A KISTLER 9121 dynamometer with KISTLER 5019b type load amplifier and the DynoWare analysis software was used for power measurement during the ex-periments (Fig. 1).
Fig. 1. The experimental setup.
TABLE I Factors and designated levels.
Factors Level 1 Level 2 Level 3 Feed rate [mm/rev] 0.1 0.2 0.3
Depth of cut [mm] 0.5 1 1.5
Cooling system Dry MQL CO2
Three levels were set between 0.1 to 0.3 mm/rev for the feed rate parameter, and 0.5 and 1.5 mm for depth of cut. Dry, MQL (minimum quantity lubrication) and CO2options were examined for the cooling system factor.
Table I shows key factors and designated levels, affecting cutting force and surface roughness.
2.1. Taguchi design
Taguchi parametric design is a very effective design tool, offering simple and systematic qualitative optimal design at a relatively low cost. It has become very po-pular in the last two decades. By helping to determine the significant factors, this approach not only saves the experimental time but also the costs. Selection of an orthogonal array is one of the most important steps in-volved in Taguchi technique. An orthogonal array is a small set of all the possibilities, which helps to determine the least number of experiments. It will further help to conduct experiments to determine the optimum level for each process parameter and to establish the relative im-portance of individual process parameters [25]. For the experiments performed according to Taguchi L9
ortho-gonal array, levels of the set of parameters are given in Table II.
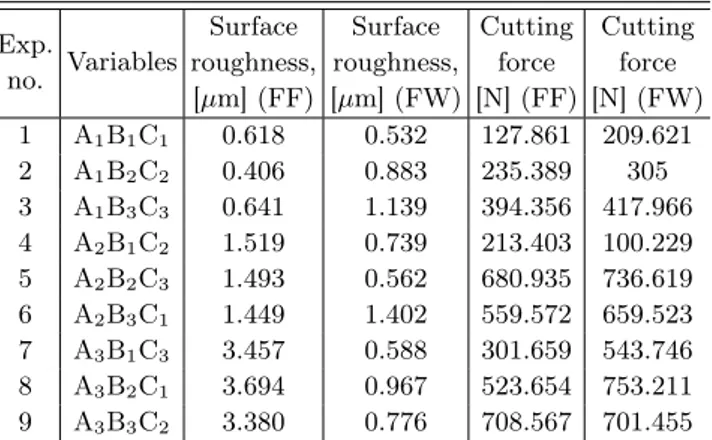
TABLE II The orthogonal array L9-based surface roughness and cut-ting force. Exp. no. Variables Surface roughness, [µm] (FF) Surface roughness, [µm] (FW) Cutting force [N] (FF) Cutting force [N] (FW) 1 A1B1C1 0.618 0.532 127.861 209.621 2 A1B2C2 0.406 0.883 235.389 305 3 A1B3C3 0.641 1.139 394.356 417.966 4 A2B1C2 1.519 0.739 213.403 100.229 5 A2B2C3 1.493 0.562 680.935 736.619 6 A2B3C1 1.449 1.402 559.572 659.523 7 A3B1C3 3.457 0.588 301.659 543.746 8 A3B2C1 3.694 0.967 523.654 753.211 9 A3B3C2 3.380 0.776 708.567 701.455
2.2. Taguchi-based Grey relational analysis method The obtained experimental results and the determi-ned parameters were optimized with Grey-based Taguchi method. Using regression model, researches were carried out calculating an equation between dependent parame-ters and independent parameparame-ters. The Taguchi method uses a special design of orthogonal arrays to study the en-tire parameter space with a small number of experiments only.
Experimental design was done using Taguchi method. Hence, it has been possible to reach more comprehen-sive results with doing less experiment. In this sense, time and money have been used more efficiently [26, 27]. While a single outcome is optimized in the Taguchi met-hod, multiple outcomes can be optimized in a Grey rela-tional analysis [28]. In this study, Taguchi method was used in the experimental design step, Grey relational ana-lysis method was used in the optimization step.
Grey relational analysis optimization process was car-ried out in the following three steps [28].
1. Normalization of experimental results (the lowest– the best).
2. Calculation the Grey relational coefficient. 3. Calculation of the Grey relational degree.
4. Determination of optimal experiment parameters. In the normalization step, the experimental results were normalized using the following equation according to “the lowest–the best” principle.
xi(k) =
max yi(k) − yi(k)
max yi(k) − min yi(k)
, (1)
where, xi(k)refers to the value at the ith series and kth
row after normalization process, min yi(k) refers to the
minimum value of the ith series, max yi(k)refers to the
maximum value of the ith series and yi(k) refers to the
original value of the i series at kth row.
In step two, Grey relational coefficient was calculated via Eq. (2)
ξi(k) =
∆ min +ζ∆ max ∆0i(k) + ζ∆ max
. (2)
Here, ζ is a distinguishing coefficient between 0 and 1, ∆0i is the amount of deviation between the reference
se-ries and the normalization values. ∆ min refers to the mi-nimum value of the deviation sequence from the reference
series and ∆ max refers to the maximum value of devia-tion sequence from the reference series.
In the step three, Grey relational degree was calculated by Eq. (3) γi= 1 n n X k−1 ξi(k). (3)
3. Results and discussion
Influence of the cutting parameters and the effect of cutting geometry and parameters on surface roughness Raand cutting force on turning of a AISI 316L stainless steel with Sandvik CNMG 12 04 08 conventional (FF) and wiper (FW) inserts is discussed in this section.
3.1. Optimization of experimental results for surface roughness and cutting force
Values of surface roughness and cutting force obtained in the experimental step, for Taguchi L9 experiment
de-sign, are shown in Table II. Grey relational analysis met-hod was applied to the experimental results, as shown in Table III and the other steps (normalization, delta values, and Grey relational grade) results are given in Table IV and Table V.
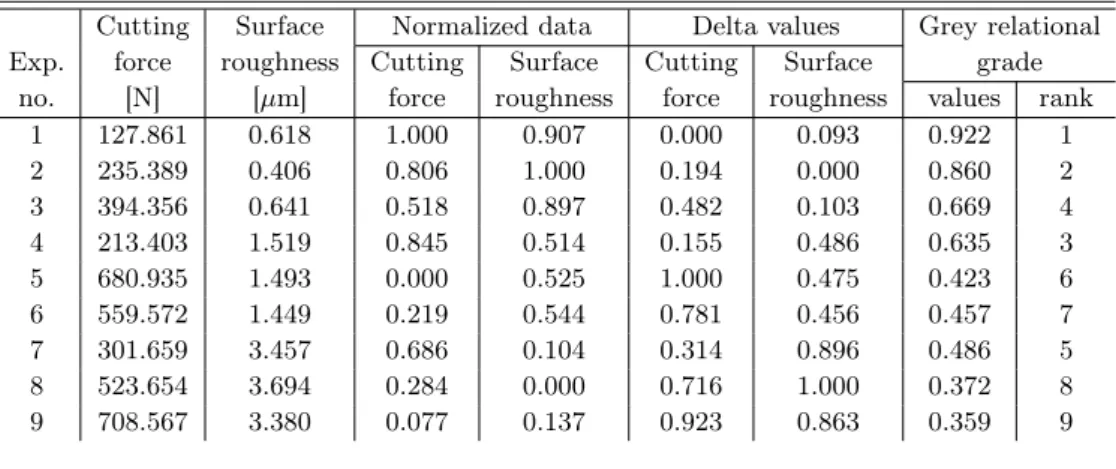
TABLE III Normalized data, delta values and Grey relational grade for conventional insert tool.
Cutting Surface Normalized data Delta values Grey relational Exp. force roughness Cutting Surface Cutting Surface grade
no. [N] [µm] force roughness force roughness values rank
1 127.861 0.618 1.000 0.907 0.000 0.093 0.922 1 2 235.389 0.406 0.806 1.000 0.194 0.000 0.860 2 3 394.356 0.641 0.518 0.897 0.482 0.103 0.669 4 4 213.403 1.519 0.845 0.514 0.155 0.486 0.635 3 5 680.935 1.493 0.000 0.525 1.000 0.475 0.423 6 6 559.572 1.449 0.219 0.544 0.781 0.456 0.457 7 7 301.659 3.457 0.686 0.104 0.314 0.896 0.486 5 8 523.654 3.694 0.284 0.000 0.716 1.000 0.372 8 9 708.567 3.380 0.077 0.137 0.923 0.863 0.359 9 TABLE IV Normalized data, delta values and Grey relational grade for wiper insert tool.
Cutting Surface Normalized data Delta values Grey relational Exp. force roughness Cutting Surface Cutting Surface grade
no. [N] [µm] force roughness force roughness values rank
1 209.621 0.532 0.832 1.000 0.168 0.000 0.875 1 2 305 0.883 0.686 0.597 0.314 0.403 0.584 2 3 417.966 1.139 0.513 0.302 0.487 0.698 0.462 3 4 100.229 0.739 1.000 0.762 0.000 0.238 0.839 4 5 736.619 0.562 0.025 0.966 0.975 0.034 0.637 5 6 659.523 1.402 0.143 0.000 0.857 1.000 0.351 6 7 543.746 0.588 0.321 0.936 0.679 0.064 0.655 7 8 753.211 0.967 0.000 0.500 1.000 0.500 0.417 8 9 701.455 0.776 0.079 0.720 0.921 0.280 0.496 9
The Grey relational coefficients were calculated using Eq. 2 and results are shown in Table V.
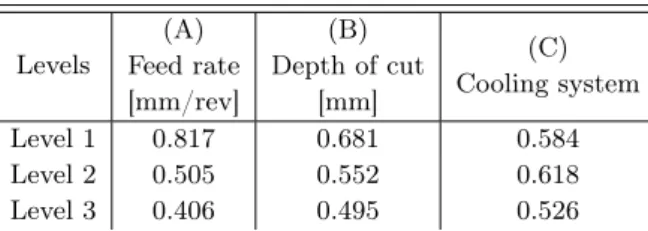
TABLE V Grey relational degrees of the factor levels for conven-tional insert tool.
Levels (A) Feed rate [mm/rev] (B) Depth of cut [mm] (C) Cooling system Level 1 0.817 0.681 0.584 Level 2 0.505 0.552 0.618 Level 3 0.406 0.495 0.526
The Grey relational degrees related to each experimen-tal result were calculated and the experimenexperimen-tal results were ranked in order from highest Grey relational degree and are presented in Fig. 2, Table V and VI.
Fig. 2. Grey relational degrees for each experiment.
TABLE VI Grey relational degrees of the factor levels for wiper insert tool. Levels (A) Feed rate [mm/rev] (B) Depth of cut [mm] (C) Cooling system Level 1 0.640 0.789 0.547 Level 2 0.609 0.546 0.640 Level 3 0.523 0.436 0.585
As seen from the Table V and VI, A1 (feed rate: 0.1 mm/rev), B1 (depth of cut: 0.5 mm), and C2 (MQL) were selected as the optimal parameter levels. The op-timal parameters levels will represent the lowest surface roughness and cutting force value.
4. Conclusions
This study of the machinability of AISI 316L stain-less steel alloy material with SANDVIK CNMG 12 04 08 coated conventional (FF) and wiper (FW) inserts has produced useful results. The considered criteria for the machinability were surface roughness, cutting force and material hardness. Three control factors, which were sidered to be effective in creating the most suitable con-ditions for the criteria (feed rate, depth of cut and corner
radius) were chosen at three different levels and applied in the experimental study. Below is the summary of the results:
• Based on the Grey relational analysis, the op-timal cutting parameters were A1B1C2 for sur-face roughness and cutting force, i.e. feed rate of 0.1 mm/rev, depth of cut of 0.5 mm and MQL cool-ing system.
• Taguchi method is beneficial for the experimental design of the machinability of AISI 316L stainless steel alloy. Having optimized the parameters is also fruitful for keeping the response values at required levels.
• Test results prove the effectiveness of the wiper inserts in providing excellent surface roughness. The results also suggest that the use of the wiper in-sert is an effective way, which significantly increases cutting efficiency, without changing the machined surface roughness in high feed turning operations.
References
[1] T. Kosa, P. Ronald, Handbook: Machining, Vol. 16, 9th ed., 1989.
[2] R. M’Saoubi, J.C. Outeiro, B. Changeux, J.L. Le-brun, A.M. Dias, J. Mater. Proc. Tech. 96, 225 (1999).
[3] J.D. Darwin, D.M. Lal, G. Nagarajan, J. Mater. Proc. Tech. 195, 241 (2008).
[4] J.C. Outeiro, D. Umbrello, R. M’Saoubi, Int. J. Mach. Tools Manufact., 46, 1786 (2006).
[5] B.K. Agrawal, Introduction to Engineering Materials, Mc Graw-Hill, 1983.
[6] C. Maranhao, J.P. Davim, Simulation Modelling Practice and Theory 18, 139 (2010).
[7] I. Korkut, M. Boy, I. Karacan, U. Seker, Mater. De-sign 28, 2329 (2007).
[8] İ. Ciftci, Tribol. Int. 39, 565 (2006).
[9] Ö. Tekaslan, N. Gerger, M. Günay, U. Şeker, Pamuk-kale Üniversitesi Mühendislik Bilimleri Dergisi 13, 135 (2007).
[10] Z. Tekiner, S. Yeşilyurt, Mater. Design 25, 507 (2004).
[11] M. Kaladhar, K.V. Subbaiah, C.S. Rao, J. Engin. Sci. Technol. 8, 165 (2013).
[12] S. Li, Y. Liu, R. Zhu, H. Li, W. Ding, Appl. Mech. Mater. 34, 1829 (2010).
[13] D.P. Selvaraj, P. Chandramohan, J. Engin. Sci. Technol. 5, 293 (2010).
[14] A.E. Diniz, J.R. Ferreira, F.T. Filho, Int. J. Mach. Tools Manufact. 43, 317 (2003).
[15] H.A. Kishawy, M. Dumitrescu, E.G. Ng, M.A. Elbe-stawi, Int. J. Mach. Tools Manufact. 45, 219 (2005). [16] N.R. Dhar, M. Kamruzzaman, M. Ahmed, J. Mat.
[17] F. Itoigawa, T.H.C. Childs, T. Nakamura, W. Belluco,
Wear 260, 339 (2006).
[18] N.R. Dhar, M.W. Islam, S. Islam, M.A.H. Mithu,
J. Mater. Proc. Tech. 171, 93 (2006).
[19] E.O. Ezugwu, J. Bonney, R.B. Da Silva, O. Çakir,
Int. J. Mach. Tools Manufact. 47, 884 (2007). [20] A. Attanasio, M. Gelfi, C. Giardini, C. Remino, Wear
260, 333 (2006).
[21] C. Bruni, A. Forcellese, F. Gabrielli, M. Simoncini,
Int. J. Machine Tools Manufact. 46, 1547 (2006). [22] K. Venkatesan, R. Ramanujam, V. Saxena, N.
Cha-wdhury, V. Choudhary, J. Engin. Appl. Sci. 9, 250 (2014).
[23] J. Liu, R. Han, Y. Sun, Int. J. Mach. Tools Manu-fact. 45, 687 (2005).
[24] M. Stanford, P.M. Lister, C. Morgan, K.A. Kibble,
J. Mat. Proc. Technol. 209, 961 (2009).
[25] P.J. Ross, Taguchi Techniques for Quality Engineer-ing, 1996.
[26] N. Tosun, Int. J. Adv. Manufact. Technol. 28, 450 (2006).
[27] İ. Asiltürk, S. Neşeli, Measurement 45, 785 (2012). [28] M. Kurt, S. Hartomacioğlu, B. Mutlu, U. Köklü,