2018
REPUBLIC OF TURKEY BIRUNI UNIVERSITY
INSTITUTE OF HEALTH SCIENCES
DEPARTMENT OF MOLECULAR BIOLOGY AND GENETICS MOLECULAR AND MEDICAL GENETICSGRADUATE PROGRAMME
AFSHAN BABAZADE ADVISOR
Assist. Prof. Elif Sibel ASLAN
ISTANBUL
INVESTIGATION OF SPECIFIC ONCOMIR MICRORNAS THAT MODIFY METHYLATION PATTERNS ONTO EFFECTION OF PROSTATE CANCER
iii Statement
I hereby declare that all information in this thesis has been obtained and presented in accordance with academic rules and ethical conduct. I also declare that, as required by these rules and conduct, I have fully cited and referenced all material and results that are not original to this work.
Name Surname: Afshan Babazade Signature
iv Acknowledgements
Firstly, I would like to express my sincere gratitude to my supervisorDr. Elif Sibel Aslan for the continuous support of my Master Study and related research, for her patience, motivation, and immense knowledge. Her guidance helped me in all the time of research and writing of this thesis. I could not have imagined having a better advisor and mentor for my Master Study.
My sincere thanks also goes tomy co-supervisor Assoc. Prof. Fahri Akbas, who provided me an opportunity to join their team as intern, and who gave access to the laboratory and research facilities. The door to Assoc. Prof. Fahri Akbas’s office was always open whenever I ran into a trouble spot or had a question about my research or writing.
I would like to thank the Dr. Ganime Coban who helped me in sample collection. Without her precious support it would not be possible to conduct this research.
Nevertheless, I am also grateful to the Research Assistant McS. Cilem Ercan for her feedback, motivation, cooperation and of course friendship.
Last but not the least, I would like to thank my family: my parents and to my brother and sister for supporting me spiritually throughout writing this thesis and my life in general. This work was supported by the project number 3.2018/9 by the Bezmialem Vakıf University Scientific Research Projects Commission.
Afshan Babazade
v TABLE OF CONTENTS
Statement ... iii
Acknowledgements ... iv
TABLE OF CONTENTS ... v
SYMBOLS AND ABBREVIATIONS ... viii
LIST OF TABLES ... x
LIST OF FIGURES ... xi
1.ABSTRACT ... 1
2.INTRODUCTION ... 2
2.1.The Prostate Gland ... 2
2.2.Characteristics of Prostate Cancer ... 3
2.2.1.Epidemiology of Prostate Cancer ... 3
2.2.2.Common Prostate Cancer Risk Factors ... 4
2.2.3.Classifying Prostate Cancer ... 4
2.2.3.1.The Gleason Grading System ... 4
2.2.3.2.Clinical and Pathological Staging ... 7
2.3.Epigenetics ... 10
2.3.1.DNA methylation ... 11
2.3.2.Molecular mechanism of DNA methylation ... 12
2.4.DNA methylation changes in cancer ... 14
2.4.1.Global genomic hypomethylation ... 14
2.4.2.Single-locus DNA hypomethylation ... 15
2.4.3.DNA hypermethylation ... 15
2.4.4.CpG island methylator phenotype ... 16
2.5.Diagnostic Biomarkers for Prostate Cancer ... 17
2.5.1.What are Biomarkers? ... 17
vi
2.5.2.1.Chromosomal Alterations ... 17
2.5.2.2.Long non-coding RNAs ... 18
2.5.3.Epigenetic Diagnostic Biomarkers ... 19
2.5.3.1.DNA Methylation Biomarkers ... 19
2.5.3.2.MicroRNA ... 20
2.5.4.Proteomic Diagnostic Biomarkers ... 21
2.5.5.Diagnostic Biomarker Panels ... 21
2.5.5.1.Prostate Health Index ... 22
2.5.5.2.4Kscore ... 22
2.5.5.3.Mi-Prostate Score... 22
2.5.6.Limitations of the Current Diagnostic Biomarkers ... 23
2.6.Aim of the thesis ... 23
3.MATERIALS AND METHODS ... 24
3.1.Required Devices ... 24
3.2.Required Materials ... 24
3.3.Sample Collection ... 25
3.4.RNA Isolation ... 26
3.4.1.Determination of the concentration and quality of the isolated RNAs ... 27
3.5.cDNA synthesis ... 27
3.6. Real-Time PCR ... 28
3.7.DNA Isolation ... 29
3.7.1.Determination of the concentration and quality of the isolated DNAs ... 29
3.8.Bisulfite DNAmodification ... 29
3.9.Methylation-specific PCR ... 31
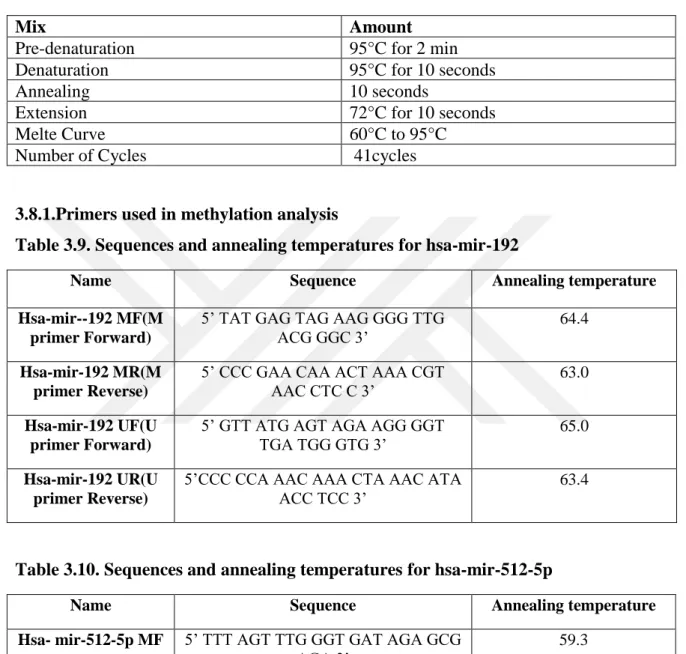
3.8.1.Primers used in methylation analysis ... 32
3.9.1.Agarose Gel Electrophoresis ... 33
3.9.1.1.Preparation of 10X tris-acetate-EDTA (TAE) ... 33
vii
3.9.1.3.Loading samples into agarose gel ... 34
3.10.Statistics ... 34 3.10.1.RT-PCR ... 34 3.10.2.qPCR ... 34 4.RESULTS ... 35 4.1.RNA isolation ... 35 4.2.DNA isolation ... 37 4.3.RT-PCR ... 38 4.4.Methylation ... 40
4.4.1. Gel screening results ... 47
5.DISCUSSION ... 48
6.REFERENCES ... 53
7.ADDITIONS ... 72
7.1.Resume ... 72
7.2.Plagiarism Report ... 73
viii SYMBOLS AND ABBREVIATIONS
4Kscore Four Kalikrein Score αHCG α chorionic gonadatropin
AJCC American Joint Committee on Cancer AMACR Alpha-methyl-CoA Racemase
APC Adenomatous Polyposis Coli
bp Base Pair
BPH Benign Prostatic Hyperplasia
BRCA2 Breast Cancer Type 2 Susceptibility Protein
caC Carboxylcytosine
CHEK2 Checkpoint Kinase 2
CIMP CpG island methylator phenotype
CpG Cytosine base located adjacent to a guanine base DNA DeoxyriboNucleic Acid
DRE Digital Rectal Examination ERG Transcriptional Regulator ERG
ETV1 ETS Variant 1
ETV4 ETS Variant 4
FDA Food and Drug Administration FFPE Formalin-Fixed, Paraffin-Embedded GOLPH2 Golgi Membrane Protein 1
GS Gleason Score
GSTP1 Glutathione S-Transferase Pi 1
HBG1 γ-globin
HOXB13 Homeobox B13
ix
miRNA MicroRNA
Mi-PS Mi Prostate Score
MRI Magnetic Resonance Imaging PCa Prostate Cancer
PCA3 Prostate Cancer Antigen 3 PCR Polymerase Chain Reaction PHI Prostate Health Index PSA Prostate-specific Antigen RARB2 Retinoic Acid Receptor Beta
RASSF1A Ras Association Domain Family member 1
RNA RiboNucleic Acid
ROC Receiver Operating Characteristic RP Radical Prostatectomy
SNV Single Nucleotide Variants
TMPRSS2 Transmembrane Protease, Serine 2 TNM Tumour, Node, Metastasis
tPSA Total PSA
x LIST OF TABLES
Table 2.1. 2014 Gleason Grading System for Prostate Cancer Tumours --- 7
Table 2.2. TNM staging according to the American Joint Committee on Cancer (AJCC) and the International Union Against Cancer (UICC) as of 2016 --- 8
Table 3.1. Ages and gleason grades of patients with Prostatic Aciner Adenocarcinoma --- 25
Table 3.2. Mix amounts of cDNA synthesis. Step 1. --- 27
Table 3.3. Mix amounts of cDNA synthesis. Step 2. --- 27
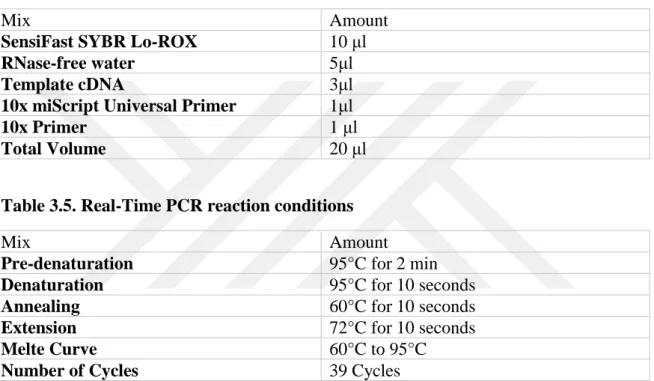
Table 3.4. Real-Time PCR mixture quantities --- 28
Table 3.5. Real-Time PCR reaction conditions --- 28
Table 3.6. Primer sequences used in RT-PCR --- 28
Table 3.7. qPCR mixture quantities --- 31
Table 3.8. qPCR reaction conditions --- 32
Table 3.9. Sequences and annealing temperatures for hsa-mir-192 --- 32
Table 3.10. Sequences and annealing temperatures for hsa-mir-512-5p --- 32
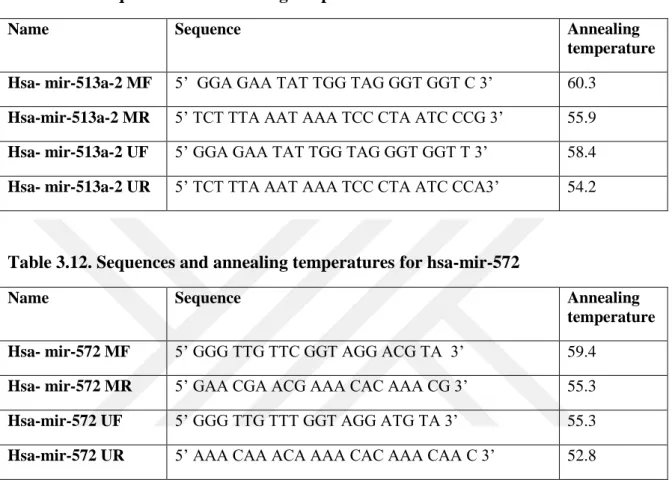
Table 3.11. Sequences and annealing temperatures for hsa-mir-513a-2--- 33
Table 3.12. Sequences and annealing temperatures for hsa-mir-572 --- 33
Table 4.1. Concentration and purity values of RNA samples --- 35
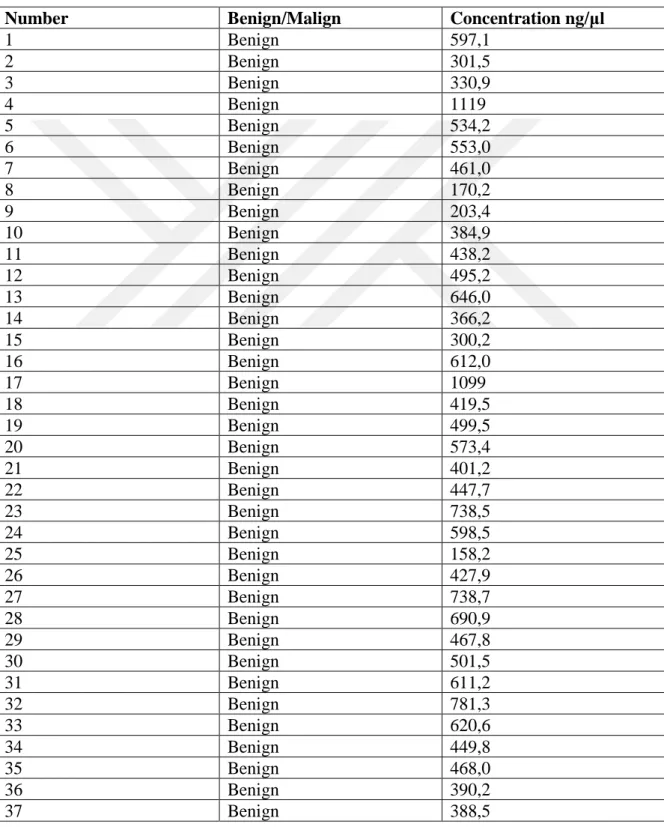
Table 4.2. Concentration and purity values of DNA samples --- 37
Table 4.3. RT-PCR Cq results --- 40
Table 4.4. Melt peak results of Benign Tissue Samples. --- 41
Table 4.5. Melt peak results of Malign Tissue Samples. --- 42
Table 4.6. qPCR Melt curve peak results. --- 43
Table 4.7. Methylation. --- 43
xi LIST OF FIGURES
Figure 2.1. The Prostate. ... 3
Figure 2.2. The Gleason Scoring System Schematic. ... 6
Figure 2.3. Histological representation of cribriform glands (gleason pattern 4)... 7
Figure 2.4. DNA backbone and CpG dinucleotides ... 12
Figure.2.5. Methylation cycle ... 14
Figure 3.1. Transformation of cytosine to urasil with bisulphite modification. ... 31
Figure 4.1. Gen Expression Levels of MicroRNAs ... 39
Figure 4.3. Methylation percentages. ... 43
Figure 4.3. qPCR results of hsa-mir-192. ... 45
Figure 4.4. qPCR results of hsa-mir-512-5p... 46
Figure 4.5. qPCR results of Hsa-mir-513a-2. ... 46
Figure 4.6. A gel image of the methylation analysis of Hsa-mir--572 in benign (a) and malign (b) tissues samples. ... 47
1 INVESTIGATION OF SPECIFIC ONCOMIR MICRORNAS THAT MODIFY METHYLATION PATTERNS ONTO EFFECTION OF PROSTATE CANCER Afshan
1.ABSTRACT
Prostate Cancer (PCa) is the second most common cause of cancer-related deaths in men. Although the etiopathogenesis of PCa has not been clearly elucidated, the evidences has been obtained that epigenetic factors have been implicated in the onset and progression of cancer for the last 10 years.Hypermethylation of genes has been shown to be associated with PCa. MicroRNA (miRNA) is a single-stranded, small non-coding molecules containing about 22 nucleotides. miRNA plays a critical role in the genetic pathogenesis of many types of cancer and mostly human cancer types. DNA methylation is known to be involved in cancer formation, progression and metastasis. Thus, DNA hypermethylation in CpG islands is a marker in the early detection of cancer that can be used as an indicator. Epigenetic mechanisms can be used as a marker in the diagnosis of the disease as well as in the treatment process. It is suggested that epigenetic changes such as DNA methylation and histone modification may be an effective strategy in the treatment of cancer by targeting. In current thesis, promoter methylation statuses and expression changes ofhsa-mir-192, hsa-mir-512-5p, hsa-miR-513a-2 andhsa-mir-572 were analyzed by methylation specific PCR and real time PCR respectively in prostate cancer tumor tissues. Subsequently, here was shown the gene-specific promoter methylation changes that was generated intumor tissues ofmiRNAs, which were shown to be significant. In this work, the possible tumor suppressor potentials ofmiRNAs have been shown.
Keywords: microRNA, methylation, prostate cancer, biomarkers
Advisor: Assist. Prof. Elif Sibel Aslan, Biruni University, Faculty of Natural Sciences and Engineering, Dept. of Molecular Biology and Genetics
Co-Advisor: Assoc. Prof. Fahri Akbas, Bezmialem Vakif University, Faculty of Medicine, Dept. of Medical Biology
Supporter: Bezmialem Vakif University Scientific Research Projects Commission, project no.3.2018/9
2 2.INTRODUCTION
2.1.The Prostate Gland
The prostate is a gland located in the male reproductive system just below the mesentery and in front of the rectum. This walnut-sized gland surrounds a part of the urethra and produces fluid that is part of the sperm (Bhavsar A et al. 2014). The prostate is arranged into an apex, a base, and anterior and posterior surfaces (Figure 2.1). It is also encapsulated by connective tissue that mostly consists of smooth muscle fibers and elastic connective tissue (Bhavsar A et al. 2014). The prostate gland can grow to 40 grams in older men (Kgatle et al. 2016).
The prostate has three zones: the peripheral, central, and transition zone (Figure 2.1) (Salman et al. 2015, Bhavsar et al. 2014, Shen et al. 2010). About 70% of the peripheral zone contains the glandular tissue within the prostate. In contrast, the glandular tissuepercentage of central zone consists is 25% and of transition zone consists is 5%. Prostate cancer (PCa) is most commonly found within the peripheral zone, besides it Benign Prostatic Hyperplasia (BPH) is often found in the transition zone (Bhavsar et al. 2014, Shen et al. 2010).
In male individuals, as the age progresses, the prostate can grow and block the urethra or bladder. This condition, which known as benign prostatic hyperplasia (BPH), can cause sexual and urine production problems. Although there is no cancer, surgery may be necessary (Prostate Cancer Treatment, 2002). Prostate cancer begins with uncontrolled development and proliferation of abnormal sperm-secreting prostate gland cells. If not treated, lymph nodes, bones and other parts of the body can metastasize. Most patients remain asymptomatic in the early stages of disease. However, during the later stages of the disease, various urinary symptoms such as dysuria, hematuria, hematospermia, pain in the pectoral region and swelling of the pelvis are seen (Catalona et al. 1994, Barry et al. 2009). Symptoms of BPH or other problems in the prostate may resemble symptoms of prostate cancer (Prostate Cancer Treatment, PDQ Adult Treatment Editorial Board, 2002).
3 Figure 2.1. The Prostate.The prostate is divided into a)the central zone, b)anterior fibromuscular stroma, c)transition zone, d&f)peripheral zone and e)periurethral gland (De Marzo et al. 2007).
2.2.Characteristics of Prostate Cancer 2.2.1.Epidemiology of Prostate Cancer
Prostate cancer is the second most common cause of cancer-related mortality in men after lung cancer with a higher incidence of the disease observed in developed countries (Center
et al. 2012). The incidence has begun to increase worldwide since 1990. PCa is the third
after lung and colon cancer in related deaths and responsible for 9% of cancer-related deaths (Jemal et al. 2006). Approximately 1,1 million people were diagnosed with prostate cancer in 2012, and about 70% of the cases occurred in developed regions (GLOBOCAN, 2012). The morbidity of prostate cancer varies between different regions of the world, with highest in North America and lowest in South Asia. In New Zealand and Australia, the highest incidence rate for age is 111,6 in 100,000 and the lowest is 3,7 in 100,000, while it is 4,5 in South Asia (Bashir et al. 2015, Torre et al. 2015, Hassanipour-Azgomi et al. 2016) It has been noted that prostate cancer has been detected in approximately 2,8 million men in the United States, and the incidence has increased over time (Gronberg, 2003, Vanagore et al. 2017). Men have a 1 in 8 chance of being diagnosed with PCa during their lifetime. Nevertheless only 1 in 27 is expected to die from Pca. This
4 is due to the majority of PCa cases that are indolent or slowgrowing in nature This is due to the majority of lazy or slowly growing PCa cases in nature. (Canadian Cancer Society, 2016). According to 2015 datas the prostate cancer incidence rate is 35 cases per 100,000 in Turkey (Zorlu et al. 2014).
2.2.2.Common Prostate Cancer Risk Factors
There are several established risk factors that may indicate the presence of PCa in men (Attard et al. 2016, Cuzick et al. 2016, Glass et al. 2013). Age is one of the powerful risk factor for having PCa. For men with older age, the risk of becoming PCa is higher, and the incidence rapidly increases after age of 70 (Attard et al. 2016). Ethnicity is also one of the established risk factors for PCa(Attard et al. 2016, Cuzick et al. 2016, Glass et al. 2013). The incidence of PCa in patients with different ethnicities is variable depending on the geographical location (Center et al. 2012). Notably, African American men have the highest incidence of PCa in the US (Thompson et al. 2006). This may be relatedto socioeconomic status, limited access to healthcare and late PCa screening for this population (Dale et al. 1996). Likewise, patients who have a family history of PCa are also considered to have a higher risk of developing PCa (Attard et al. 2016, Glass et al. 2013). This depends on the amount of relatives affected with the disease and the relationship of the patient to the affected relative. Furthermore, known genes disclose about 35% of the familial risk for PCa. (Lichtenstein et al. 2000). Genetic mutations in genes such as BRCA2 are found in families with higher rates of breast and ovarian cancer (Rebbeck et al. 2015). Relatively rare, men who are carriers of BRCA2 mutation are also more likely to develop PCa. (Kote-Jarai et al. 2011,Castro et al. 2013). In addition, other gene mutations that have also been associated with an increased risk of PCa include HOXB13 and 5 CHEK2 genes (Karlsson et al. 2014, Goh and Eeles, 2014).
2.2.3.Classifying Prostate Cancer 2.2.3.1.The Gleason Grading System
The main screening methods for diagnosing of prostate cancer are digital rectal examination (DRE), serum prostate-specific antigen (PSA) level measurement, and transrectal ultrasound-guided biopsy. The suspicion in the DRE shows prostate cancer alone, without its PSA level, in about 18% of all patients. Furthermore, in patients with PSA levels of 2 ng / mL, the positive predictive value of doubt in the DRE is 5-30% (Vanacore et al. 2017, Loeb and Catalona, 2007). Prostate cancer is classified using the Gleason scoring system according to its morphological characteristics (Gleason and
5 Mellinger, 1974, Munkley et al. 2017). The Gleason grading system that is used to diagnose prostate adenocarcinoma has emerged as a result of a study involving more than 2,900 patients from the 1960s to the 1970s. Donald Gleason elaborated on the histological growth patterns (grade) of prostate adenocarcinoma and performed a clinical correlation analysis such as staging and prognosis. Now, it is one of the strongest prognostic factors for PCa (Montironi et al. 2011, Lopez-Beltran et al. 2006). The Gleason classification system is used to classify prostate tumors based on their histological morphology and patient stratification based on their risk of having lazy or aggressive PCa (Figure 2.2). For ease of classification the prostate tumours are stratified into 5 different glandular patterns referred to as Gleason patterns (Montironi et al. 2011). Gleason models range from 1-5, and represent morphologies of the prostate gland depending on their differentiation. The lower Gleason patterns are well differentiated glands, more similar to the normal morphology of the prostate gland. Higher Gleason models represent poorly differentiated glands and indicate a high risk of PCa. Gleason 1 correlates with the best distinguished and most favorable prognosis. Gleason 5 correlates with the least clear and poor prognosis. The Gleason score, which is shown to be better correlated with the biological behavior of prostate adenocarcinoma, has been developed due to the presence of two or more Gleason patterns in many prostate adenocarcinomas. The sum of the primary and secondary patterns gives the Gleason score (Chen and Zhou, 2016). Gleason patterns 1 and 2 are no longer assigned to needle biopsies. The reason for this is poor reproducibility and poor correlation with the grade of radical prostatectomy (Gordetsky and Epstein, 2016, Cury et al. 2008). The Gleason 3 pattern consists of discrete fabrics of various sizes, such as branching (Gordetsky and Epstein, 2016, Steinberg et al. 1997). The Gleason 4 pattern contains poorly formed, fused cribriform glands (Gordetsky and Epstein, 2016,Baisden et al. 1999). The Gleason 5 pattern consists of tumor layers, individual cells, and cell cords (Gordetsky and Epstein, 2016, Robinson, and Epstein, 2010). Typically, tumors assigned with GS 6 or less are classified as low risk, whereas tumors assigned with GS 7 and GS 8 or higher are classified as medium and high risk, respectively (Lopez-Beltran et al. 2006). Multiple tumours (may) have different GS and reflect the multifocality of the disease (Arora et al. 2004, Ruijter et al. 1996). This makes it difficult to predict the progression of the disease at an early stage. In last years, the original Gleason classification system has been modified to address clinical dilemmas associated with patient risk stratification.
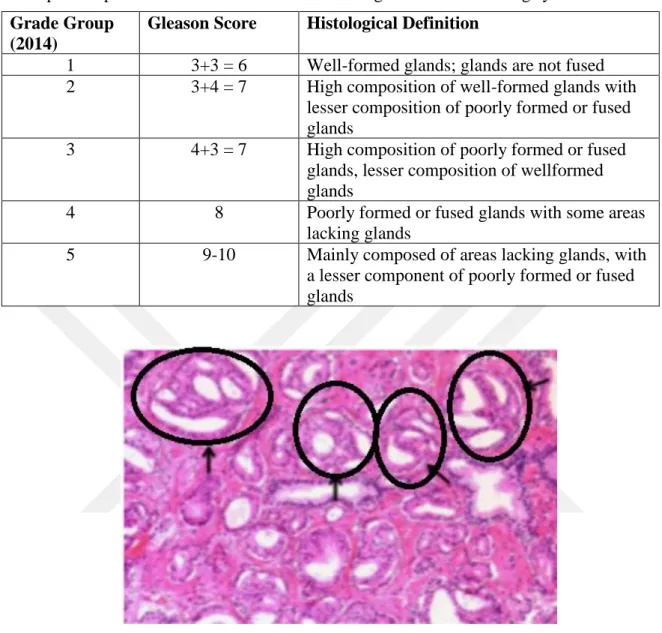
6 In 2014 was held the last conference of the International Society for Urological Pathology (ISUP). They discussed and proposed changes to the existing Gleason grading system, with intention to make clearer guidelines for assigning GS that would more accurately reflect the disease prognosis of PCa patients in order to make proper treatment decisions. An important modification was made to categorize the GS into 5 Grade Groups (Table 2.1) (Shen et al. 2013, Van Der Kwast et al. 2013, Matoso et al. 2016). This is based on evidence that PCa patients with GS 7 tumours in which Gleason pattern 4 is predominant in the area (GS 7 (4+3) have worse prognosis compared to PCa patients with GS 7 tumours in which Gleason pattern 3 is predominant in the area (GS 7 (3+4)) (Amin et al. 2011, Pierorazio et al. 2013). Also, patients with GS 8 tumours have better prognosis than GS 9-10 tumours (Epstein et al. 2016). As a result, the newly proposed classification system separates GS 7 (3 + 4) and GS 8 into their own categories (Table 2.1). Other recommendations offered by this new system are to combine large and small cribriform architectural patterns under the Gleason pattern 4 category, since both morphologies showed a higher probability of poor results (Figure 2.3) (Kweldam CF et al. 2014). In addition, GS 6 tumors are also classified under grade group 1 to clearly reflect its low risk prognosis (Shen et al. 2013, Matoso et al. 2016).
Figure 2.2. The Gleason Scoring System Schematic.Original (left, 1966 & 1967) vs. Modified (right, 2014) (Epstein et al. 2016).
7 Table 2.1. 2014 Gleason Grading System for Prostate Cancer Tumours. Each Grade Group corresponds to a Gleason score from the original Gleason scoring system.
Grade Group (2014)
Gleason Score Histological Definition
1 3+3 = 6 Well-formed glands; glands are not fused 2 3+4 = 7 High composition of well-formed glands with
lesser composition of poorly formed or fused glands
3 4+3 = 7 High composition of poorly formed or fused glands, lesser composition of wellformed glands
4 8 Poorly formed or fused glands with some areas
lacking glands
5 9-10 Mainly composed of areas lacking glands, with a lesser component of poorly formed or fused glands
Figure 2.3. Histological representation of cribriform glands (gleason pattern 4).Cribriform glands are indicated by the black arrows(Epstein et al. 2016).
2.2.3.2.Clinical and Pathological Staging
The tumour, node and metastasis (TNM) staging system was developed in 1992 by the American Joint Committee on Cancer (AJCC) and the International Union Against Cancer (UICC) to help in the separation of low, medium or high risk patients with prostate cancer (Amin MB et al. 2017). Shortly, this system discloses primary tumor spread (T) to the lymph nodes (N) and whether distant metastases have been formed or not (M).It classifies prostatic tumours based on their extension into surrounding or remote areas throughout the body (Table 2.2) (Andreoiu and Cheng et al. 2010, Cheng L et al. 2012). Both clinical and pathological TNM staging is performed in patients with PCa to describe the predicted
8 disease prognosis (Cheng L et al. 2012). Clinical staging is performed before the treatment and reflects evidence of tumor spread using imaging and other modalities (i.e. magnetic resonance imaging (MRI), transrectal ultrasonography (TRUS)) or digital rectal examinations (DREs) (Cheng L et al. 2012, Oon SF et al. 2011). Conversely, pathological staging is usually performed after radical prostatectomy; wherein the entire organ can be assessed histologically for tumor growth in the prostate or outside the prostate. (Ehrlich et
al. 1982). The TNM stage consists of a tumor component (T-stage) that describes the
spread of the tumor in the prostate gland or to adjacent structures (Table 2.2) (Amin MB et
al. 2017, Cheng L et al. 2012). T1 tumors are neither palpable nor detectable during
visualization, but can be detected by biopsy. T2 prostate tumors are large enough to be detected by DRE or TRUS and are confined within the prostate.T3 tumors break through the ‘capsule’ of the prostate and can invade the seminal vesicles.Tumors invading other organs, such as the pelvic wall or rectum, are arranged by T4. TNM also includes a lymph node and distant metastasis component (N and M stages respectively) that explain whether a tumor metastasizes to regional lymph nodes or distant organs (Table 2.2). If regional (pelvic) lymph nodes are affected the N classifier is 1, otherwise it is 0 (not affected) or X (not assessed). Distant metastases are explained by M=1, if no metastases can be found M is 0.
The same scoring system is used for clinical and pathological staging. However, the "p" is placed in front of the stage category in order to represent a pathological staging. In general, TNM is used to predict the outcome of disease and guide treatment decisions (Andreoiu and Cheng et al. 2010, Cheng L et al. 2012).However, clinical staging poorly predicts the pathological stage determined after RP.This is because of multifocality of PCa. As a result, PCa is usually represented by clinical stage when compared with the final pathological stage(Montironi et al. 2011, Andreoiu and Cheng et al. 2010, Cheng L et al. 2012). Classification systems that accurately predict the course of the disease for PCa patients without the need for RP will be ideal for early and potentially more effective treatment. Table 2.2. TNM staging according to the American Joint Committee on Cancer (AJCC) and the International Union Against Cancer (UICC) as of 2016
Stage Clinical Pathological
Tx Primary tumour cannot be assessed -
T0 No evidence of primary tumour -
T1 (a-c)
Clinically inapparent tumour
- T1a: Tumour found in < 5% of resected tissue
9 - T1b: Tumour found in > 5% of resected
tissue
- T1c: Tumour upon needle biopsy
T2 (a-c)
Tumour palpable and confined to prostate
- T2a: Tumour spread within < ½ of one lobe
- T2b: Tumour spread within > ½ of one lobe, but not both lobes
- T2c: Tumour spread to both lobes
Organ-confined tumour (No sub-classification)
T3 (a-b)
Extraprostatic tumour that does not invade adjacent structures
- T3a: Extraprostatic extension
- T3b: Tumour invades seminal vesicles
Extraprostatic Extension - pT3a: Extraprostatic extensions or invasion into bladder neck
- pT3b: Seminal vesicle invasion
T4
Invasion of adjacent structures (except seminal vesicles): external spincter, rectum, bladder, levator muscles and/or pelvic wall
Invasion of rectum, levator muscle or pelvic wall
Nx Regional Lymph nodes not assessed Regional lymph nodes not sampled
N0 No regional lymph node metastasis No positive regional lymph nodes
N1 Metastasis in regional lymph nodes Metastasis in regional lymph nodes
M0 No distant metastasis No distant metastasis
M1 (a-c)
Distant Metastasis
- M1a: Non-regional lymph nodes - M1b: Bone metastasis
- M1c: Other sites with or without bone metastasis
Distant Metastasis
- M1a: Non-regional lymph nodes
- M1b: Bone metastasis - M1c: Other sites with or without bone metastasis
2.2.3.3. Aciner adenocarcinoma
Invasive malign epithelial tumor containing secretory cells. Prostate adenocarcinoma involves a spectrum ranging from well differentiated gland structures, which can be difficult to distinguish with benign glands, to poorly differentiated tumors of which prostate origin is difficult to understand. Morphological features of prostate adenocarcinoma are nuclear anaplasia, invasion, and structural defect. Invasion can be seen in the form of irregular glands, individual irregularities outward from the glands and also in the form of perineural invasion. Structural dysfunction may be in the form of small back to back glands, combined glands, cribriform structures, cords and solid islands (Eble et al. 2004, Mostofi et al. 1993). The prostate adenocarcinoma (AAC) is divided into seven
10 histologic subtypes by the World Health Organization (WHO), including atrophic, pseudohyperplastic, foamy, mucinous, signet ring cell, oncocytic and lymphoepithelioma-like. These histological subtypes may be found alone, or may be accompanied by classical AAC (Eble et al. 2004). 68 cases are reported in the literature that rarely seen in prostate (Ahn et al. 1991, Pedro et al. 2006). Extraprostatic spread of these tumors is frequent, but distant organ metastases are not a frequent finding (Minei et al. 2001, McKenney et al. 2004). Macroscopic identification of prostate adenocarcinoma in radical prostatectomy specimens is difficult, it requires a microscopic examination. However, in grayish yellow color, the borders are seen as a hard area that can not be completely distinguished from the surrounding tissue. Microscopically, prostate adenocarcinoma exhibits a broad spectrum; from anaplastic tumor to well differentiated neoplasm, which is difficult to distinguish from nonneoplastic gland (Rosai and Ackerman 2004). Most prostate adenocarcinomas arise from one or more pattern-forming acini. The diagnosis depends on the combination of structural and cytologic symptoms. The features seen in the light microscope are usually adequate for diagnosis (Bostwick et al. 2003). In gland-forming carcinomas, glands are more crowded than prostate tissue. Glands in the prostate adenocarcinoma typically grow indiscriminately. Glands are placed perpendicular to each other. Another pattern of infiltrating structure is the presence of small atypical glands between large benign glands. The difference between glandular differentiation, cribriform-shaped formations, unified glands, distorted gland structures and benign glands, becomes more evident based on the structural pattern. Indifferentiated prostate cancer is characterized by solid islands, cell cords, and isolated individual cells (Eble et al. 2004).
2.3.Epigenetics
New opportunities for cancer diagnosis and screening can arise from the identification of epigenetic changes associated with cancer. Epigenetics was first introduced by Conrad Waddington in 1942 (El Hajj et al. 2017). Epigenetics refers to inherited changes in gene expression that are not based on the underlying DNA sequence (Henikoff and Matzke, 1997). DNA is compressed into a chromatin structure with the nucleosome in the eukaryotic nucleus. The histone octamer contains two elements of the nuclear histone (H3, H4, H2A and H2B) (Luger et al. 1997, Chen et al. 2014). Packing of DNA into chromatin creates a potential barrier to the factors that use DNA as a template (Chen et al. 2014). Each normal somatic cell contains the same genome consisting of about three billion base pairs. Numerous epigenetic modifications regulate transcriptional access to genes of a
11 particular cell type and developmental stage. There are essentially three changes that regulate the epigenetic mechanisms of gene expression and the chromatin structure. These are; DNA methylation, histone covalent modification, which are the main protein components of chromatin and miRNAs (Chen et al. 2014).
Epigenetic arrangements in the form of DNA methylation patterns and histone modifications regulate gene regulation (El Hajj et al. 2017, Jaenisch and Bird, 2003). DNA methylation means the covalent attachment of a methyl group to the 5 position of the cytosine pyrimidine ring (Bestor, 2000) and represents a relatively stable and conserved signal which makes it an attractive option for epigenetic studies. The most pronounced epigenetic modification of DNA is methylation, which occurs primarily at the carbon 5 'position of the cytosine in the context of CpG dinucleotides. Most of the CpG isoform and promoter region are demethylated while genomic non-coding regions usually cause genomic instability. During differentiation, development or disease processes, supporting methylation is associated with transcriptional silencing (El Hajj et al. 2017, Smith and Meissner, 2013, Weber and Schubeler, 2007). Changes in chromatin structure occur via post-translational modifications of the histone such as acetylation, methylation and phosphorylation. These modifications can change the conformation of chromatin between an open, transcriptionally active form known as euchromatin and a condensed, transcriptionally inactive form known as heterochromatin (Jenuwein and Allis, 2001). 2.3.1.DNA methylation
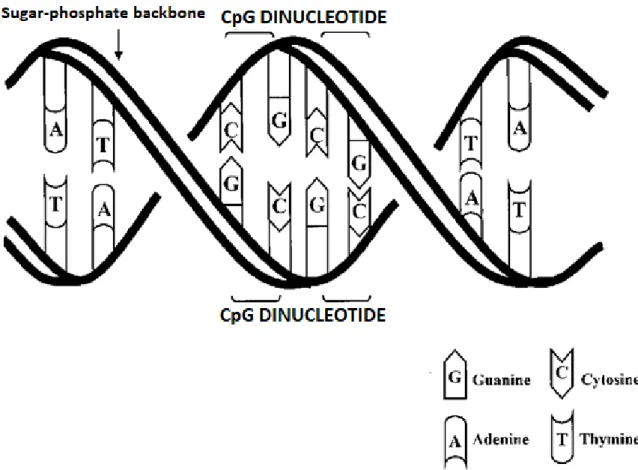
DNA methylation plays an important role in many different biological processes such as embryonic development, transcription, chromatin formation, X chromosome inactivation, genomic imprinting, genomic instability and carcinogenesis (Cheung et al. 2009). Methylation is the only known epigenetic modification of DNA. In addition, post-translational histone modifications are also epigenetic changes, such as DNA methylation (Kouzarides, 2007). Generally, methylation occurs in 5-cytoplasm. Many domains of the genome include CpG dinucleotides (Figure 2.4.). These domains are termed CpG islands and are usually found in the promoter regions of genes in the human genome and contain 70% CpG nucleotides (Saxonov et al. 2006). In normal somatic cells, most of the CpG islands are usually found in unmethylated form. The abnormal hypermethylation of CpG islands of some tumor suppressor genes is associated with tumorigenesis. Although the cause of abnormal methylation is unknown, it is suggested that alteration or degradation of the regulation of DNA methyltransferases or some chromatin binding proteins are
12 responsible for this. Recent studies have highlighted DNA methylation as a marker that can be used in the early detection of cancer in biological specimens such as serum, plasma or urine (Laird, 2003). For example, hypermethylation of 31% of the GSTP1 gene in the prostate cancer and 25% of the APC tumor suppressor gene in the esophageal adenocarcinoma can be detected in the plasma as DNA methylation markers in both tumors (Chuang, 2003).
Figure 2.4. DNA backbone and CpG dinucleotides. DNA double helix and CpG dinucleotide pairs. DNA structure with opposing base pairs arranged on a double helix sugar–phosphate backbone. CpG dinucleotide pair units that are the sites for possiblemethylation are outlined.
2.3.2.Molecular mechanism of DNA methylation
DNA methylation is the result of enzyme-induced chemical modification. As a result of covalent attachment of a methyl (-CH3) group to the 5 carbon atom on the cytosine base cytosine nucleotide is getting methylated. This event is regulated by a group of enzymes called DNA methyltransferases. The methyl group is provided by S-adenosyl methionine (SAM). After methylation, S-adenosyl methionine (SAM) is converted to S-adenosyl
13 homocysteine (SAH). SAH is converted back to SAM through the folate-cobalamin pathway (Figure 2.5).
There are five types of DNA methyltransferase genes, DNMT1, DNMT2, DNMT3L, DNMT3A, DNMT3B. These developmentally regulated genes play a critical role in the realization and regulation of DNA methylation. DNMT1 is responsible for the regulation of cytosine methylation. Some of the epigenetic markers on the DNA are transferred from progeny to progeny exactly. These epigenetic markers need to pass to the offspring parental.During DNA replication in the offspring cells, the parental features are transferred to the cells by the DNMT1 enzyme. During this transfer, the DNMT1 protein in cooperation with the MECP2, which is a methyl-CpG binding protein, methylates the semi-methylated DNA, thereby allowing the parental features to be transferred to the offspring cells (Kimura and Shiota, 2003).It is known that DNMT1 plays a role in the suppression of some target genes by interacting with many different proteins such as transcription factors (STAT3, HP1), histone modifying molecules (HDAC1, HDAC2) (Robertson et al, 2000, Rountree et al. 2000, Smallwood et al. 2007, Zhang et al. 2005). The DNA methyltransferase-3 proteins (DNMT3) are responsible for de novo methylation of CpG islands, i.e. the newly formed methylation of previously unmethylated bases. DNMT3A is a protein responsible for parental imprinting. Imprinted genes are methylated in each parental allele and are expressed as monoallergenic.
Although DNMT3A, DNMT3B and DNMT3L genes are thought to lack of any methyl transfer activity, it is suggested that DNMT3B is responsible for the methylation of centromeric satellite repeat sequences, and that mutations in the DNMT3B 13 gene lead to ICF (centromeric heterochromatin instability) syndrome (Jeanpierre et al. 1993).
14 Figure.2.5. Methylation cycle. Methylation of the 5-carbon on the cytosine residue is executed by the DNA methyltransferase enzyme, which uses a methyl group from S-adenyl methionine (SAM). This is converted to S-S-adenyl homocysteine (SAH), which is then broken down to homocysteine (HCY) and adenosine. SAM is reconstituted from HCY by methionine. Folate and cobalamin are required for and provide the methyl groups for this reaction.
2.4.DNA methylation changes in cancer
Abnormal patterns of DNA methylation are one of the most common changes found in cancer (Esteller et al. 2001, Esteller, 1999, Feinberg, 1999, Feinberg, and Vogelstein, 1983, Feinberg, and Vogelstein, 1983, Fleisher et al. 1999, Irizarry et al. 2009, Issa, 2004). Cancer cells exhibit a global loss of DNA methylation in addition to a gain of methylation in some CpG islands (Issa, 2004). These changes provide tumour cells with a growth advantage by increasing their genetic instability and allowing them to accrue progressive changes that support their continued proliferation and metastasis (Robertson, 2005). 2.4.1.Global genomic hypomethylation
The loss of DNA methylation is the first epigenetic change in cancer cells (Feinberg, and Vogelstein, 1983). Global genomic hypomethylation is largely due to the loss of
15 methylation in the repetitive DNA sequences (Esteller, 2008), and is universally seen in several cancers, as well as some pre-malign adenomas (Ehrlich, 2002). Furthermore, the degree of hypomethylation was associated with disease severity and metastatic potential (Feinberg, and Vogelstein, 1983, Esteller, 2008).
Depending on the cancer, global DNA hypomethylation has many functional effects.By weakening transcriptional repression, DNA hypomethylation can facilitate chromosomal instability, which is another distinguishing feature of tumor cells (Robertson, 2005). Experiments in which methylation was depleted showed that loss of DNA methylation leads to aneuploidy and chromosomal rearrangements (Karpf and Matsui, 2005), which are believed to be mainly due to the loss of methylated cytosines in centromeric or pericentric regions. (Eden et al. 2003).
2.4.2.Single-locus DNA hypomethylation
DNA hypomethylation is mainly described to occur in satellite DNA of centromeric regions, Alu regions and long interspersed elements (Ehrlich, 2009). Hypomethylation in the coding sequences is also observed in cancer (Ehrlich, 2002). In a recent study, it was found that CpG islands could be methylated normally in somatic tissues (Strichman-Almashanu et al., 2002), and hypomethylation of these islands in cancers could activate nearby genes (Feinberg and Tycko, 2004). Hypomethylation was also found in genes whose activation contributes to tumor formation (Feinberg and Tycko, 2004). There are several genes that are activated by hypomethylation in cancer, including oncogenes such as leukemia homeobox proto-oncogenes (HOX11) (Watt et al. 2000), v-myc myelocytomatosis viral oncogene homolog (C-MYC) in colorectal cancer (Sharrard et al. 1992), and v-Ha-ras Harvey rat sarcoma viral oncogene homolog (HRAS) in melanoma (Feinberg, and Vogelstein, 1983), as well as non oncogenes such as trefoil factor 1 (pS2) in breast cancer, which is implicated in the control of cell proliferation (Martin et al. 1997), and carbonic anhydrase 9 (MN/CA9) in renal cell carcinoma (Cho et al. 2001). Furthermore, hypomethylation in genes can disrupt genomic imprinting through the activation of normally silent alleles, and there is a large series of cancers that exhibit such imprinting loss (Feinberg, 1999).
2.4.3.DNA hypermethylation
The hypermethylation of DNA in cancer occurs simultaneously with global genomic hypomethylation.Hypermethylation of DNA frequently occurs in the CpG islands of gene
16 promoters and in most cases is realted with transcriptional silencing (Esteller, 2008, Rauch
et al. 2008). It is estimated that an average of 600 of about 45,000 CpG islands in the
genome is hypermethylated in cancer (Costello et al. 2000). Hypermethylation of promoters is an important mechanism for inactivation of tumour suppressor genes (Herman and Baylin, 2003), and aberrant hypermethylation and downregulation have been observed in genes involved in the cell cycle, DNA repair, cell signaling, chromatin remodeling, transcription, and apoptosis for almost every type of tumour (Robertson, 2005).
Studies have found that CpG hypermethylation patterns occur in cancer-specific fashion (Costello et al. 2000), in both sporadic and hereditary cancers of the same tumor type (Esteller et al. 2001).In these studies, it was found that cancer-related DNA methylation changed according to the type of cancer being investigated (Esteller et al. 2001, Costello et
al. 2000). It has been suggested that this may be due to different growth selective pressures
or individual CpG island sensitivities for each tumor type (Costello et al. 2000). Promoter hypermethylation in certain CpG islands may provide a selective advantage for the survival of a specific cell type (Esteller, 2002). Therefore, the reason for certain genes to be downregulated in one type of cancer versus another is because there are important cellular consequences for the lack of expression of that gene that promotes the growth of tumors of a particular tissue (Esteller, 2002). Hypermethylated genes known in different cancers include glutathione S-transferase P (GSTP1) in prostate cancer (Wu et al. 2011), breast cancer 1, early onset (BRCA1) in breast and ovarian cancers (Esteller et al. 2001, Esteller
et al. 2000), and mutL homolog 1, colon cancer, nonpolyposis type 2 (hMLH1) in gastric,
colorectal, and endothelial cancers (Fleisher et al. 1999, Esteller, et al. 2001, Herman et al. 1998)
2.4.4.CpG island methylator phenotype
One theory shows that there is a CpG island methylator phenotype (CIMP) in human cancers. This theory was developed from studies in colorectal cancer and revealed a subset of cancers that showed a 3-5 fold increase in the frequency of aberrant hypermethylation in multiple loci, and this pattern of methylation in a cluster of genes was not seen in the remaining cases (Toyota et al. 1999). According to this theory, CIMP cancers are biologically unique compared to other cancers with differences in genetics, histology, barepathology and clinical features (Issa, 2004). However, this is still a controversial concept without a consensus in the selection of genes involved in a panel to distinguish CIMP cancers from other types (Feinberg and Tycko, 2004).
17 2.5.Diagnostic Biomarkers for Prostate Cancer
2.5.1.What are Biomarkers?
A common target of many PCa diagnostic tests is to accurately identify patients with PCa prior to or upon biopsy while minimizing the false positive and false negative results.Biomarkers are characterized as factors that can be measured to indicate normal or abnormal biology in a patient or to indicate a response to therapeutic interventions (Biomarkers Definitions Working Group, 2001). They can also be classified as diagnostic, prognostic, predictive and therapeutic biomarkers to reflect their intended clinical use.Genetic, epigenetic and proteomic changes have been studied in patients with PCa who demonstrate a strong potential as diagnostic biomarkers for early detection of the disease (Falzarano et al. 2015, Verma et al. 2011, Hatakeyama et al. 2016). The most clinically relevant and useful diagnostic biomarkers are those that can be detected in biological samples, such as urine, serum and biopsy tissue, which are obtained through non-invasive or minimally invasive procedures.
2.5.2.Genetic Diagnostic Biomarkers 2.5.2.1.Chromosomal Alterations
Genetic changes in PCa tumors are often associated with a gain or loss of gene expression (Barbieri et al. 2013). More specifically, chromosomal rearrangements often arise for the disregulation of gene expression. Chromosomal anomalies include amplifications (chromosome 8q), deletions (chromosome 8p), inversions and translocations (Qian et al. 1995, Taylor et al. 2010). One of the most common chromosomal rearrangements observed in PCa involves deletion on chromosome 21 to create a TMPRSS2:ERG gene confluence (Tomlins SA et al. 2005, Demichelis F et al. 2007, Winnes M et al. 2007). TMPRSS2 is an androgen-regulated gene which encodes Transmembrane Protease, Serine 2 and is located upstream of the ERG gene, which is a part of the ETS gene family of transcription factors. As a result of this gene fusion, ERG expression is increased and causes aberrant expression of downstream target genes that promote cell motility and carcinogenesis (Tomlins SA et al. 2005, Winnes M et al. 2007). TMPRSS2: ERG gene fusion occurs in approximately 50% of PCa patients, mainly due to heterogeneity of the disease. It is also reported that TMPRSS2 fuses with other members of the ETS gene family, such as ETV1 and ETV4 (Winnes M et al. 2007).
18 TMPRSS2:ERG gene fusion is assumed to occur during the early development of PCa with data indicating that lower levels were found in a more aggressive disease (Scheble VJ
et al. 2012). Thus, TMPRSS2: ERG participates as a diagnostic biomarker for early
diagnosis of prostate cancer. The studies examined the efficacy of the synthesis of the TMPRSS2: ERG gene to create patients with PCa using urinary deposits (Hessels D et al. 2007). Specificity of this biomarker is high (93%), but sensitivity is low (37%) (Hessels D
et al. 2007). Combining the biomarker TMPRSS2: ERG with other promising diagnostic
biomarkers can improve overall detection rate. 2.5.2.2.Long non-coding RNAs
Only 2% of transcribed RNAs encode proteins, while the remaining RNAs are called non-coding RNAs (ncRNAs) (International Human Genome Sequencing, 2004, Zhang et al. 2017). ncRNAs do not have a valid open reading frame, and they do not have the ability to code a protein (Consortium et al, 2007, Carninci et al. 2005, Ponting and Belgard 2010, Li
et al 2017). They are grouped into two groups, short ncRNAs and long ncRNAs. Short
ncRNAs are 200 nucleotides, which include RNAs that interact with piwi, small nucleolar RNAs (snRNA), M and others (Zhang et al. 2017, Michalik et al. 2014). RNAs longer than 200 nucleotides are called lncRNA (Li et al. 2017, Sana et al. 2012, Kapranov et al. 2007). There are a wide variety of ncRNAs in this group, including intergenic ncRNAs, long intronic ncRNAs, and pseudogen RNAs (Li et al. 2017, Sana et al. 2012). Long non-coding RNAs are transcribed by RNA Polymerase II and are thought to be regulatory elements that do not encode proteins. Prostate Cancer Antigen 3 (PCA3) is a long non-coding RNA molecule that is expressed only in the prostate by the DD3 gene (Bussemakers MJG et al. 1999). Especially PCA3 has no known function and is over expressed in PCA, which makes it a promising diagnostik marker. In 2012, the Food and Drug Administration (FDA) approved the use of PCA3 as a diagnostic test called Progensa PCA3 for men over the age of 50 years to help in the decision to conduct the prostate biopsy exams (Deras IL et al. 2008). The PCA3 test involves the calculation of the PCA3 score based on the PCA3 and PSA mRNA levels in post-DRE urine. The PCA3 score has been reported to exceed the PCa display capacity of tPSA by biopsy (Falzarano et al. 2015, Capoluongo E et al. 2014). Patients with a PCA3 score> 25 are advised to perform an initial or repeat biopsy examination in order to confirm the diagnosis of Pca (Capoluongo E et al. 2014).
19 2.5.3.Epigenetic Diagnostic Biomarkers
2.5.3.1.DNA Methylation Biomarkers
DNA methylation is an epigenetic modification that occurs when a methyl group is added to the 5’ carbon of a cytosine base located adjacent to a guanine base (CpG) (Jurkowska RZ et al. 2011, Deaton A and Bird A, 2011). Regions rich in CpG-dinucleotides (> 50%) are called CpG Islands and are often associated with the promoter region of genes. It has been reported that changes in DNA methylation patterns are related with the development of various cancer types (Sproul D and Meehan RR, 2013, Mikeska T and Craig JM, 2014). Typically, there is a global loss of methylation, accompanied by gene-specific methylation enrichment in the gene promoter zones, including tumor suppressor genes and oncogenes, respectively. In particular, in PCa, hypermethylation of DNA has been intensively studied and the hypermethylation of key genetic players, including GSTP1, APC and RASSF1A, have been reported by many groups (Strand SH et al. 2014, Steiner I et al 2010, Liu L et
al. 2002, Jerónimo C et al. 2011). These genes have been studied individually and in
panels for their ability to serve as biomarkers for the diagnosis and prognosis of PCa (Blute ML et al. 2015, Rouprêt M et al. 2007, Trock BJ et al. 2012, Brikun I et al. 2014, Troyer DA et al. 2009).
Identification of aberrantly methylated genes as potential PCa biomarkers has aroused great interest because of the stability of DNA, which can be easily detected in urine, serum and biopsy samples (Mikeska T and Craig JM, 2014). GSTP1 is the most commonly hypermethylated gene in PCa tumors and is found in about 90% of all cases (Van Neste L
et al. 2012), making it a promising biomarker for PCa detection. Similarly, promoter
hypermethylation of APC, RASSF1A and RARB2 methylation has been extensively studied and is often found in PCa (Liu L et al. 2002, Chen Y et al. 2013). Several hypermethylated genes have been combined to improve the diagnostic ability of any individual methylation biomarker for detection of PCa (Brikun I et al. 2014, Vasiljević N
et al. 2011, Møller M et al. 2017). In addition, genome-wide methylation studies have also
been performed to identify novel differentially methylated genes outside of promoter regions that can also increase PCa diagnosis (Yang B et al. 2013, Devaney JM et al. 2015, Bhasin JM et al. 2015). Because of the many proposed methylation biomarkers, further validation is necessary before implementing them into clinical practice.
20 2.5.3.2.MicroRNA
miRNAs are a class of conserved, small, noncoding RNAs that are responsible for posttranslational, epigenetic regulation of gene expression, ranging in length from 19 to 25 nucleotides (Malumbres M, 2013, Oliveto et al. 2017, Celano et al. 2017). The first miRNA lin-4 was discovered in 1993 by Victor Ambros and Gary Ruvkun (Monteleone and Lutz, 2017, Lee et al. 1993). They bind to the 3 'coding region of the target mRNA and inhibit the expression of multiple target genes (Lin and Gregory, 2015, Masuda et al. 2017). A single miRNA molecule can regulate the expression of over 200 transcripts (Malumbres M, 2013). For this reason, dysregulation of a single miRNA may have a significant effect on cancer development. Today, more than 2500 types of miRNA have been detected in humans (Masuda et al. 2017, Michael et al. 2003). Recent studies have shown that miRNAsplay important roles in many critical biological processes including development, proliferation, differentiation, apoptosis, tumor formation, signal transduction, organ development, and hematopoietic lineage differentiation (Bartel, 2009, Huang et al. 2011). In PCa, the expression of miRNA is changed in PCa and was studied on several biological samples, such as urine, tissue and serum (Bertoli G et al. 2016). Some of the most common dysregulated miRNAsreported in PCa include hsa-mir-192, hsa-mir-572, hsa-mir-7a, hsa-mir-21, hsa-mir-99a, hsa-mir-141, hsa-mir-145, hsa-mir-200c, hsa-mir-221 and hsa-mir-375. Many of these miRNAsare observed to be dysregulated across multiple types of samples. In some studies miRNAs have been shown to be downregulated in tumors whereas other studies have shown that miRNAs in tumors are generally upregulated. (Vanacore et al. 2017, Lu et al. 2005). For example, it was reported that let-7a and hsa-mir-21 are upregulated, and hsa-mir-145 and hsa-mir-192 are downregulated both in tissues and in blood samples in patients with PCa compared to healthy control patients (Wach S et al. 2012, Kelly BD et al. 2015, Sandeep K. et al.2016). This characteristic makes them ideal biomarkers for early detection of PCa. In addition, multiple miRNAs have also been combined in a biomarker panel to improve the ability of detecting of individual miRNAs (Haldrup C et al. 2014, Moltzahn F et al. 2011, Chen Z-H et al. 2012). Although the miRNA biology area is relatively new, miRNAs serve as a promising source of biological information that can be used as evidence for the diagnosis of PCa. In spite of the fact that most of the complexity of miRNA is not fully clarified in both prostate cancer and cancer development in general, the importance of miRNA has been shown in several key oncogenic pathways in prostate cancer. Especially in prostate cancer, regulation of
21 miRNAs with androgen receptor signaling pathways and miRNAs on this pathway attracts attention. Interaction of miRNAs with other key signaling pathways in prostate cancer, such as PTEN / ACT signaling pathways, is also discussed (Catto et al. 2011, Jackson et
al. 2014). Studies have shown that miRNAs differentially expressed in tumor tissues,
function as prognostic and therapeutic biomarkers for prostate cancer in body fluids such as plasma, serum or urine (Goto et al. 2015).
2.5.4.Proteomic Diagnostic Biomarkers
Protein expression can be altered in PCa through numerous mechanisms such as abnormal miRNA-NA expression, chromosomal rearrangements, DNA methylation, and histone modifications. Abnormally expressed proteins have been discovered/suggested as diagnostic biomarkers for early detection of PCa (Alinezhad S et al. 2016, Kristiansen G et
al. 2008, Uetsuki H et al. 2005). As noted previously, PSA codes for a glycoprotein which
is over-expressed in PCa. (Salman et al. 2015, Stamey et al. 2004, Balk, 2003). Although it is not PCa specific, is the most widely used biomarker for PCa screening, despite recommendations against its use. GOLPH2 is a golgi membrane antigen that is observed to be up regulated in about 90% of patients with PCa (Kristiansen G et al. 2008, Wei S et al. 2008). In addition to its high sensitivity, it can be tested in urine and becomes a promising protein biomarker for detection of PCa (Laxman B et al. 2008). Other overexpressed proteins in PCa include Alphamethyl-CoA racemase (AMACR) and Early Prostate Cancer Antigen (EPCA), all of which have also been proposed as potential diagnostic biomarkers for PCa detection (Alinezhad S et al. 2016, Kristiansen G et al. 2008, Uetsuki H et al. 2005).
2.5.5.Diagnostic Biomarker Panels
Many of the PCa biomarkers mentioned earlier have been studied in combination to improve their ability to detect individual biomarkers.When biomarkers are combined, their diagnostic power is added and possible false positive and false negative results can be minimized.Recently, new biomarker panels have emerged that show strong diagnostic potential and perform better than the traditional PSA screening test (Falzarano et al. 2015). In addition to their intended use for PCa diagnosis, some biomarker panels may also provide prognostic information before performing any invasive procedure.Prospectively, combining biomarkers with the strongest diagnostic potential will have the greatest success in clinical practice to ensure patients that are given an early and accurate diagnosis.
22 2.5.5.1.Prostate Health Index
The Prostate Health Index (PHI) is a diagnostic test used to determine the likelihood of detecting PCa after biopsy in patients with serum PSA levels within the diagnostic gray zone and a negative DRE (Falzarano et al. 2015, Jansen FH et al. 2010, Lazzeri M et al. 2013). The PHI was approved by the FDA in 2012 and calculated a score based on tPSA,% fPSA, and -2proPSA levels.Compared to individual PSA measurements, it has a more predictive ability to distinguish between benign and malign states of the prostate gland in men aged 50 years and older, since in men with PCa are more likely to have a higher PHI(Jansen FH et al. 2010, Lazzeri M et al. 2013).
2.5.5.2.4Kscore
Currently, there are no reliable diagnostic tests that can distinguish between low and high-risk PCa during initial screening. However, 4-Kalikrein (4Kscore) was developed to determine the risk of having an aggressive PCa before initial or repeated biopsy tests (Braun K et al. 2016, Vickers AJ et al. 2010). 4Kscore is calculated based on an algorithm combining tPSA, fPSA, intact PSA and human kallikrein 2 levels in serum to create a probability of 0-100%. It will also consider clinical information of the patients, such as age, history of previous biopsy and positive or negative DRE. The 4Kscore is not approved by the FDA, but there is evidence that it has a strong potential as a pre-treatment prognostic marker to differentiate between aggressive and lazy PCa (Falzarano et al. 2015).
2.5.5.3.Mi-Prostate Score
As noted earlier, the TMPRSS2:ERG gene fusion occurs in about 50% of patients with PCa (Tomlins SA et al. 2005). Although it has a high specificity, it is limited by its low sensitivity (Hessels D et al. 2007). However, when combined with the detection of PCA3, the sensitivity was increased from 62% only for PCA3 to 73% when combined with TMPRSS2:ERG (Hessels D et al. 2007). A diagnostic test called "Mi-prostate Score" (Mi-PS) measures TMPRSS2:ERG levels and PCA3 levels in urine and serum PSA to create a score that predicts PCa within patients (Tomlins SA et al. 2016, Salami SS et al. 2013).In a recent study, the test was reported to have a sensitivity of 80% and a specificity of 90% (Salami SS et al. 2013).
23 2.5.6.Limitations of the Current Diagnostic Biomarkers
Many of the above-mentioned biomarkers have been proposed to improve the PCa detection (Verma et al. 2011). Ideally, biomarkers that are stable and easily detectable in biofluids (ie, urine, serum, whole blood) are suitable because they can be obtained from patients without performing invasive procedures. However, many clinical biomarkers have been proposed and require extensive validation in large multinational cohorts before being applied for widespread clinical use. For this reason, the current gold standard for PCa diagnosis is the histopathological examination of needle biopsy, which is limited by the ability to detect PCa due to sampling bias (Heidenreich et al. 2013, Stock et al. 2008, Patel and Jones, 2009). If no PCa is detected on the biopsy, there is no reliable diagnostic test that can confirm whether patients initially receiving a negative biopsy result are positive for PCa. Despite the emergence of many promising diagnostic biomarkers for PCa, markers that specifically identify patients with PCA with negative biopsy are warranted. 2.6.Aim of the thesis
In this study, methylation changes in hsa-mir-192, hsa-mir-512-5p, hsa-mir-513a-2 and hsa-mir-572 oncomir microRNAshave been studied in prostate cancer.It is aimed to analyze the promoter methylation status and expression changes of these microRNAs by methylation specific PCR (MSP) and real time PCR, respectively. Subsequently, the specific promoter methylation changes of miRNAs that shown to be significant will be investigated. In this study, possible tumor suppressor potentials of miRNAs will be shown.
24 3.MATERIALS AND METHODS
3.1.Required Devices • Spectrophotometer
• Runik Thermal Cycler (SACEM) • Real-Time Machine (Bio Rad)
• Horizontal Electrophoresis System (Major Science) • Electrophoresis Power Supply
• Gel Screening System
• IncuBlock (Denville Scientific) • Vortex Mixer (Stuart)
• Spectrafuge Mini Sentrifuge (Labnet) • Microfuge Centrifuge (Beckman Coulter) • Microwave (Altus)
• Big Centrifuge Machine (Nuve NF 1200) 3.2.Required Materials
• Quick-RNA FFPE Kit (Zymo Research) • MiScript Reverse Transcription Kit (Qiagen) • SensiFast Sybr Lo-ROX Kit (Bioline)
• Quick-DNA Miniprep Plus Kit (Zymo Research) • EZ DNA Methylation-Gold Kit (Zymo Research) • ZymoTaq qPCR Premix (Zymo Research)
• Universal Primer (Quanta Bio) • p-Xylene (Merck)
• O’GeneRuler DNA ladder Mix (Thermo Scientific) • UltraPure Agarose (Invitrogen)
25 • Tris Base (Fisher Bioreagents)
• Ethidium Bromide (AppliChem) • Proteinase K
• ddH2O • Ethanol %100 • Ethanol %75 3.3.Sample Collection
Tissue specimens obtained from 50 paraffin embedded tissue blocks with Adenomyomatous hyperplasia (benign protate tissues) diagnosis and 30 blocks with prostatic adenocarcinoma (malign prostate tissues) diagnosis were used as study material at Bezmialem Vakıf University from Medical Pathology Department’s archive. All these materials were collected by the decision of ethics committee.For each sample, sections were takenfrom paraffin-embedded blocks in quantity of 100 micron for isolation of DNA and RNA and were transferred to 1,5 ml DNAseRNAse-free tubes.
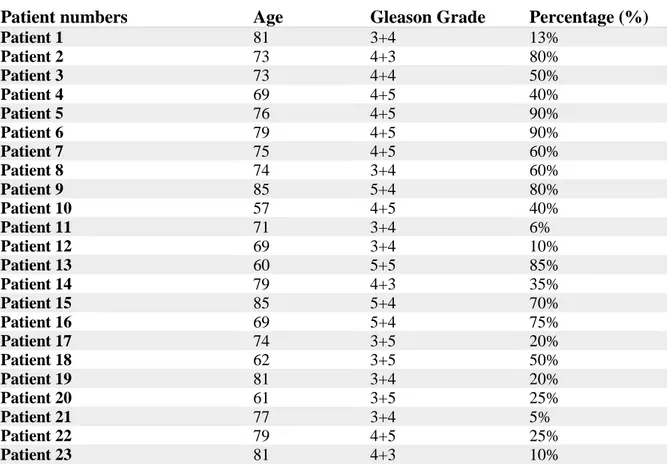
Table 3.1. Ages and gleason grades of patients with Prostatic Aciner Adenocarcinoma
Patient numbers Age Gleason Grade Percentage (%)
Patient 1 81 3+4 13% Patient 2 73 4+3 80% Patient 3 73 4+4 50% Patient 4 69 4+5 40% Patient 5 76 4+5 90% Patient 6 79 4+5 90% Patient 7 75 4+5 60% Patient 8 74 3+4 60% Patient 9 85 5+4 80% Patient 10 57 4+5 40% Patient 11 71 3+4 6% Patient 12 69 3+4 10% Patient 13 60 5+5 85% Patient 14 79 4+3 35% Patient 15 85 5+4 70% Patient 16 69 5+4 75% Patient 17 74 3+5 20% Patient 18 62 3+5 50% Patient 19 81 3+4 20% Patient 20 61 3+5 25% Patient 21 77 3+4 5% Patient 22 79 4+5 25% Patient 23 81 4+3 10%
26 Patient 24 77 3+4 21% Patient 25 62 3+4 25% Patient 26 68 4+3 30% Patient 27 68 5+4 65% Patient 28 75 4+3 18% Patient 29 65 5+4 20% Patient 30 80 3+4 15% 3.4.RNA Isolation
Benign and Malign tissue sections from each patient were obtained from formalin-fixed, paraffin-embedded (FFPE) blocks. RNAs were isolated from patient tissues that were collected after examination. All the samples were stored in Medical Pathology archive at room temperature until used for DNA and RNA isolations. RNA was isolated with the Quick-RNA FFPE Kit (Zymo Research) following the protocol suggested by the manufacturer with some modifications.1 ml of xylene was added to the samples and vortexed vigorously for 30 seconds. Then the samples left in Shaker for 1 hour at 24 °C and centrifuged at 10,000 x g for 2 minutes. Xylene was removed and discarded. The samples were washed twice with 1 ml ethanol (100 %), 1 ml ethanol (75 %), and1 ml ddIH2O, respectively and each time incubated for 5 minutes with gentle rocking.Then supernatant was removed and 400µl of Deparaffinization Solution was added to the samples, vortexed and incubated for 3 minutes at 55°C. Then centrifuged at 10,000 x g for 1 minute. To the deparaffinized tissue samples were added 95 µl of DNAse/RNAse free water, 95 µl of 2X Digestion Buffer and 10 µl of Proteinase Kand incubated at 55°C for 1 hour. After digestion, the samples were incubated at 65°C for 15 minutes in order to be de-crosslinked. 600 µl of RNA Lysis Buffer was added to the tubes and centrifuged at16,000 x g for 2 minutes. The supernatant was transferred to an RNase-free tube and mixed with 1 volume of ethanol (96 %). Then mixture was transferred into a Zymo-Spin™ IIC Column2 in a Collection Tube and centrifuged at 12,000 x g for 20 seconds and the flow-through was discarded. 400 µl of RNA Wash Buffer was added to the columns, centrifuged at 12,000 x g for 20. Then 5 µl of DNAse and 75 µl of Digestion Buffer were added and incubated at room temperature for 15 minutes. After incubation 400 µl of RNA Prep Buffer was added to the columns, centrifugedat 12,000 x g for 20 seconds and the flow-through was discarded. 700 µl of RNA Wash Buffer was added to the columns, centrifuged at 16,000 x g for 2 minutesto make sure of complete removal of the wash buffer. The columns were transferred carefully into an RNAse-free tubes (1.5 ml). 50 µl of
27 DNase/RNase-Free Water was added directly to the column matrix and centrifuged to elute RNA.
3.4.1.Determination of the concentration and quality of the isolated RNAs
3 μl from all isolated RNA samples were taken and their concentrations and quality assays were measured using a Spectrophotometer at 260 nm and 280 nm wavelengths.
3.5.cDNA synthesis
CDNA synthesis from total RNA was performed using commercial MiScript Reverse Transcription Kit (Qiagen) in accordance with the manufacturer's instructions. The mixture was prepared as in the Table 3.2. and Table 3.3. for each sample. The synthesis protocol is as follows;
Table 3.2. Mix amounts of cDNA synthesis. Step 1.
Mix Amount
Poly A tailing buffer 1 μl Poly A Polymerase 0,5 μl
miRNA 3,5 μl
Total Volume 5 μl
Table 3.3. Mix amounts of cDNA synthesis. Step 2.
Mix Amount
Poly A tailing reaction mix 5 μl
Hsa-mir-NA cDNA reaction mix 4,5 μl
Reverse Transcriptase 0,5 μl
Total Volume 10 μl
All mixture operations were carried out on ice.5 μl of mixture from the step 1 was incubated in the PCR machineat 37°C for 20 minutes andat 70°C for 5 minutes respectively.10 μl of mixture from the step 2 was incubated in the PCR machineat 42°C for 20 minutes andat 85°C for 5 minutes.The obtained cDNAs were stored at -20°C for later use.