EFFECTS OF EXCHANGE RATES ON CORPORATE PROFITS: A TOBIT
ANALYSIS1
Asst. Prof. Dr. Nazlı KARAMOLLAOĞLU2
ABSTRACT
Using a novel dataset on Turkish manufacturing firms covering 22 industries and 45,712 firms, we investigate the impact of real exchange rate fluctuations on firm level corporate profits. Our estimation results do not present strong evidence on the impact of exchange rate variations on firm level profits. The results are not robust to the industry specific exchange rate series constructed using different weighting schemes showing the importance of the choice of the exchange rate series used in the analysis. Moreover, firms with higher productivity and employment as well as older firms have found to be more profitable.
Key Words: Exchange Rate Exposure, Profits, Micro Data, Turkey, Tobit Model JEL Classification: D22, F31, F41
DÖVİZ KURLARININ FİRMA KARINA ETKİLERİ: TOBIT ANALİZİ ÖZ
Bu çalışmada Türk imalat sanayiinde faaliyet gösteren 22 imalat sektörü ve 45.712 firmayı kapsayan bir veri seti kullanarak, reel döviz kuru dalgalanmalarının firma düzeyindeki şirket kazançları üzerindeki etkisi araştırılmaktadır. Tahmin sonuçlarımız döviz kuru değişimlerinin firma düzeyindeki kârlar üzerindeki etkisine istinaden güçlü bir kanıt sunmamaktadır. Çalışmanın sonuçları ayrıca farklı ağırlıklandırma yöntemleriyle hesaplanmış sektörel döviz kuru serilerinin firma karlarına etkilerinin farklılaştığını göstermektedir. Bu durum kullanılan döviz kuru serisinin seçiminin önemini
1The first draft of this paper is presented ICOAEF 2017 conferance on 06-07 December 2017
2 Corresponding Author, MEF University, Faculty of Economics, Administrative, and Social Sciences, Department of
vurgulamaktadır. Buna ek olarak, çalışmada yüksek üretkenlik ve istihdama sahip olan firmalar ile yaşça büyük olan firmaların daha karlı oldukları rapor edilmiştir.
Anahtar Kelimeler: Kur Riski, Kar, Mikro Veri, Türkiye, Tobit Modeli Jel Sınıflandırması: D22, F31, F41
1. INTRODUCTION
Profitability in the real sector is major driver for economic growth because of its positive impact on investment. Exchange rate movements have impact on firm’s profitability through different channels and their influence may be different for firms with diverse qualifications. For an exporting firm, local currency depreciation is expected to increase firms’ profits as a result of increasing competitiveness; on the other hand depreciation also increases production costs of companies that rely on imported inputs. Surprisingly, small number of studies investigates corporate profit and exchange rate relationship (Uctum, 1998; Clarida, 1996). Yet these studies have mostly based on aggregate level data. A related strand of literature focus on measuring exchange rate impact on stock prices, so called exposure, rather than using genuine measures of corporate profit. These studies are often confined to firms listed in the stock exchanges; therefore these samples are not representative of the population.
To identify the impact of exchange rates on profits is a challenging task. In order to do that, we construct real effective exchange rates series at industry level. It has been widely reported in the literature that aggregate indices might be less effective than industry specific real exchange rate indexes in capturing the effect of exchange rate variations because different firms operate in different industries with different trading partners (Goldberg, 2004).
We investigate the impact of real exchange rate fluctuations on corporate profits using a micro data on Turkish Manufacturing firms covering 22 manufacturing industries and 45,712 firms. In our baseline model we measure the impact of exchange rates on firm level profit data based on a Tobit model because of the censored nature of the profit data in the context of our log specification. The results obtained using pooled Tobit model present inconclusive results on the impact of exchange rates on firm level profits. We document that the estimation results are not robust to the exchange rate series used.
The paper is organized as follows. In section 2, literature review will be summarized. In section 3, we explain our data and descriptive statistics. In section 4, we describe our methodology and present the results. Section 5 concludes the paper.
2. BRIEF LITERATURE REVIEW
Few studies examine exposure and pass-through relationship with corporate profit data. Among the existing studies, Uctum (1998) and Clarida (1997) extending Marston’s (1991) model of pricing to market in international trade investigate this link. Clarida (1997) found that during the strong (weak) dollar period 1980:3 1985:2(1985:3-1989:2), the appreciation (depreciation) of the dollar reduced (boosted) real manufacturing profits by more than 20% (25%) in 1984 and 1985 (1987 and 1988). Uctum (1998), in a cross-country framework covering US, Japan, Canada, and Germany, show that exchange rate elasticities of profit shares (profits as a percentage of GNP) are larger in smaller countries, like Germany and Japan resulting from higher demand elasticities and/or larger pass-through coefficients. The study also highlights that currency appreciation hurts US profits more than Japanese profits, through its impact on lowering imported energy bill in Japan.
On the other hand the sensitivity of corporate profits to exchange rates, so called exposure, have been a widely analyzed research topic in the literature. Following Adler and Dumas (1984), exchange rate exposure has been defined as the sensitivity of the value of the firm, proxied by the firm's stock return, to an unexpected change in the exchange rate. In this line of literature significant number of studies report lack of significance between exchange rates and stock returns. (Jorion, 1990; Amihud, 1994; Choi and Prasad, 1995).
Allayannis and Ofek (2001) attribute the lack of significance to the use foreign currency derivatives for hedging. Bartnam and Bodnar (2007) and Bartnam et al. (2010) also stress the role of operative and financial hedging at the firm level in explaining insignificant exposure estimates. Another problem stressed in the literature is related to the measurement of exposure. Several studies reported that exposure estimates may not be significant because of the drawbacks in their sample selection procedures (Bartov and Bodnar, 1994), model specification (Bodnar and Wong,2003), and the choice of the exchange rate (Dominguez and Tesar , 2006).
3. DATA AND DESCRIPTIVE STATISTICS
The main dataset used in the analysis is Annual Industry and Service Statistics compiled by Turkish Statistical Institute. Annual Industry and Service Statistics provides data on firms’ profits, sales, costs, investment, employment, and industry affiliation. While compiling Annual Industry and Service Statistics both full enumeration and sampling methods are used. Full enumeration method has been implemented for enterprises having more than 20 employees and for the enterprises active in some special classes; while the sampling method is used or the enterprises having less than 20 employees.
In the analysis, we focus on manufacturing firms only and we employ 45.712 firms from 22 industries for the period 2005-2015. In Annual Industry and Service Statistics, sectoral industry classification is based on NACE Rev 1.1. for the period of 2005-2010 and NACE Rev.2 for the year 2009 onwards. NACE Rev.2 codes is a four digit number referring to the sector where the firm makes highest revenue. In our analysis, the complete enumeration part of the Census Data has been used. Missing NACE Rev.2 codes for the period before 2009 have been provided by TURKSTAT. Turkstat by using "backcasting method" provides NACE Rev.2 codes for the complete enumeration part of the data for the period before the year 2009. The main advantage of using a Census Data is the opportunity to cover small and medium sized enterprises, which tend to be more vulnerable to exchange rate shocks because of their limited access to financial hedging instruments. Existing studies mostly confined to firms listed in stock exchanges, which are relatively larger corporations.
NACE Rev.2 code of a firm can change during the period of analysis (2005-2015). Our calculations
show that approximately 20% firms belong to more than one sector during the 2005-2015 time frame. We assign a unique sector code (NACE Rev.2 code) for each firm in our analysis. Unique sector code is the NACE Rev.2 code of the sector that the firms make its highest revenue during the period 2005-2015. This is required not only for the use of sectoral deflators (PPI) but also for the construction of industry specific exchange rate series.
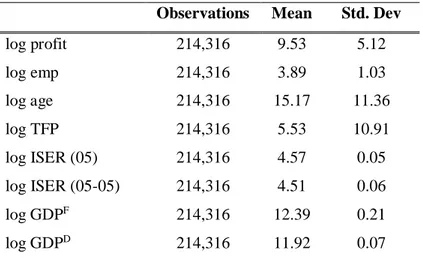
Table 1. Descriptive Statistics
Observations Mean Std. Dev
log profit 214,316 9.53 5.12 log emp 214,316 3.89 1.03 log age 214,316 15.17 11.36 log TFP 214,316 5.53 10.91 log ISER (05) 214,316 4.57 0.05 log ISER (05-05) 214,316 4.51 0.06 log GDPF 214,316 12.39 0.21 log GDPD 214,316 11.92 0.07
Table 1 shows the descriptive statistics on the variables that will be used in the estimations. Firm level variables are profit, age, total factor productivity, and employment. Exchange rate has been
calculated at the industry level. In order to take into account domestic and international demand shocks, we include logarithms of domestic and foreign GDP as control variables.
After dropping the missing values on total factor productivity, we end up with around 214 thousand firm-year observations consisting of 45,712 firms belonging to 22 manufacturing industries. All the nominal values are deflated using the sectoral-level producer price indices (PPI) obtained from the Turkish Statistical Institute (TURKSTAT).
3. a. Industry Specific Exchange Rate Calculations
Industry specific trade weighted real exchange rate series are constructed to reflect the time-series variation in industry-level currency movements for the ease of identification. The construction of industry specific exchange rate requires data on the values of exports and imports at industry-destination level therefore we merge Annual Industry and Service Statistics with Foreign Trade Data in order to get access information on the values of export and imports as well as destination countries at the industry level.
In the first step, we calculate bilateral real exchange rate series of Turkey with trading partner c. rertc = ner
tc × Pt TR Ptc (1) Here 𝑟𝑒𝑟𝑡𝑐 and 𝑛𝑒𝑟
𝑡𝑐 denotes real and nominal bilateral exchange rate series with trading partner c. We normalize the bilateral nominal exchange rates series denominated in local currency (increase meaning an appreciation of Turkish Lira) for each country using 2005 as the base year. 𝑃𝑡𝑇𝑅 and 𝑃𝑡𝑐stands for price index for Turkey and trading partner c. For price index, we use aggregate consumer price indices of Turkey’s trade partners.
In the second step, we calculate industry specific weights. We apply two different weighting schemes for robustness checks:
i) period average weights (2005-2015) ii) period start weights (2005)
Period average weights are based on total trade (export and import) values of industries’ 20 largest trading partners for the period 2005-2015. Specifically, they are calculated using the following formula:
𝑤𝑝𝑎𝑗𝑐 = ∑2015𝑡=2005(𝑋𝑡𝑗𝑐+𝑀𝑡𝑗𝑐) ∑2015𝑡=2005∑ (𝑋𝑐 𝑡𝑗𝑐+𝑀𝑡𝑗𝑐)
where j represent industry, c represents trading partner, and t is time. wpajc is the period average weight based on export and import value (Xtjc+ Mtjc) of the trading partner c in sector j.
In a similar fashion we also calculate period start weights, wpsjc by using trade and destination information of each sector for the year 2005.
wpsjc = ∑2005t=2005(Xtjc+Mtjc) ∑2005t=2005∑ (Xc tjc+Mtjc)
(2b) Finally, by using (1) and (2a-b) we calculate industry specific exchange rates, tertJ, for each of the 2 digit NACE Rev.2 manufacturing industry.
tertj= ∑ wN jc
c × rertc (3) wjc= {w
pajc, wpsjc}
3.b. TFP Calculation
We use total factor productivity (TFP) to control for the prevailing heterogeneity among firms. Productivity has often been calculated as the residual between observed output and predicted output using ordinary least square method and under the assumption of Cobb Douglas production function. However, productivity estimates calculated based on this method suffers both from simultaneity and selection bias problems. Olley and Pakes (1996) have proposed a methodology for productivity estimation to deal with these two problems.
In this study we estimate total factor productivity using Olley and Pakes (1996) methodology, based on the below Cobb Douglass production function:
𝑦𝑖𝑡 = 𝛽0+ 𝛽𝑘𝑘𝑖𝑡+ 𝛽𝑙𝑙𝑖𝑡 + 𝑎𝑖𝑡+ 𝑢𝑖𝑡 (4) 𝑢𝑖𝑡 = 𝜔𝑖𝑡+ 𝜂𝑖𝑡
Here, 𝑦𝑖𝑡 is firm-level value added, 𝑘𝑖𝑡 represents capital stock, 𝑙𝑖𝑡 is employment, 𝜔𝑖𝑡 is total factor productivity, 𝑎𝑖𝑡 is age, 𝜂𝑖𝑡 is the error term that is not observed both by the econometrician and the firm. All the variables except age are in logarithmic form.
In Olley and Pakes (1996) method, productivity estimation has been conducted in three steps. In the first step simultaneity problem will be corrected using the investment decision rule. Simultaneity problem arises because productivity level is known to the firm when deciding its input level, but not to the econometrician. When there is a positive productivity shock, firms tend to increase their input level. Since productivity level of a given firm affects its input level, this situation creates simultaneity problem. To deal with this problem, in the Olley and Pakes (1996) method, investment variable, which is observed both by the firm and the econometrician, is taken as an instrument for productivity.
In this framework, firms’ decision to invest depends on productivity, capital stock and age.
Iit = I(ωit, Kit, ait) (5) Under the assumption that investment function is strictly positive, the inverse function for the unobserved shock, ωit , can be written as:
ωit = I−1(I
it, Kit, ait) = h(Iit, Kit, ait) (6) As a result equation 4 can be arranged as:
yit = βllit + ϕ(iit, kit, ait) + ηit (7) where ϕ(iit, kit, ait) = β0+ βkkit+ h(iit, kit, ait)
After approximating ϕ(iit, kit, ait) with a second-order polynomial series in age, capital, and investment, equation (7) will be estimated using OLS. Here as ϕ(iit, kit, ait) controls for unobserved productivity, error term is no longer correlated with the inputs. As a result, the coefficients of variable inputs (labor, materials and energy) can be estimated consistently.
In the second step, Olley and Pakes (1996) correct the selection bias problem by using the exit rule. Selection bias results from the relationship between productivity shocks and the probability of exit from the market. If a firms’ profitability is in positive relation with the level of capital stock, following a productivity shock, a firm with a higher level of capital stock, will have a higher survival probability then a firm with lower level of capital stock. As a result of the negative correlation between probability of exit and the level of capital stock, the coefficient of capital stock is expected to be biased downward. In order to estimate the coefficient of capital stock and to solve selection bias problem survival probabilities will be estimated.
In this set up, firms’ decision to stay in the market (χit = 1) and the decision to exit (χit = 0) is determined by threshold productivity level, ω̅̅̅̅. it
𝜒𝑖𝑡 = [1 𝑖𝑓 𝜔𝑖𝑡 ≥ 𝜔̅̅̅̅ (𝐾𝑖𝑡 𝑖𝑡, 𝑎)
0 𝑜𝑡ℎ𝑒𝑟 ] (8) Here, ω̅̅̅̅, is a first order Markov process. it
According to the exit rule, the firms stay in the market if their productivity is higher than threshold productivity level. Therefore probability of survival at time t, P̂ , is related to its level of productivity it and productivity threshold at time t-1, in other words is related to the firms’ age, capital, and investment at time t-1. Under this assumption, by using probit model, firms’ survival probability, P̂, is estimated. it
In the third step, under the assumption that productivity, ωit, is a first order Markov process. wit = E(wit∖ wit−1, χit = 1) + ξit (9) we replace equation 9 into equation 4 and obtain
yit− β̂llit = β0+ βkkit + E(wit∖ wit−1, χit = 1) + ηit+ ξit (10)
After rearranging equation 10, we end up with.3
yit− β̂llit = βkkit + g (ϕ⏟ ̂it−1− βkkit−1 ŵit−1
, P̂it−1) + ηit+ ξit (11) Here g(. ) has an unknown functional form and depend on, survival probability, P̂it−1, and productivity , ŵit−1. The unknown function g(. ) is approximated by using second order polynomial or kernel estimator for the third stage.
After this arrangement, the only parameter to be estimated in the equation 11 remains the capital stock coefficient. After replacing the estimation results involving βl ve ϕ(iit, kit, ait) from the first step and the probability of survival predicted in the second phase, P̂, in equation 11, the coefficient of capital stock, β̂k, is estimated.
3 𝜙
4. METHODOLOGY AND RESULTS
The baseline model involves regressing the profit level of a given firm on exchange rate as well as several firm and industry level control variables. Our log specification requires the implementation of the Tobit model as our data on profits has negative values, which automatically drop when we express them in log specification. This situation has been referred as “censoring” in the literature and it’s a very common difficulty when working with micro economic data. In the censored data, values belonging a certain range are all converted to a single value. In our data approximately 20 percent of the observation have negative corporate profit data, which drop in log specification. We therefore employ Tobit model in order to deal with the bias resulting from dropping such zero responses.
In order to conduct the analysis, the following Tobit model is defined
lnyi∗= c 1+Β1Xi+ ϵi = c1+ β11x1jFX+ β12x2iEMP+ β13x3iAGE+ β14x4iTFP+ β15x5GDPd+β16x6GDPf+ ϵi (12) ln yi= lnyi∗ if y i ∗ > 0 (13a) lnyi= 0 if yi∗≤ 0 (13b) where yi∗ is latent continuous variable that shows the profit value of firm i, and is represented in log linear functional form. lnyi is the observable variable (the profit value in logarithmic form) that is equal to ln𝑦𝑖∗ when profit value is greater than zero and otherwise it is “0”. X is the vector of explanatory variables including 𝑥1𝑗𝐹𝑋 industry specific exchange rates of industry j that firm i operates, , 𝑥2𝑖𝐸𝑀𝑃employment level of firm i, 𝑥
3𝑖𝐴𝐺𝐸age of firm i, 𝑥 4𝑇𝐹𝑃 is total factor productivity, 𝑥 5𝐺𝐷𝑃𝑑 and 𝑥6𝐺𝐷𝑃𝑓domestic and foreign GDP, and ϵi stands for error term which is independently and normally distributed.
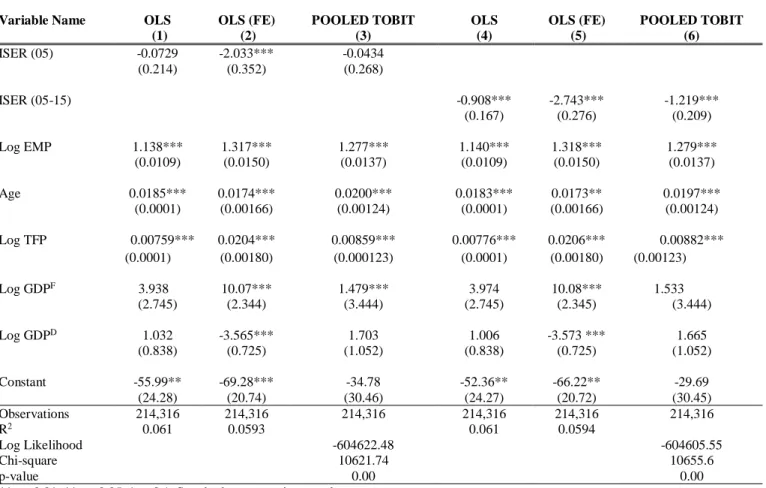
As a starting point, we run pooled Tobit model. Subsequently, we run OLS and fixed effect OLS models to compare the results obtained from different specifications. The results obtained using different specifications are presented in Table 2.
The results obtained using pooled Tobit models (column 3 and 6 of table 2) documents inconclusive results on the impact of exchange rates on firm level profits. The results are not robust to
when period average weights are used indicating that an appreciation of the Turkish Lira decreases the profitability of Turkish firms. On the other hand, when we employ period-start weights the exchange rate seems to have no impact on profit levels. The results of fixed effect OLS regressions (column 2 and 5 of table 2), although they do not take into account-censored nature of the data, imply that the appreciation of Turkish Lira has a negative impact on corporate profits. On the other hand, the results of the pooled OLS model are also not robust to the exchange rate series used.
In all specifications the impact of productivity, employment and age is positive and significant, showing that more productive, bigger, and older firms tend to be more profitable. In addition, we also find that in OLS FE specification (columns 2 and 5 of Table 2) an increase in foreign GDP increases the firm’s profits.
5. CONCLUSION
Profitability in the real sector is an important determinant of investment, which is the major driver of growth and productivity. In this paper, we analyzed the impact of industry specific exchange rates on firm-level profits in the Turkish manufacturing industry.
Our results based on the Tobit model using different exchange rate series fail to document strong results on the impact of exchange rates on profits. More specifically, our estimation results are not robust to the exchange rate series constructed using different weighting schemes showing the importance of the choice of the exchange rate series used in the analysis. In addition, the result of the Tobit model as well as OLS models document that firms with higher productivity and employment as well as older firms have found to be more profitable. Estimation of the model with firm-level exchange rates and across firms with diverse qualifications is a possible extension of this study.
Table 2: OLS and TOBIT Regression Results
Variable Name OLS
(1) OLS (FE) (2) POOLED TOBIT (3) OLS (4) OLS (FE) (5) POOLED TOBIT (6) ISER (05) -0.0729 -2.033*** -0.0434 (0.214) (0.352) (0.268) ISER (05-15) -0.908*** -2.743*** -1.219*** (0.167) (0.276) (0.209) Log EMP 1.138*** 1.317*** 1.277*** 1.140*** 1.318*** 1.279*** (0.0109) (0.0150) (0.0137) (0.0109) (0.0150) (0.0137) Age 0.0185*** 0.0174*** 0.0200*** 0.0183*** 0.0173** 0.0197*** (0.0001) (0.00166) (0.00124) (0.0001) (0.00166) (0.00124) Log TFP 0.00759*** 0.0204*** 0.00859*** 0.00776*** 0.0206*** 0.00882*** (0.0001) (0.00180) (0.000123) (0.0001) (0.00180) (0.00123) Log GDPF 3.938 10.07*** 1.479*** 3.974 10.08*** 1.533 (2.745) (2.344) (3.444) (2.745) (2.345) (3.444) Log GDPD 1.032 -3.565*** 1.703 1.006 -3.573 *** 1.665 (0.838) (0.725) (1.052) (0.838) (0.725) (1.052) Constant -55.99** -69.28*** -34.78 -52.36** -66.22** -29.69 (24.28) (20.74) (30.46) (24.27) (20.72) (30.45) Observations 214,316 214,316 214,316 214,316 214,316 214,316 R2 0.061 0.0593 0.061 0.0594 Log Likelihood -604622.48 -604605.55 Chi-square p-value 10621.74 0.00 10655.6 0.00 ***p < 0.01, **p < 0.05 ,*p <0.1. Standard errors are in parenthes
REFERENCES
Adler, M., and Dumas, B. (1984) “Exposure to Currency Risk: Definition and Measurement”, Financial Management, 41-50.
Allayannis, G., and Ofek, E. (2001) “Exchange Rate Exposure, Hedging, and The Use of Foreign Currency Derivatives”, Journal of International Money And Finance, Vol. 20, No. 2, 273-296. Amihud, Y. (1994) “Exchange Rates and The Valuation Of Equity Shares”, Exchange Rates and
Corporate Performance, 11, 49-59.
Bartov, E., and Bodnar, G. M. (1994) “Firm valuation, earnings expectations, and the exchange‐rate exposure effect”, The Journal of Finance, Vol. 49, No. 5, 1755-1785.
Bartram, S. M., and Bodnar, G. M. (2007) “The Exchange Rate Exposure Puzzle”, Managerial Finance, Vol. 33, No. 9, 642-666.
Bartram, S. M., Brown, G. W., and Minton, B. A. (2010) “Resolving The Exposure Puzzle: The Many Facets Of Exchange Rate Exposure”, Journal of Financial Economics, Vol. 95, No. 2, 148-173. Choi, J. J., and Prasad, A. M. (1995) “Exchange Risk Sensitivity and Its Determinants: A Firm and
Industry Analysis of US Multinationals”, Financial Management, 77-88.
Clarida, R. (1997) “The Real Exchange Rate and US Manufacturing Profits: A Theoretical Framework with Some Empirical Support”, International Journal of Finance & Economics, Vol. 2, No. 3, 177-87.
Dominguez, K. M., and Tesar, L. L. (2006) “Exchange Rate Exposure”, Journal of International Economics, Vol. 68, No. 1,188-218.
Goldberg, L. S. (2004) “Industry-Specific Exchange Rates for the United States”, Federal Reserve Bank of New York Economic Policy Review, 1-16.
Jorion, P. (1990) “The Exchange-Rate Exposure of US Multinationals”, Journal of Business, 331-345. Marston, R. C. (1990) “Pricing To Market In Japanese Manufacturing”, Journal of International
Economics, Vol. 29, No. 3-4, 217-236.
Olley, G. S., and Pakes, A. (1996) “The Dynamics of Productivity in The Telecommunications Equipment Industry”, Econometrica, Vol. 64, No. 6, 1263-1297.
Uctum, M. (1998) “Why Have Corporate Profits Declined? an International Comparison”, Review of International Economics, Vol. 6, No. 2, 234-251