ISTANBUL KULTUR UNIVERSITY
INSTITUTE OF SCIENCES AND ENGINEERING
RAPID MAP UPDATING PROCEDURES
USING ORTHOPHOTOS
M.Sc. Thesis byMuhamad Nasir Alr ajhi
Department of Civil Engineering Geomatics Program
Table of Contents
Executive Summary AcknowledgementsChapter 1: Introduction and Scope of Study
1.1 Background 1.2 Study Objectives 1.3 Scope of Study 1.4 Expected Output and BenefitsChapter 2: Methodology Used for Study
2.1 Choice of Study Area 2.2 Data Acquisition Methodology 2.2.1 Conventional Digital Mapping 2.2.2 Orthophoto Production 2.2.3 Test Point Data 2.3 Map Updating Procedures 2.3.1 Map Updating using Stereomodels 2.3.2 Map Updating Using Orthophotos 2.3.3 Measurement of Test PointsChapter 3: Results and Analysis
3.1 Accuracy 3.1.1 Map Features 3.1.2 Test Points 3.2 Efficiency (Time and Cost) 3.2.1 Map Features 3.2.2 Test PointsChapter 4: Analysis and Conclusions
4.1 Analysis of Results 4.2 Conclusions and Recommendations References & Bibliography AppendixI AppendixIIABSTRACT
“ Rapid Map Updating Procedures Using Orthophotos”
The General Directorate of Surveying and Mapping (GDSM) of the Ministry for Municipal and Rural Affairs (MOMRA) of the Kingdom of Saudi Arabia has the mandate for large scale mapping of 200 Saudi Arabian cities.
During the last 30 years all of these cities have been mapped in 3D at least once using stereo photogrammetric procedures. The output of these maps is in digital vector files with more than 300 types of features coded.
Mapping at the required scales of 1:10 000 for the urban and suburban areas and at 1:1000 for the urban areas has been a lengthy and costly process, which did not lend itself to regular updating procedures. For this reason the major cities, where most of the developments took place, have been newly mapped at about 10 year intervals.
To record the changes of urban landscapes more rapidly orthophoto mapping has recently been introduced. Rather than waiting for about 10 years for the line mapping of a large city after the inception of a mapping project, orthophotos could be produced a few months after a new aerial flight was made.
While new, but slow stereomapping in 3D provides accurate results in conformity with the usual urban mapping specifications, the geocoded superposition of outdated maps with the more recent orthophotos provided a very useful monitoring of the urban changes.
At the same time the use of orthophotos opens up a new possibility for urban map updating
by onscreen digitizing in 2D. This can at least be done for the most relevant features, such
as buildings, walls, roads and vegetation. As this is a faster and muvh more economical method than 3D stereo plotting a lesser geometric accuracy is to be expected for the on screen digitization.
There is a need to investigate and to compare the two methods with respect to accuracy and speed of operation as a basis for a decision, whether to continue with new 3D stereomapping every 10 years or to introduce rapid map updating in 2D
via onscreen digitization every 3 to 5 years.
The thesis proposes to investigate these aspects for a chosen test area covering one
1:10 000 and one 1:1000 map sheet over the city of Huraymilah, where aerial photography was taken last year and Aerial Triangulation was completed.
CHAPTER 1. OBJ ECTIVE AND SCOPE OF STUDY 1.1 Historical Background The Kingdom of Saudi Arabia (KSA) has a large land area covering about 2,000,000 square km. Prompted by the discovery of oil in the first half of the 20th century, the efforts to obtain a nationwide map coverage for KSA started with the organization of Aerial Survey Department in the Ministry of Petroleum during 1950s. Utilizing the services of International mapping consultants, these efforts resulted in two significant achievements.
1) Establishment of a National Geodetic Network (NGN) covering the entire country. As shown in Fig. 1.1, the control stations were located along primary transportation routes. Unlike other countries in the region, no triangulation network was available and, consequently, the horizontal control points were established using precise EDM traverse networks. This methodology resulted in a network with a relative accuracy ranging between 1/50,000 to 1/100,000. The classical approach of differential leveling was used to establish the vertical control points and the level net was tied to a number of tidal bench marks.
2) Coverage of the entire country with topographic maps at 1/50,000 scale with 50meter contour interval. The topographic mapping was carried out using conventional photogrammetric procedures and resulted in about 2,500 map sheets as shown in Fig. 1.2; each sheet covering 15 minutes along longitude and latitude.
Although the maps produced at 1/50,000 scale served the immediate need for national security, regional planning and transportation networks, there was a strong demand for larger scale topographic mapping to meet urban and municipal planning requirements. This led to the organization of the General Directorate for Surveying and Mapping (GDSM) in the Ministry of Municipal and Rural Affairs (MOMRA) in 1968. The GDSM was assigned the responsibility to provide topographic maps from the largest map scale of 1:1,000 to maps approaching scale 1:25,000.Utilizing the services of international map production companies, SCD under MOMRA has followed a mapping program to
Fig. 1.1: National Geodetic Network (NGN)
systematically cover all the urban and rural population centers, spread over 200 Municipalities in KSA. These maps were initially produced using analog photogrammetric mapping procedures and in 1984, digital mapping procedures using analytical stereoplotters were introduced in MOMRA [3].
1.2 Cur rent and Future Plans
The introduction of the analytical stereoplotters to replace the analog stereoplotters was a significant milestone in the evolution of Photogrammetry since it advanced our ability to make image measurements by an order; the analog plotter resolution of tens of micrometers jumped to the level of micrometers for an analytical plotter [22].
However, the photogrammetric compilation of a stereomodel remained a tedious and time consuming task by a well trained human operator. Therefore, the effort were directed mostly towards reducing the time and human labor needed during stereocompilation by automating as many photogrammetric measurement tasks as possible. At the same time, the exponential advancements in the digital computing speed and memory were exploited to achieve tremendous enhancements in image processing techniques [21]. The logical marriage of analytical photogrammetric and digital image processing techniques led to the emergence of ‘Digital Photogrammetry’ in the 1990s [22].
Even though the aerial photography for mapping large areas continued to be acquired with analog aerial cameras but the aerial film was later scanned on a digital scanner to transform the film image to a digital image. Using digital overlapping images, the standard photogrammetric procedures of the interior and the relative orientation required to orient a stereomodel at a stereoplotter (analog or analytical) could now be partially or fully automated at a Digital Photogrammetric Workstation (DPW). The photogrammetric measurements carried out at a DPW resulted in what has been designated as ‘headsup digitizing’ or ‘Softcopy Photogrammetry’ [22]. The softcopy photogrammetric techniques were transitioned in MOMRA in the late 1990s and this is continuing as the standard practice for photogrammetric mapping at all map scales.
The introduction of the digital photogrammetric technology in MOMRA also led to the compilation of orthophoto coverage at 1:5,000 and 1:10,000 scales for urbanized areas and at 1:20,000 scale for rural population centers. In addition, highresolution satellite imagery has been georeferenced to provide nation wide orthorectified image coverage.
During the past five years, due to more vigorous efforts and increased resources, the pace of map production in MOMRA has accelerated. It is now expected that the map coverage at 1:1,000 and 1:2,500 map scales will be completed within next 2 to 3 years for urban and rural population centers in all the regions of KSA.
1.3 Future Mapping Challenges
Since its creation in the late 1960s, the GDSM has successfully transitioned through various development stages from Analog Photogrammetry, through Analytical Photogrammetry, to stateoftheart Digital Photogrammetry. This has resulted not only in providing map coverage for more than 200 Municipalities in KSA at scales ranging from 1:1,000 through 1:20,000 but has also populated a nation wide geodatabase. The map data has been produced with data quality meeting the highest international standards. The GDSM was recently awarded ISO TC211 certification for: “Map Production and Dissemination of Geospatial Information”.
In spite of this success, MOMRA faces two challenging problems that require an early solution. These problems are briefly described in the following sections and the search for a possible solution to mitigate the impact of the problems has been the primary motivation for undertaking this research study.
1.3.1 Map Updating
It is widely accepted that the ‘accuracy’ of a map data is not entirely defined by its geometric accuracy but it also includes the correctness of the identified feature. This means that the data must reflect the current situation on the ground [22]. This requires that map data must be continuingly updated so as to reflect the changes on the ground. The topographic features are constantly changing on the ground, but such changes do not occur at the same rate in
every country nor in every town or village in the same country. Therefore, the time interval between map revision, map revision practices and the resource allocation vary from one country to another. There is a wide consensus that, until digital photogrammetric technology can advance to fully automated feature data extraction, the digital photogrammetric mapping procedures are still laborious and time consuming. The experience in many countries shows that the time interval for completing a large mapping project, from the time of acquisition of aerial imagery to generating the final map data, is still from 2 to 3 years. Therefore, this approach is not well suited for map revision when rapid changes are constantly taking place.
The Ordnance Survey in United Kingdom has demonstrated impressive success in updating its large scale map and cadastral database in that the data always reflects a 6month currency. However, this has been achieved by constantly mobilizing teams of about 400 Surveyors to update maps through GPS supported ground survey techniques. It is interesting to note that according to the United Nations Report on ‘World Urban Prospects 19502050’, the rate of urban growth from 20052010 is estimated at 0.29 percent for United Kingdom, while the corresponding growth rate for Saudi Arabia is 8.17 percent; more than 28 times! This clearly shows the enormity of the challenge that MOMRA faces in updating the map database. There is an urgent need for finding an alternate solution to this problem. 1.3.2 Implementation of Cadastral Registration In order to introduce a nationwide modern cadastral registration system, the Government of KSA has recently enacted the ‘Land Title Registration Act’. The provisions of this Act are to be implemented jointly by MOMRA and the Ministry of Justice. In this regard, MOMRA has been assigned the responsibility for geolocating the land parcel boundaries for adjudication during the First Registration process. Since more than 4,000,000 land parcels are involved, there is a strong incentive to explore an alternative to the physical measurement of parcel boundaries on the ground.
One obvious alternative is to derive the parcel boundaries from space or aerial imagery. However, it is necessary to explore what may be an optimal photogrammetric approach to
that the photogrammetric methodology found suitable for map revision can also fulfill, at least partially, the requirements for the delineation of land parcel boundaries.
1.4 Objective and Scope of Study
1.4.1 Study Objective
As pointed out in the last section, there is a continuing need for updating the existing map database. There is also a need for delineation of the boundary of individual land parcels to support the implementation of the First Registration process that has recently been initiated in the Kingdom of Saudi Arabia.
The revision of a map is usually carried out by adopting one of the two approaches. If the extent of change in the existing map features is small, the new features are surveyed on the ground and plotted in CAD environment (such as Microstation, etc.) using the same datum and coordinate system as for the existing map data. This newly surveyed features can then easily be merged with the existing digital map data by deleting those features that no longer exist and inserting the new features and any changes in the existing features. This method is accurate but, in spite of the GPS positioning technology, especially the RealTime Kinematic (RTK) GPS positioning, is timeconsuming and, consequently, costly. Its use is, therefore, justifiable when the changes in map are minimal.
If extensive changes have occurred, then the only viable approach is to map the area from a new set of aerial imagery. The time needed for planning the project, acquisition of aerial imagery, scanning (unless imagery is acquired with a digital aerial camera), establishing new control points as needed, and aerial triangulation would take the same amount of time and effort as needed for original mapping. The only difference will be that all the planimetric features do not have to be captured again. The existing map data can be displayed to drape the stereomodel created from the new aerial imagery and the existing map database is edited for only changes in the planimetric features.
As pointed out earlier, the urban landscape in Saudi Arabia is changing very rapidly with the constant outward growth of urbanized areas. This makes the mapping task as a combination
of large areas of new mapping with extensive changes in the existing map data. Consequently, the process takes long time and becomes expensive.
As an alternative process, it is proposed to investigate the use of orthophotos generated from new aerial imagery for mapping of new features as well as for the editing of existing map features. After the aerial triangulation of the new aerial imagery blocks has been completed and if Digital Elevation Model (DEM) data is available, the production of orthophotos becomes a fully automated batch process that does not require any operator intervention [16, 20]. The resulting orthophoto raster images may then be digitized for vectorizing the planimetric map features. This approach is expected to result in significant savings in time and cost [14].
The proposed approach may also present a viable alternative to ground survey of parcel boundaries for cadastral registration for some areas. The lands that lie outside the Municipality boundaries are either agricultural lands, or used by nomadic population as grazing lands or uncultivable desert lands. Such lands are not covered with 1:1,000scale maps. However, the boundaries for such land parcels also have to be delineated for implementing the First Registration. The boundary delineation of such land parcels on orthophotos may offer a faster and less expensive alternative.
Therefore, the objective of this research study is to explore the following two questions:
1. Does mapping of planimetric features from 2D digital orthophoto images provide a rapid and viable alternative to the standard procedure used for photogrammetric mapping from 3D digital stereoimages?
2. Does mapping the boundaries of land parcels from 2D digital orthophoto images provide a satisfactory alternative to surveying boundaries in the field to satisfy the cadastral registration requirements?
The scope of this study and the choice of the methodology selected for study are aimed at seeking an answer to the above questions.
1.4.2 Scope of Study
The Specifications for Digital Photogrammetric Mapping Projects in MOMRA require that the mapped planimetric position for well identifiable points should not exceed an error in the Xcoordinate nor in the Ycoordinate that exceeds 15 cm at 1s level for digital map data produced at 1:1,000 map scale [18]. The detailed procedures for control surveys and digital photogrammetric mapping have been designed to meet this standard. Color aerial photography is obtained using a 30 cm focal length aerial camera to produce photography at 1:5,500 scale.
A new mapping project covering a large area north of Riyadh was flown during 2007 but it has not yet been mapped. It was planned to use this most recent aerial photography covering a small test site for this study and process stereomodels using standard digital photogrammetric procedures. In addition, digital orthophotos covering the same area will be produced. This will provide a means to compare the coordinates of a set of test points measured in the 3D stereo model with the corresponding coordinate data measured on 2D digital orthophoto. The coordinate data will be analyzed to seek answers to the questions posed in Section 1.4.1. The analysis of the two coordinate data sets should result in drawing appropriate conclusions and to offer recommendations for future guidance. CHAPTER 2. METHODOLOGY USED FOR STUDY 2.1 Choice of Study Area
It was pointed out in Chapter 1 that this study was motivated to evaluate the use of orthophotos generated from recent aerial imagery for updating 1:1,000 scale map database maintained by the General Directorate for Surveying and Mapping (GDSM) in MOMRA. A secondary objective was to assess whether a large scale orthophoto can be used to delineate the boundary of a land parcel to support cadastral registration process.. The initiative for the implementation of a nationwide cadastral (land title) registration system was launched jointly by the Ministry of Justice and MOMRA during summer 2007. A small town Huraymila
located about 90 km northwest of the capital Riyadh was the first area selected for implementing the newly introduced land title registration system. Figure 2.1 General appearance of study area on satellite image As seen on the satellite image in Fig. 2.1, Huraymila is a small town with a population under 3000 and is surrounded with old style farms with a lot of palm trees but is not mountainous or covered with forest. The average terrain elevation is about 650 meter above MSL. New color aerial photography at a scale of 1:5,500 had been acquired with an RMK TOP30 camera during late December 2006 to cover 43 sq km area surrounding the town for the production of maps at 1:5,500 scale. Airborne GPS data, logged at 1sec interval, had also been acquired during the entire flight mission. The combination of the designation of the area for implementing cadastral registration, suitability of the terrain for photogrammetric data acquisition, blend of the urban and rural landscape and the availability of recent aerial photographic coverage, presented a compelling case for the selection of Huraymila for the proposed study.
2.2 Data Acquisition Methodology 2.2.1 Aerial Imagery The 1:5,500 colour aerial photography was captured by a RMK TOP30 (305.577 mm) with forward motion compensation, gyrostabilized mount and flight planning system. The block is covered by 176 stereo images with 60% forward overlap and 40 % side overlap, and is comprised of 11 flight lines flown in the EW direction and 4 tie flights, 3 of which were run in the NS direction. Fig. 2.2 indicates the photo footprint and model configuration of the aerial photography blocks. configuration for the study area Figure 2.2 Aerial Photography Block
The aircraft was fitted with a Novatel geodetic GPS receiver system which continuously acquired and logged data at 1 second intervals during the entire photo mission. The data is stored together with a time tag of the camera exposure events. For quality control and as a backup against likely GPS receiver malfunction, GPS data at two different base stations, tied to the geodetic network established for ground control, was also logged at 1sec interval during the entire photo mission.
The airborne GPS data was postprocessed differentially with respect to each base station using geoNap++ software. The coordinates of the camera perspective center for each aerial photo at the time of exposure were derived through linear interpolation for the corresponding event time from the two closest computed locations along the trajectory of the airborne GPS antenna. The resulting coordinates are in the same geodetic reference frame that was used for the ground control; UTM Zone 38, based on ITRF 2000 datum. The ellipsoidal height
data resulting from the processing of GPS data was transformed to orthometric heights based on the local Geoid model estimated for similar reduction of the ground control height data. The final results indicate that the standard errors in the computed camera station coordinates do not exceed 10 cm in position and 15 cm in height.
Finally, All photos have been scanned, on the roll, using a Z/I TD PhotoScan high precision scanner, at a resolution of 14 micrometers, with a full set of overviews. The calibration of the scanner is maintained and checked periodically by a trained Z/I technician. An uptodate calibration report is available during digital photogrammetric data processing. Regular inspection during the scanning process has ensured that the resulting digital images are free of noise, bit errors, spikes etc. that may possibly be introduced during the scanning process, and that they are radiometrically homogenous.
2.2.2 Ground Control
Precisely surveyed geodetic control is essential for controlling each aerial triangulation block. Since airborne GPS data is collected during flight mission, the 3D control points are required to be spaced only along the perimeter of the block in order to carry out bundle block adjustment. As shown in Fig. 2.2, the Huraymila mapping area was covered with two separate blocks. The southwest corner of the area is covered with a small block that consists of 12 models only. The second much large block with 162 images covers the rest of the mapping area. Such large blocks often require the use of additional shift and drift parameters during bundle adjustment. This imposes a strict requirement for the availability of a 3D control point at each end of each strip [13]. The most common practice is to meet this control requirement through GPScontrolled cross flights. This practice is also followed in MOMRA, and consequently, four cross flights were also flown along the block perimeter (shown in blue in Fig. 2.2).
A GPS control network was designed and a permanent concrete monument was built at each control station and each station monument was signalized a few days before the flight mission was conducted. The design of the monument and the signal has been standardized in MOMRA specifications for mapping at various scales [19].
After the photography had been completed and scanned, it was found that only the control points shown in magenta in Fig. 2.2 (10 points) could be seen in the imagery; some targets must have been lost before the area was flown. Such a control distribution was not satisfactory [13] . In order to rectify this situation, four additional points were selected, shown in orange in Fig. 2.2, to fully satisfy the minimal control requirement for a reliable bundle adjustment of the aerial triangulation block. Although no longer signalized, these points are well identifiable on the imagery and, therefore, are considered equally reliable. One additional control point was located in the interior of the block to serve as a check point.
The ground control network was observed using static differential GPS technique and the entire network was adjusted simultaneously. The results indicate a standard error in the range of 2 to 3 cm in planimetric position and 4 to 5 cm in height; these results are within acceptable range [18].
2.2.3 Aerial Triangulation
The procedure for softcopy Aerial Triangulation (AT) is mainly governed by the hardware and the software used. The digital photogrammetric workstation currently used for AT in MOMRA is Z/I Image Station combined with MatchAT software marketed by Inpho. The major steps during this process are: · Project definition · Interior orientation · Automatic Mensuration · Manual Mensuration · Absolute orientation using GCPs · Coordinate refinement · Bundle block adjustment 2.2.3.1 Photogrammetric Data Acquisition
Prior to the commencement of the observations, the camera calibration parameters and several block parameters were defined in MatchAT. The software uses this information for algorithm selection, data manipulation, and image display [24]. The measurement started
with performing the interior orientation of each image to establish the relationship between the calibrated fiducial coordinates and the corresponding raster coordinates, most commonly through an affine 2D coordinate transformation. This process has successfully been automated for using digital raster images. By using a predefined Template Photo, the software loops through each of the images and matches the fiducial marks measured on the Template Photo with each of the images using autocorrelation.
In order to maintain quality control, all the 8 available fiducial marks on each image were measured and the transformation residuals were continuously reviewed for any unacceptably large transformation residuals. Manual measurement by an operator is needed if any observation has to be deleted and replaced. The transformed image coordinates in each image were then corrected for systematic errors due to radial and tangential lens distortion, atmospheric refraction and earth curvature.
The next processing step is the relative orientation that captures the relative geometry between overlapping images through the measurement of common tie points. MatchAT software provides the capability to perform this step through fully Automatic Aerial Triangulation (AAT). In order to initiate the automatic mensuration process, initial estimate for image footprints have to be established. This information is derived from the photo perspective center coordinates that are known from airborne GPS data and supplemented with the measurement of all the ground control points by the operator.
The automatic tie point mensuration process attempts to correlate image points in each of the 9 von Gruber positions for each image, simultaneously in all overlapping images. Optimal results can be expected only through a judicious selection of image correlation parameters by the operator, with due regard to the nature of terrain and image texture [2, 23]. The tie points are measured automatically on all overlapping images. The following criteria for automatic tie point mensuration was used for the Huraymila block: · Tie points within each image are distributed at the 9 von Grüber locations · each image shall have a minimum of 3 tie points at any von Gruber location · the number of tie points in each image will preferably not less than 60
· a tie point shall appear in at least 3 images except in models located at ends of flight lines
Any deficiency in the distribution of tie points was made up through manual measurement. Additional tie points were measured manually by selecting welldefined objects which appear on overlapping images, are easily distinguished from surrounding detail and are located in clear and flat areas [6].
After completing the tie point measurement, the relative orientation for the entire block is reviewed to ensure that there are no outliers, and the tie point measurements are refined if needed. Using the perspective center coordinate data coupled with the coordinate data of the few ground points located along the block perimeter, an absolute orientation solution of the block to the ground was achieved. Such a solution is approximate because the lack of reliable camera orientation data and the fact that the airborne GPS data may have systematic shift and drift errors due to imperfect ambiguity solution, causes residual image errors to propagate into large ground coordinate errors [2]. However, it adequately serves as an initial estimate for the ground coordinates for the tie points in order to initiate the bundle adjustment process.
2.2.3.2 Bundle Adjustment
The bundle block adjustment was also carried out using the MatchAT adjustment module. Features of this program include selfcalibration to correct simultaneously for systematic image errors, automatic detection and elimination of blunders and simultaneous adjustment of differential GPS observations and derivation of drift correction in all three coordinates. Calculation of the error propagation by inversion is performed for better analysis of the results [7, 24].
For the bundle adjustment of a GPS supported AT block, the relative weighting of the ground control data and the airborne GPS control data is an important consideration [13]. Since both sets represent a measurement data, an accurate assessment for the a priori standard error for each type of measured data is required. In the case of airborne GPS data, the postprocessed solution provided an estimate for the standard error in the three coordinate components for
the computed position for camera perspective center for each photo. However, the MatchAT software used for adjustment is restricted to assigning only one value for the standard error in the X and Ycoordinate data for all points. A different single value for the height standard error is permitted. Accordingly, the following values for the standard error in control data were used: Ground Control Point Data Standard error in X and Y coordinate: 5 cm Standard error in Zcoordinate (Height) 7 cm GPS derived Perspective Center Data Standard error in X and Y coordinate: 10 cm Standard error in Zcoordinate (Height) 15 cm
It should be pointed out that the ground control coordinates resulting from GPS network adjustment indicated a higher precision. However, the above values were selected to account for some degradation in the precision during manual photogrammetric measurement of control points on digital images.
The Huraymila block is mediumsize block; there are 27 images in each of the two longer flight lines. Accordingly, 3 shift and 3 drift parameters for each strip (1 shift and 1 drift parameter for each of the 3 coordinate component) were included during bundle adjustment. As pointed out in Section 2.2.2 above, additional ground control points were established to strengthen the block perimeter and to permit the use of such additional parameters. In the absence of control points in the interior of the block, the use of the selfcalibration option could not be justified and, therefore, not used. The final AT block adjustment results are summarized below and meet the MOMRA accuracy standards [19]:
Number of Strips 13
Number of Images 162
Number of Control Points 14 Control Point Residuals:
RMS in Zcoordinate 7.9 cm GPS Control Residuals: RMS in Xcoordinate 14.5 cm RMS in Ycoordinate 7.7 cm RMS in Zcoordinate 9.6 cm Number of Tie Points 20162 Standard Error of Unit Weight(s0) 2.3 m Mean Standard Error in Rotation: Std. Error in Omega 1.2 [deg/1000] Std. Error in Phi 0.9 [deg/1000] Std. Error in Kappa 0.3 [deg/1000]
The successful completion of the aerial triangulation of the block provided all the data required for 3D stereo compilation of individual models as well as to generate orthophoto for any image.
2.3 Data Acquisition Procedure
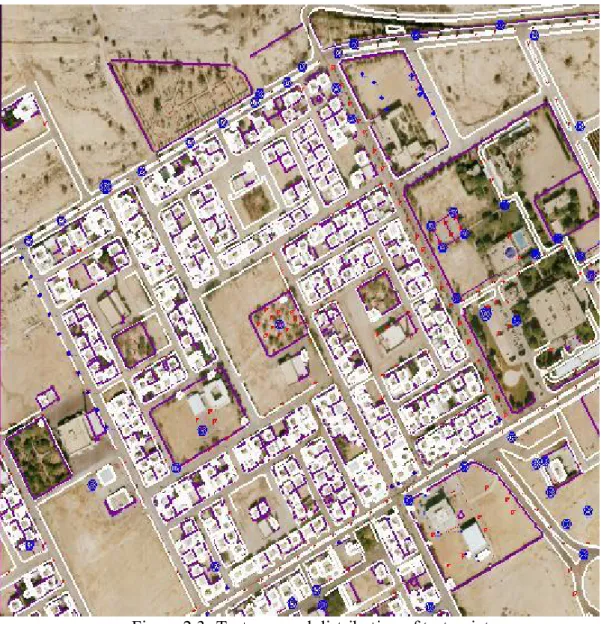
As emphasized earlier in Chapter 1, the primary objective of this study is to assess whether the extraction of planimetric features such as buildings, fences, etc. from a twodimensional orthophoto raster image can offer an acceptable and viable alternative to the conventional approach of using digital photogrammetric compilation of threedimensional stereomodels. To achieve this objective, an area covering 1km by 1km that reflected a good blend of built up and open areas was selected from the Huraymila block and is shown in Fig. 2.3. The selection of test data and the alternate photogrammetric procedures used for data extraction are briefly described.
Figure 2.3 Test area and distribution of test points
2.3.1 Test Point Selection
Any experimental study aimed at a comparative analysis of two measurement data sets must be designed to ensure that any variation in the data quality can confidently be attributed to nonambiguous parameters. Any photogrammetric measurement by a human operator involves two tasks; interpretation of image and subsequent pointing to the image. The interpretation of imaged features is a psychophysical task that is not easily quantifiable except for ‘point features’, for which the human eye is sharply tuned. It is for this reason that most national standards for spatial data accuracy greatly emphasize the use of only ‘well identifiable’ points for any data validation [4, 26]. It was, therefore, decided to confine this
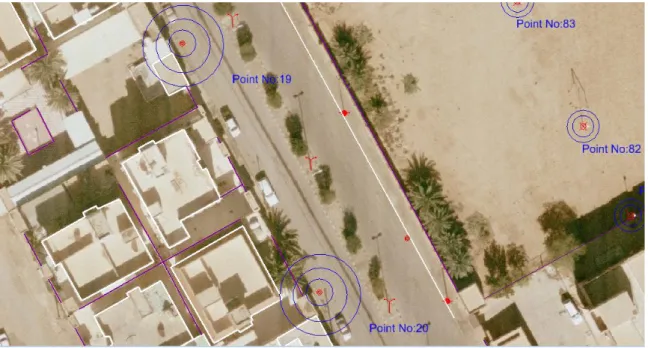
features are visible in a typical urban aerial scene, data for a total of 100 test points was collected for this study, which were grouped into the following 10 different ‘point’ feature types: Building Corner Brick Fence Corner Wire Fence Corner Paved Road Edge Corner Manhole Road Sign Light Pole Street Lamp Street LampMultiple High Voltage Electric Pole All point objects, except for the building corners, were observed at their base on the ground level. The building corners were measured at the roof level. This conforms to the most common photogrammetric practice and was also planned to assess the effect of building heights on the orthophoto measurement data. Some of the test points used for data collection are shown in Fig. 2.4.
Fig. 2.4: Some the Test Points used in the Study
2.3.2 Test Data Measurement
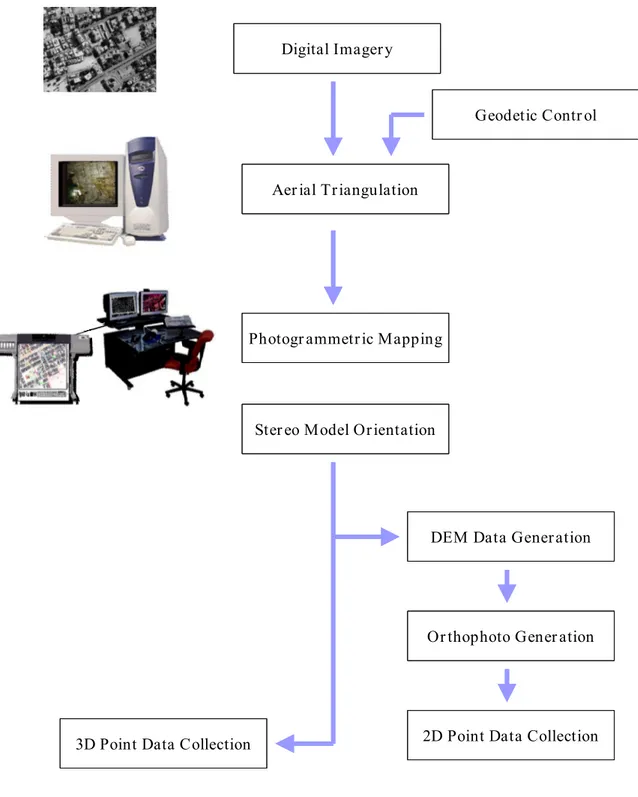
Starting with the digital aerial imagery, the various processes involved in the observation of the coordinate data for the selected test points is schematically displayed in Fig. 4.5. All the photogrammetric processes were performed on the Z/I Imaging photogrammetric workstation ImageStation. This DPW has been in use for many years, incorporates ergonomically designed Solid State HandHeld Controller and offers a full suite of photogrammetric software applications [16]. Highend single or dual 21" and 24" monitors provide a convenient arrangement for viewing and roaming of a stereomodel with the aid of CrystalEyes stereo glasses.
The aerial triangulation adjustment solution for the Huraymila block provided the orientation data as well as a large number of tie points for carrying out the absolute orientation of the model covering the test data site. The absolute orientation solution resulted in RMS values for the Xcoordinate and the Ycoordinate below 7 cm and the corresponding value for the Z coordinate (elevation) was below 11 cm; within the acceptable range for extracting planimetric coordinate data for the selected test points. No significant residual parallaxes were noticed during stereo compilation in any of the 3 stereomodels that cover the test area.
Fig. 2.5: Schematic diagram of the Photogrammetric Processes involved in the Study
2.3.2.1 Stereo Observations (3D)
A stereoscopic pointing of the curser was carefully made individually at each test point and its threedimensional coordinate data was captured. This step is carried out by the operator pointing to a data point only in one (left) image, the conjugate image point is then obtained
Photogr ammetr ic Mapping
Geodetic Contr ol
3D Point Data Collection 2D Point Data Collection
Ster eo Model Or ientation
DEM Data Gener ation
Or thophoto Gener ation Aer ial Tr iangulation
Digital Imager y
Photogr ammetr ic Mapping
Geodetic Contr ol
3D Point Data Collection 2D Point Data Collection
Ster eo Model Or ientation
DEM Data Gener ation
Or thophoto Gener ation Aer ial Tr iangulation
Digital Imager y
Photogr ammetr ic Mapping
Geodetic Contr ol
3D Point Data Collection 2D Point Data Collection
Ster eo Model Or ientation
DEM Data Gener ation
Or thophoto Gener ation Aer ial Tr iangulation
through automated image correlation. This process was performed using the Least Square Matching (LSM) technique which has been reported to be the most accurate approach [8, 10] . The matching results are displayed and the correlation coefficient was reviewed to monitor the matching quality.
It has already been pointed out that the test points were grouped in 10 pointtype feature categories. All the test points falling in a specific category were observed in sequence in order to validate the statistical analysis for points included in the same category. The building corners were observed at the roof level, while all the points in the remaining 9 categories were measured at their estimated ground position. This procedure was followed for all the test points and the resulting 3D coordinate data is given in Table I1 in AppendixI. This provided one of the two data sets required for this study.
2.3.2.2 Orthophoto Observations (2D)
This required the generation of an orthophoto for the selected test area. A prerequisite for the digital production of orthorectified imagery, is that the camera tilts and the terrain heights of the area should be known [5]. While the attitude determination of the camera is performed during the process of aerial triangulation, the terrain heights are produced by generating a digital terrain model.
Digital terrain data is also captured at a DPW. For normal map production, breaklines are appropriately identified as to the planimetric features that they correspond to, and manual data capture methods are used for breakline data capture. Additional mass points are added to the linear features with automated correlation method with manual checking. The resulting Digital Terrain Model (DTM) will then correctly represent the terrain surface.
In this study, however, the primary objective is to investigate the feasibility of using an orthorectified image to provide a method for rapid map revision, as an alternative to conventional 3D digital mapping. Any effort channeled towards the capture of breaklines would have essentially required the mapping of all buildings and similar manmade features, which essentially is a laborintensive process. Consequently, the capture of the breaklines
15]. But, the elevation data using this approach would have also generated elevation data points on top of buildings, trees and other elevated features, thereby creating a Digital Surface Model (DSM) instead of a DTM [1, 27]. In the absence of breaklines representing buildings, there is no geometrically valid approach to interpolate a regular Digital Elevation Model (DEM) grid from such DSM. It is also necessary that he orthorectified imagery used for this study should be based on a groundlevel DEM to conform to the orthorectified imagery in the existing MOMRA geodatabase, for the applicability of any conclusions based on this study. It was, therefore, decided to manually capture the elevation data from the stereo models. The elevation data for ground points along the roads and other open spaces, at an average spacing of about 15 to 20 m to reflect any changes in the terrain slope, was measured. This elevation dataset defined a Triangulated Irregular Network (TIN) surface from which a regular DEM at 10meter post spacing was interpolated. All the points in this DEM lie on the ground and therefore, the elevation for all buildings are interpolated based on the elevation of adjacent street level; the building heights are completely ignored.
The aerial photos had been scanned at 14 m resolution, that for a 1:5,500 average photo scale had resulted in Ground Sampling Distance (GSD) of 7.7 cm in the scanned imagery. Ortho rectification of only 2 images was needed to cover the test area. The image, the DEM data, and the orientation data from aerial triangulation solution were then combined to generate orthophotos at ImageStation using OrthoMaster software package marketed by Inpho.
Finally, 2D coordinate data for the test points was captured by digitizing the orthophoto image displayed on the screen of ImageStation. Any test point appearing in both ortho rectified images was measured in the image where the point fell closer to the image center, since the positional error in a pixel on an orthophoto image due to residual errors in DEM elevation and camera orientation, increases with the pixel distance from the photo center [22]. The coordinate data is given in Table I2 in AppendixI. This concluded the data acquisition process for this study.
CHAPTER 3. MEASUREMENT DATA PROCESSING
The coordinate data for 100 test points was observed using two different methods as described in Chapter 2, and the data is tabulated in AppendixI. For a comparative analysis, it is necessary to calculate the resulting differences in the observed coordinates.
3.1 Coordinate Differences
Only differences in the Xcoordinate and the Ycoordinate will be considered, since no elevation data resulted from observations made on the orthophoto imagery. The most commonly used method for revising digital map is through acquisition and photogrammetric processing of new aerial imagery. Therefore, the coordinate data for the test points observed in 3D mode in a stereomodel and listed in Table I1 in AppendixI will be regarded as the ‘Base Data’ for coordinate comparison. The coordinate data observed manually in headsup 2D mode using orthophoto image is designated as ‘Ortho Data’ for this analysis. The differences in X and Ycoordinate of the Ortho Data from the Base Data were computed and are also shown in Table I1.
3.2 Horizontal Accuracy
The use of the Geospatial Positioning Accuracy Standards, Part 3: National Standard for Spatial Data Accuracy (NSSDA) was considered to statistically analyze the coordinate differences [26]. This data accuracy standard has been established by the U.S. Federal Geographic Data Committee (FGDC) and implements a welldefined statistic and testing methodology for positional accuracy of points on maps and in digital geospatial data, with respect to georeferenced ground positions of higher accuracy. This standard replaced the older United States national Map Accuracy Standard that had been in use since 1947 [25].
The NSSDA uses rootmeansquare error (RMSE) to estimate positional accuracy. RMSE is the square root of the average of the set of squared differences between the coordinate values of the data set being checked and the coordinate values from an independent source of higher accuracy for identical points. The accuracy is reported in ground distances at the 95% confidence level. Accuracy reported at the 95% confidence level means that 95% of the positions in the data set being tested have an error with respect to true ground position that is
uncertainties, including those introduced by geodetic control coordinates, compilation, and final computation of ground coordinate values in the product. In order to apply NSSDA, the following requirement has been emphasized: Test horizontal accuracy by comparing the planimetric coordinates of welldefined ground points with coordinates of the same points from an independent source of higher accuracy. Select check source so that its accuracy is within onethird the accuracy of the data set the at the 98% confidence level. Welldefined points are features that can be identified within a precision of onethird of the maximum expected uncertainty for the data set. It is to be noted that if the check data set is at least three times more precise than the data set being checked, the check data set can then be statistically regarded to be errorless. Therefore, NSSDA evaluates the data accuracy relative to an errorless data set and, therefore, corresponds to checking the absolute accuracy.
If NSSDA procedure is adopted for this study to compare the ortho data with the corresponding base data, the NSSDA criteria stated above are not fully met. Both the data sets being compared were produced by using different photogrammetric methods but were derived from common digital imagery and stereomodel; the base data is also burdened with the normal photogrammetric measurement errors and cannot be regarded as errorless. However, the use of NSSDA procedure is justifiable as long as it is clearly understood that the results provide a measure for the accuracy of ortho data relative to the base data. Consequently, this standard was adopted for this study.
3.3 NSSDA Computation
The horizontal accuracy according to NSSDA is computed as follows. Let:
RMSEx = (RMSEx = sqrt[3(x data, i x check, i) 2 /n])
RMSEy = (RMSEy = sqrt[3(y data, i y check, i) 2 /n])
x data, i, y data, i are the coordinates of the i th check point in the dataset being checked
x check, i, y check, i are the coordinates of the i th check point in the independent source of higher accuracy
n is the number of check points tested
i is an integer ranging from 1 to n
Horizontal error at point i is defined as [(x data, i x check, i) 2 +(y data, i y check, i) 2 ].
Horizontal RMSE is:
RMSEr = [S((x data, i x check, i) 2 +(y data, i y check, i) 2 )/n] RMSEr = [RMSEx 2 + RMSEy 2 ]
It is assumed that systematic errors have been eliminated as best as possible. If error is normally distributed and independent in each the x and ycomponent and error, the factor 2.4477 is used to compute horizontal accuracy at the 95% confidence level [25]. When the preceding conditions apply, Accuracyr , the accuracy value according to NSSDA, shall be computed by the formula:
Accuracyr = 2.4477 * RMSEx = 2.4477 * RMSEy
= 2.4477 * RMSEr /1.4142
Accuracyr = 1.7308 * RMSEr
The above accuracy calculation has been carried out, separately for each point feature type category and the results are shown in Table 3.1.
The details of the above computation from the two data sets being compared can be seen in AppendixI. As already pointed out, the test points should be welldefined, clear and well distributed in the test area. In spite of the care exercised in the selection of the test data points, it is noticed that one data point in 5 of the 10 different feature categories resulted in very poor observation; most erroneous observations appear to be blunders. Such poor measurements resulted in coordinate differences varying from 50 cm to 229 cm. Such errors are most likely attributable to the difficulty faced in interpreting the exact ground point for features like a light pole on the orthophoto image during headsup digitizing. A closer examination of the test points on the orthophoto image indicated that the light pole that resulted in erroneous measurement (Point No. 87 in Table I1) is located next to a tree and its base is not seen clearly in the image. Similarly, the Test Point No. 100, which is a Street Lamp (Single), is located next to a building. This makes it hard to clearly distinguish its base point on the orthophoto image.
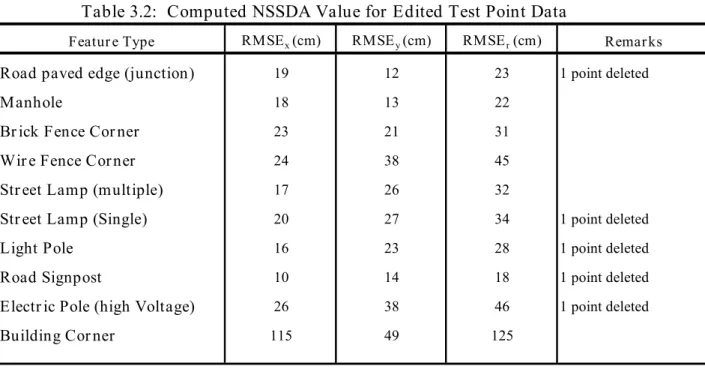
The coordinate difference data for 5 of the points (5 percent of the total measurement data) was removed from consideration and the NSSDA values were recomputed. The results of this revised computation on the edited data set are given in Table 3.2.
Tab le 3.1: Comp uted NSSDA Value for Ob ser ved Test Poin t Data
Featu re T ype RM SE x (cm) RM SE y (cm) RMSE r (cm) Remarks
Road pa ved edge (j unction) 25 20 32 1 bad observation
M anh ole 18 13 22
Br ick Fence Cor ner 23 21 31
Wi re Fence Cor ner 24 38 45
St r eet L amp (mult iple) 17 26 32
St r eet L amp (Single) 20 42 47 1 bad observation
L ight P ole 17 38 41 1 bad observation
Road Signpost 12 36 38 1 bad observation
E lectr ic P ole (high Volt age) 26 82 86 1 bad observation
3.4 Time and Cost Considerations
The test point data acquired through the use of two different photogrammetric methods has been analyzed for relative accuracy. Even if the accuracy achievable by either method were acceptable, the time and cost are the overriding considerations to prefer the use of one method to the other. Photogrammetric data acquisition requires the same initial processes whether the data is captured as vector data in 3D mode from stereo models or as vector data by digitizing in 2D mode on orthorectified raster images. As illustrated in Fig. 2.5, the common processes include the acquisition of aerial imagery, directly through digital aerial cameras or by scanning aerial photography, the monumentation, measurement and signalizing of the ground control points, and performing the aerial triangulation of the aerial imagery block.
When the production times of vector and raster (orthophoto) maps are compared, it is clearly seen that the latter has significant advantage. As an example; 1 kmx1 km area can be covered almost by three models from aerial imagery at 1:5,500 scale. It is estimated that about 20 operatorhours are needed to produce orthophotos covering this area. On the other hand, an estimated 60 operatorhours will be needed to produce a vector map of the same area. The
Table 3.2: Computed NSSDA Value for Edited Test Point Data
Featur e Type RMSE x (cm) RMSE y (cm) RMSE r (cm) Remar ks
Road paved edge (junction) 19 12 23 1 point deleted
Manhole 18 13 22
Br ick Fence Cor ner 23 21 31
Wir e Fence Cor ner 24 38 45
Str eet Lamp (multiple) 17 26 32
Str eet Lamp (Single) 20 27 34 1 point deleted
Light Pole 16 23 28 1 point deleted
Road Signpost 10 14 18 1 point deleted
Electr ic Pole (high Voltage) 26 38 46 1 point deleted
completion of aerial triangulation, the cost of mapping from orthophotos may be about one third of the cost of stereo map production. Based on international (somewhat standardized) rates, an estimated cost of various processes involved in digital photogrammetric mapping are given in the following tabulated below [14]. aerial photography $4000 for mobilization; plus $10 per image scanning of photos $15 per image aerial triangulation $25 per image digital elevation model $120 per image digital orthophoto $30 per image mosaicking of ortho images $20 per image.
On screen digitizing by stereoworkstations or in the orthophotos is labor intensive, and it may vary with the density of details in the image, e.g. it may vary from 10 hrs/image for rural areas to 100 hrs/image for dense urban scenes. This is why many photogrammetric mapping companies doing business in the developed countries having labor rates of more than $50/hour, have started joint ventures with institutions in countries with labor costs even less than $20/hour for photogrammetric compilation and for extracting GIS information from aerial images [14 ].
However, when we consider the extraction of vector data from orthorectified raster images, the hourly rate advantage mentioned above disappears. Interpreting and extracting the features on ortho images is much more difficult in comparison with stereo models. Even an experienced operator may require about 40 hours for map compilation from some ortho images. Difficulty grows as the ortho image scale becomes smaller [12]. The operator has to give much more attention to define the features correctly and consequently, spends more time for data acquisition.
CHAPTER 4. ANALYSIS OF RESULTS AND CONCLUSIONS
4.1 Map Data Reliability
For the test data used in the study, the values for computed NSSDA estimates are summarized in Table 3.2 and represent the accuracy of the ortho data relative to the base data. Both the data sets were derived from 1:5,500 scale digital imagery which is the standard image scale used by MOMRA for the digital photogrammetric stereo compilation of data for display at 1:1,000 map scale. The MOMRA Map Accuracy Standard specifies the following limiting planimetric accuracy for 1:1,000 map scale [18]:
RMSEx = RMSEy = 15 cm
The results given in Table 3.2 indicate that the NSSDA value for Xcoordinate varies from 10 cm to 26 cm for all feature types except the building roof corners. The corresponding statistic for the Ycoordinate varies from 12 cm to 38 cm. The NSSDA accuracy is derived from the coordinate RMSE value from:
NSSDA Accuracy = 2.4477 * RMSEx = 2.4477 * RMSEy
Accordingly, the MOMRA Map Accuracy Standard for planimetric coordinate data corresponds to NSSDA value of 15 cm * 2.4477 = 37 cm. The NSSDA values given in Table 3.2 fall well within this limiting value for the Xcoordinate measurements for all feature types except the building roof corners. Similar results for the Ycoordinate are also within the limiting value of 37 cm with the exception of Electric Pole (high voltage) feature type, in which case the value of 38 cm exceeds the permissible value by merely 1 cm.
The above analysis indicates that if digital map data for point features is extracted from 2D raster orthophoto images, there is a 95 percent probability that the data error in the resulting Xcoordinate or Ycoordinate will not exceed the MOMRA Map Accuracy Standard relative to the coordinate accuracy value specified for similar data obtained by using the standard stereo digital photogrammetric methods. Therefore, from the accuracy considerations, digitizing from orthophoto images can provide a viable alternative for rapid revision of maps at 1:1,000 or smaller scales.
There is a significant problem, however, when it comes to capturing the buildings in ortho rectified aerial imagery. Constrained due to the geometry of a perspective aerial image, it is a common photogrammetric practice to map the buildings with vertical walls by tracing roof tops of the building which are more clearly identifiable in the image. This does not pose any problem in a 3D stereo data capture environment, because the roof corner and the corresponding base corner of a building are mapped at the same location. The situation in 2D mapping from orthorectified images is more complex; the result would depend entirely on the surface geometry of the DEM used for the orthorectification of the image [27].
If the DEM used for rectification is derived from a DTM, then it correctly models the surface at the ground level only, and will not be representative of the elevated features such as building roofs, water tower, etc. Consequently, all the features elevated above the ground will be displaced from their correct planimetric position in the orthorectified image. In this study, it was deliberately planned to use only the height data points located on the ground for deriving a DEM for ortho rectification in order to assess the extent of error caused by the building height. This explains why very large (exceeding 1 meter in the Easting) differences are observed in the measured base coordinate data and the ortho coordinate data. If the use of orthorectified imagery for rapid map revision has to be adopted, an alternative approach for obtaining a more reliable DEM data must be explored.
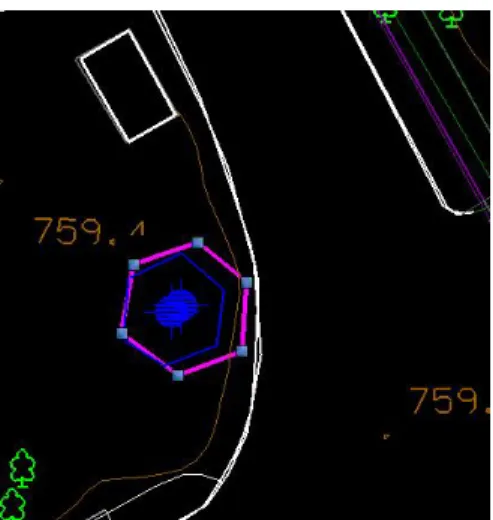
The point features which are located on the ground surface such as manhole, paved road vertex (sharp junctions), base of thin street lamps provide reasonably high accuracy results. But features near the building, tree or other elevated features cannot be accurately positioned, and sometimes are difficult to even define correctly. As an example, the mapped position of a water tower is shown in Fig. 4.1, where the tower outline mapped by 2D digitizing in orthophoto image is highlighted. It is noticeable in Fig. 4.1 that even though the mapping from orthophoto has
Fig. 4.1: Overlapping Mapping of a Water Tower Using Both Methods
correctly captured the scale, the displacement due to the height of the tower has distorted its shape and caused about 1.5 meter increase in its size.
On the other hand, defining and compiling features such as a water tower or buildings are rather easy but the resulting positional accuracy is not acceptable. Many buildings in the test area are 6 to 10 meter high. As seen in Table 3.2, this has caused a degradation in the positional accuracy to about ±1meter in the flight direction.. Clearly, the higher the building, the worse will be the planimetric accuracy. The vector data for a mosque building, resulting from both the data capture methods is displayed in Fig. 4.2. It can be clearly seen that some of the building details cannot be seen on ortho images, which has resulted in giving a different architectural shape to the building. Also the shift in the location of the minaret top in the orthophoto map is noticeable.
Another problem faced in compiling from ortho images is the confusion caused in distinguishing some line string features such as ditch, oil or water pipeline, etc. from track, path, railroad, or vice versa. Such confusion in feature identification can only be resolved in the field, thereby creating extra burden to the field verification and completion tasks.
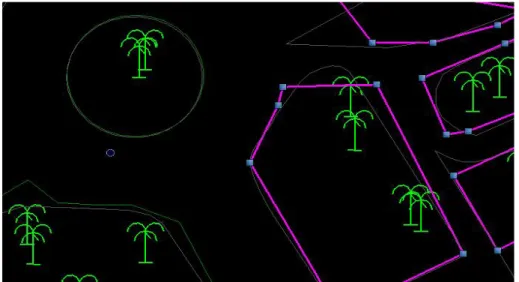
Yet another noteworthy feature of mapping from orthophotos is the dominating role of the background color on the orthophoto in extracting some features such as manhole, electric box, etc. The street light poles and the electrical poles can be easily mapped when located in open areas, but it may sometimes be difficult to distinguish between them, especially when located in the vicinity of trees or buildings. Also some elevated features such as buildings, trees, walls, etc. may obscure some area in immediate vicinity due to shadows as is the case shown in Figure 4.3, thereby causing errors in feature compilation or even complete loss of some of the vector data.
Figure 4.3: The tree shadows affect the data extraction in 2D
4.2 Comparative Analysis of Methodology
Based on the experience gained through this study, the following provides a comparative analysis between the 2D method of headsup digitizing on orthophoto images and the method of 3D stereo photogrammetric data compilation:
§ Most of the scattered trees can be seen in 2D image but their position coordinates are generally 0.51m different from the 3D coordinates.