Influence of different extraction techniques on the chemical profile and
biological properties of Anthemis cotula L.: Multifunctional aspects for potential pharmaceutical applicati...
Article in Journal of Pharmaceutical and Biomedical Analysis · May 2019
DOI: 10.1016/j.jpba.2019.05.028 CITATIONS 7 READS 213 12 authors, including:
Some of the authors of this publication are also working on these related projects:
Metabolomic for nutraceutical studies View project
Chemical Fingerprint of plant-derived materials and biological activities evaluation View project Stefania Sut University of Padova 99 PUBLICATIONS 735 CITATIONS SEE PROFILE Stefano Dall'Acqua University of Padova 272 PUBLICATIONS 3,473 CITATIONS SEE PROFILE Gokhan Zengin Selcuk University 611 PUBLICATIONS 5,844 CITATIONS SEE PROFILE İsmail Şenkardeş Marmara University 41 PUBLICATIONS 204 CITATIONS SEE PROFILE
All content following this page was uploaded by Alena Stupar on 22 May 2019.
Title: Influence of different extraction techniques on the chemical profile and biological properties of Anthemis cotula L.: Multifunctional aspects for potential pharmaceutical applications
Authors: Stefania Sut, Stefano Dall’Acqua, Gokhan Zengin, Ismail Senkardes, Gizem Bulut, Aleksandra Cvetanovi´c, Alena Stupar, Anamarija Mandi´c, Carene Picot-Allain, Ahmet Dogan, Kouadio Ibrahime Sinan, Fawzi Mahomoodally
PII: S0731-7085(19)30621-1
DOI: https://doi.org/10.1016/j.jpba.2019.05.028
Reference: PBA 12660
To appear in: Journal of Pharmaceutical and Biomedical Analysis
Received date: 11 March 2019
Revised date: 12 May 2019
Accepted date: 13 May 2019
Please cite this article as: Sut S, Dall’Acqua S, Zengin G, Senkardes I, Bulut G, Cvetanovi´c A, Stupar A, Mandi´c A, Picot-Allain C, Dogan A, Ibrahime Sinan K, Mahomoodally F, Influence of different extraction techniques on the chemical profile and biological properties of Anthemis cotula L.: Multifunctional aspects for potential pharmaceutical applications, Journal of Pharmaceutical and Biomedical Analysis (2019), https://doi.org/10.1016/j.jpba.2019.05.028
This is a PDF file of an unedited manuscript that has been accepted for publication. As a service to our customers we are providing this early version of the manuscript. The manuscript will undergo copyediting, typesetting, and review of the resulting proof before it is published in its final form. Please note that during the production process errors may be discovered which could affect the content, and all legal disclaimers that apply to the journal pertain.
Influence of different extraction techniques on the chemical profile and biological properties of Anthemis cotula L.: Multifunctional aspects for potential pharmaceutical
applications
Stefania Sut1, Stefano Dall’Acqua2, Gokhan Zengin3*, Ismail Senkardes4, Gizem Bulut4,
Aleksandra Cvetanović5, Alena Stupar6, Anamarija Mandić6, Carene Picot-Allain7, Ahmet
Dogan4, Kouadio Ibrahime Sinan3, Fawzi Mahomoodally7
1DAFNAE, Department of Agronomy, Food, Natural Resources, Animals and Environment,
Agripolis Campus, University of Padova, 35020 Legnaro (PD), Italy
2Department of Pharmaceutical and Pharmacological Sciences, University of Padova, Via
Marzolo 5, 35131 Padova, Italy
3Department of Biology, Science Faculty, Selcuk University, Campus, Konya, Turkey
4Department of Pharmaceutical Botany, Pharmacy Faculty, Marmara University, Istanbul,
Turkey.
5Faculty of Technology, University of Novi Sad, Bulevar Cara Lazara 1, 21000, Novi Sad,
Serbia
6 Institute for food technology, University of Novi Sad, Bulevar Cara Lazara 1, 21000, Novi
Sad, Serbia
7Department of Health Sciences, Faculty of Science, University of Mauritius, Réduit,
Mauritius
* Corresponding author: Dr. Gokhan ZENGIN, (E-mail address: [email protected])
Graphical abstract
Highlights
Different extracts from Anthemis cotula were obtained by using several techniques.
Biological and chemical profiles of the extracts were detected.
NMRand HPLC-DAD-MSn were used to detect chemical profiles.
Ultrasound assisted extract (UAE) contained the high level of sesquiterpenoids.
This work could be significant to design innovative products from A. cotula.
Abstract
The phytochemical composition of different extracts obtained from stinking chamomile (Anthemis cotula L.) was investigated. Ethanol was used as solvent and accelerated solvent extraction (ASE), microwave assisted extraction (MAE), maceration, soxhlet extraction (SE), and ultrasound assisted extraction (UAE) were applied on plant material. Comparison of the phytochemical contents, antioxidant, and enzyme inhibitory properties were performed. The most abundant sesquiterpene in the extracts was anthecotuloide, while the most present
phenolics were caffeoyl quinic acid, quercetin, and kaempferol derivatives. UAE extract was the most efficient in the extraction of sesquiterpenoids and polyphenols. Considering the assays on antioxidant activity and enzyme inhibition, ASE extract showed highest phenolic content (62.92 mg gallic acid equivalent/g extract). Likewise, this extract showed highest radical scavenging (103.44 mg trolox equivalent [TE]/g extract and 155.70 mg TE/g extract, for DPPH and ABTS assays respectively) and reducing power potential (435.32 and 317.89 mg TE/g extract, for CUPRAC and FRAP assays, respectively). The different extracts showed similar results in the enzyme inhibition assays suggesting that the extraction methods used have no effect on observed enzyme activities. Novelty of our findings are the inhibitory action of the ethanol extract of A. cotula aerial parts on key enzymes associated with Alzheimer’s disease (acetyl cholinesterase, butyryl cholinesterase), type 2 diabetes (α-amylase, α-glucosidase), and skin hyperpigmentation disorders (tyrosinase). Data collected from the present work further appraises the multiple potential biological properties of stinking chamomile suggesting the need for further investigation on its constituents.
Keywords: Anthemis cotula; 1H-NMR; anthecotuloide; sesquiterpenoids; antioxidant; enzyme
inhibitor
Introduction
The genus Anthemis (synonym Matricaria) comprises of 210 species geographically distributed across the Mediterranean region, Europe, southwest Asia, and South Africa. Since Roman times, several species of the Anthemis genus have been used in traditional medicine [1]. A. nobilis has been used as diaphoretic, emetic, antispasmodic, sedative, carminative, and against intestinal cramps [2]. The flowers and aerial parts of A. cretica have been used against stomach pain and kidney stone [3]. An infusion of A. aciphylla was taken against intestinal and
abdominal colic while a decoction was applied to sun burns and skin inflammation [4]. A. cotula has been used to treat psoriasis, fever, gastrointestinal problems, dysentery, and gouty arthritis. A paste prepared by mixing 50 mL of powdered A. cotula flowers with 15 mL olive oil was applied 3 to 5 times daily to treat psoriasis and the juice of A. cotula is used as an insect repellent [5].
Pharmacological studies have been performed to evaluate the potential activities of Anthemis species. Recent data have demonstrated that essential oil extracted from A. scrobicularis aerial parts possessed mosquito repellent properties, thereby having potential usefulness in the shielding mosquito borne diseases [6]. Flavonoids (such as patuletin and kaempferol) isolated from A. cotula flowers and essential oil extracted from A. xylopoda leaves and flowers showed antimicrobial activity [7]. Additionally, the chloroformic extract of A. nobilis exhibited cell cycle arrest properties and induction of apoptosis in human oral squamous cancer cell [8]. From phytochemical point of view the A. cotula is known for producing sesquiterpene lactone named anthecotuloide (or anthecotulide) that is considered an allergenic sesquiterpene lactone [9]. Isolation of anthecotuloide and derivatives have been reported and derivatives presenting different presence of double bond as well as hydroxyl, keto or peroxide groups have been described. For these reasons Anthemis cotula have been investigated with attention on sesquiterpene lactones [10]
A strong body of evidence tend to show the multiple pharmacological activities of several species of the Anthemis genus. Up to our knowledge, limited information is available about the A. cotula, also known as “stinking chamomile”. Nevertheless, Anthemis can be considered as a valuable source of potentially bioactive constituents. Several species of the Anthemis genus have been used in traditional medicine to manage diabetes, epidermal related, and neurological related problems. Chemotaxonomic approach asserts that members of the same family of plants might possess different degree of biological activity. Yet, there is a dearth
of scientific data regarding the biological activity of A. cotula on key enzymes targeted in the management of the diabetes (amylase and glucosidase), Alzheimer’s disease (cholisterases), and epidermal hyperpigmentation conditions (tyrosinase). Furthermore, A. cotula has not received due scientific attention pertaining to its possible antioxidant potential. In this study different extraction methods, namely accelerated solvent extraction (ASE), microwave assisted extraction (MAE), maceration, soxhlet extraction (SE), and ultrasound assisted extraction (UAE), were employed to prepare extracts from plant materials and the phytochemical contents of the different extracts were compared. Furthermore, the biological activity of A. cotula was investigated using different assays. Data generated by this study will provide an additional insight of the possible biological activity of A. cotula. Furthermore, results collected from this study can offer preliminary information on the possible exploitation of this species for obtaining bioactive fractions for pharmaceutical applications.
2. Materials and Methods
2.1. Collection of plant material
Sampling of the plant species was done in Kastamonu (Taskopru, Karacaoglu village), Turkey in the year 2017. Botanical authentication of the plant was done by the botanist Dr. Ismail Senkardes (Marmara University, Department of Pharmaceutical Botany, Istanbul, Turkey, Voucher Number: MARE-19031). The aerial parts were dried at room temperature (in shade, about 10 days). These materials were then powdered by using a laboratory mill.
2.2. Extraction techniques
Accelerated solvent extraction (ASE)
To obtain ASE extract, ASE 350 system Dionex Corporation (Sunnyvale, CA, USA) was used. One gram of herbal samples was mixed with 250 mg diatomic earth in 22 mL cells equipped with a stainless steel frit and a cellulose filter at the bottom to avoid collection of suspended particles in the collection vial. Extract were prepared using ethanol (96%, w/w) as
solvent and performed at 1500 psi and temperature of 120 °C, and then heated for 6 min, applying one extraction cycle of 5 min. The cells were rinsed with fresh extraction solvent (30%
of the extraction cell volume) and purged with N2 gas for 30 s and extracts were collected into
50 mL tubes.
Microwave-assisted extraction (MAE)
Five grams of herbal materials were extracted with ethanol (100 mL, 96%, w/w, 1:20 ratio). The extractions were done in an open system during 30 min at 600 W.
Maceration
Regarding preparation of maceration extract, five grams of herbal materials were macerated overnight with ethanol (100 mL, 96%, w/w) at room temperature, in the dark.
Soxhlet extraction (SE)
Five grams of herbal materials were extracted with 100 mL of ethanol (96%, w/w) by using a Soxhlet apparatus for 6 h.
Ultrasonication-assisted extraction (UAE)
Two grams of herbal materials were extracted with ethanol (50 mL, 96%, w/w) for 60 min by using a sonication bath (30 °C).
To remove ethanol, all extracts were concentrated by using a rotary vacuum evaporator (under vacuum, at 40 °C). These samples were kept in the dark until use (at 4 °C). Yields of extracts were indicated in Table 1.
2.3. Profile of bioactive compounds
By referring to our previous paper [11], the flavonoids (TFC) and total phenolic (TPC)
contents were determined on the basis of AlCl3 and standard Folin-Ciocalteu assays,
respectively. The results were expressed as equivalent of rutin (mg RE/g) for TFC and gallic acid equivalent (mg GAE/g) for TPC.
Dried extracts were dissolved using deuterated methanol for analyzing the presence of the more hydrophilic compounds or deuterated chloroform for the evaluation of lipophilic part.
Bruker Avance III spectrometer operating at 400 MHz for 1H and 100 MHz for 13C was used
operating with software Topspin. For the quantification of anthecotuloide a portion of 10 mg of dried extract was dissolved in chloroform and mixed with 1 mg caffeine. Solvent was added (2 mL) and solution was sonicated for 5 min. Then the solution was decanted and transferred to NMR tube. Quantification was achieved using a method previously reported in literature [12], signals of H-6 of sesquiterpene derivative was used for quantification purposes as described in the result part.
Quali-quantitative analysis of phytoconstituents derivatives was obtained by
HPLC-DAD-MSn using an Agilent 1260 chromatograph (Santa Clara, CA, USA) equipped with 1260
diode array (DAD) and ion trap (IT) mass spectrometer Varian MS-500. Agilent Eclipse XDB C-18 (3.0 × 150 mm) 3.5 µm was used as stationary phase. Acetonitrile (A) and water 0.1% formic acid (B), were used as mobile phases with a flow rate of 400 µL/min. The elution gradient started at (90:10) A:B then in 30 min go to (10:90) A:B and is isocratic for 10 min. Re equilibration time was 5 min to initial conditions. At the end of the column a “T” connector splitted the eluent flow to the two detectors namely the DAD and the IT. The DAD detector was used to quantify the sesquiterpene and the phenolic compounds and rutin, chlorogenic acids were used as reference compounds. For the sesquiterpene, anthecotuloide and its derivatives were used.
The chromatograms were monitored at 280, 330 and 350 nm and UV-Vis spectra were acquired in the range of 200-650 nm and were used to assign different peaks to each class of constituents. The sample injection volume was 10 µL. MS spectra were recorded in negative
and in positive ion mode in 50–2000 Da range, using ESI ion source. Fragmentation of the main ionic species were obtained by the turbo data depending scanning (TDDS) function. Identification of compounds was obtained matching the fragmentation spectra as well as by comparison with the literature and injection of available reference compounds [13-16]. Quantification of phytoconstituents was obtained using the method of calibration curve and rutin, chlorogenic acid, and a partially purified fraction of anthecotuloide were used as external standards for quantification of flavonoid, caffeoylquinic acid derivatives, and anthecotuloide derivatives, respectively. Calibration curves were as follows: rutin y = 26,12x + 230,7 (r² = 0,9989); chlorogenic acid y = 44,214x + 32,41 (r² = 0,9994); anthecotuloide y = 10,121x +
0,1367 (r² = 0.9992). For the HPLC-DAD-ESI-MSn analysis dried extracts were weighted (5
mg ±0.01 mg) in triplicate and extracted using methanol as solvent (4 mL) using with ultrasound bath up to complete dissolution of solid materials. Solution was transferred to volumetric flask (5 mL) and volume was adjusted with methanol. Solutions were used for the analysis. Results of the quantitative analysis of the dried extracts are expressed as mean values of triplicate ± standard deviation.
2.4. Determination of antioxidant and enzyme inhibitory effects
The in vitro enzyme inhibitors effects of extracts on four enzymes, that are α-amylase, α-glucosidase, cholinesterases, and tyrosinase were evaluated, as previously reported [11]. The enzyme inhibitor actions of samples were assessed as equivalents of kojic acid (KAE) for tyrosinase, galantamine (GALAE) for acetyl cholinesterase (AChE) and butyryl cholinesterase (BChE), and acarbose (ACAE) for α-amylase and α-glucosidase.
Regarding antioxidant capacity of the samples, different experiments as ferrous ion chelating, phosphomolybdenum and radicals scavenging tests (FRAP, ABTS, CUPRAC, and
DPPH) were spectrophotometrically screened. The findings were given as standard equivalents of EDTA and Trolox (mg EDTAE/g and mmol TE/g). The assay methods were given in our earlier work [11].
2.5. Statistical analysis
Firstly Shapiro-Wilk test was done to test the normality of variables. Then One-way ANOVA (with the Tukey’s post hoc test) or Kruskal-Wallis (followed by the Dunn’s post hoc test) were applied to determine any differences between the different extraction methods whether variables were normality distributed or non-normally distributed respectively. p < 0.05 were assigned to be statistically significant. Pearson linear correlation were employed to recognize any relationship between phytochemical contents and the observed biological activities. Besides, partial least squares discriminant analysis (PLS-DA) analysis and the heat map were done to classify the performed extraction methods. The statistical procedures were performed by R software v. 3.5.1 with the package mixOmics.
3. Results and Discussion Phytochemical profiling
Traditional solid-liquid extraction techniques such as maceration, percolation, and soxhlet extraction are time-consuming, less efficient, and require large volumes of solvents. Non-conventional extraction techniques, in compliance with environmentally friendly analytical chemistry methods, provide rapid processing of samples, higher reproducibility, and require low quantities of solvents [17]. Limited information is available on the difference in phytochemical composition of extracts obtained from the same plant material, but with different
extraction techniques. In this study the phytochemical composition and the biological properties of A. cotula extracts obtained with different approaches will be studied.
Phenolic compounds are ubiquitously found in plants and are known to possess numerous biological activities. Therefore, while determining possible biological action of medicinal plants, taking into account the phenolic composition is crucial. Thus, as a first step we performed simple spectrophotometric analysis that allowed an evaluation of total phenolic contents. As shown in Table 1, extract of A. cotula obtained by ASE possessed highest phenolic content. The flavonoid content of the different extracts followed this order UAE> ASE> maceration> MAE> SE. This finding corroborates with a study conducted by Wang et al. [18], who reported that UAE was an efficient technique for the extraction of flavonoids from plants. A general consideration can be drawn considering the yield of the obtained dried extracts, and ASE and SE have high yield larger than 10%. This should be taken into account if the extraction is performed to produce extracts for example for medicinal purposes. Obviously the extracts obtained using increasing temperature as ASE, MAE and SE have higher yield compared to maceration. The information about the constituents that can be obtained using the spectrophotometric assays can give initial results but more detailed information on the effectiveness of the extraction can be needed especially related to different classes of phenolics and other classes of phytoconstituents. A. cotula is known for containing sesquiterpene lactones and such compound cannot be detected without interference by other constituents using simple spectrophotometric methods. Therefore, NMR and LC-DAD-ESI-MS approaches were used in order to have more complete view of the A. cotula phytoconstituents.
1H-NMR of the extracts were obtained using two different solvents, in deuterated
chloroform to observe the lipophilic constituents and in deuterated methanol to study the more
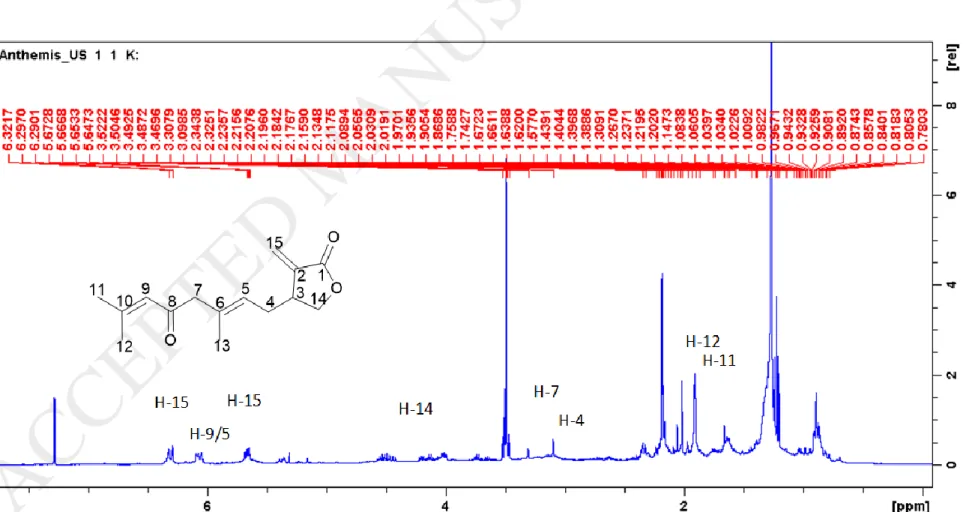
hydrophilic compounds. The 1H-NMR obtained from the chloroform soluble fraction of
methanol extract showed signals that support the presence of anthecotuloide and related
sesquiterpene. In particular sp2 protons and sp2 CH2 are detected (See Table 2) and showed long range correlations in HMBC spectrum with carbonyl function of lactone ring (δ 170), sp3 CH (δ 38-39) and sp2 quaternary carbon (δ 137). Furthermore, other diagnostic signals are sp2 CH (See Table 1) as well as sp3 CH2 with characteristic chemical shifts namely δ H 3.10-3.30 δ C 46-55 as well as δ H 2.7-3.0 and δ C 37-38. The 1H-NMR data of the chloroform soluble fraction clearly revealed the presence of prevalent derivatives as sesquiterpene (Figure 1). Also, several figures were given as supplementary material (Figures S1-S6).
Diagnostic COSY, TOCSY, and HMBC correlations allowed the identification of main sesquiterpene as indicated in Table 2. Diagnostic signals for the different derivatives are detected from the doublets at δ 1.90 and 2.18 with carbon resonances at δ 155 10), 125.6 (C-9), 27 (C-11) and 21 (C-12) supporting the presence of the isopropenyl moiety as well as from H-9 (δ 6.06) with carbon resonances at δ 196.5 (C-8), C-10 and δ 55.5 (C-7). Diagnostic HMBC correlations are also observed from the signal at δ 1.66 (CH3 13) with resonances at δ 55.5 (C-7), 139 (C-6) and 123.4 (C-5). Finally, from sp2 signals ascribable to the CH2 in 4 (δ C 37.0) that present δH 2.38-2.43 (H-4) correlation can be observed with the C-6 and C-5 and also with carbon at δ 38.2 assigned to CH in position C-3. The lactonic ring is assigned with the HMBC observed from the methylene protons at δ 6.31-5.68 with carbons at δ 171.0 (C-1), 38.2 (C-3) and from the long range correlations observed from the protons at δ 4,50-4,01 (H-14) with the carbonyl function C-1. These data are in good agreement with structure of anthecotuloide, a sesquiterpene, abundant in the analyzed extract. The presence of other derivatives sharing large part of the structure can be observed from some key signals and correlations as summarized in Table 2. Diagnostic HSQC and HMBC correlation revealed the presence of derivative bearing peroxide group namely the 5-hydropoeroxy-6,13-dehydro-5,6-dihydroanthecotuloide. The NMR data allowed the observation of the position 5 characterized by proton at δ 4.31 (δ C 87.1) and the relative long range correlations observed from sp2 CH2 at δ 5.38-5.16 (δ C 121.6) with
C-5 (δ C 87.1) and C-7 (δ C 46.0) as well as from H-7 observed as a singlet at δ 3.33 (δ C 46.0) with carbon resonances C-5, C-6 (δ C 140.0), C-13 (δ C 121.6) and the carbonyl group at C-8 (δ C 200.2). Further diagnostic signals allow to assign the presence of 6,7 Z-Dehydro- 5,6-dihydroanthecotuloide, in particular the values of carbonyl group C-8 (δ C 190.0) that due to the conjugation of the two double bond present shielded chemical shift and long range correlations from the H-5 at δ 1.62 with C-8 and C-13 (δ 18.7). Signals due to other derivatives can be observed at lower intensity but due to superimposition of signals and similarity of structures no structure assignments can be obtained.
The methanol soluble fraction presents a more complex 1H-NMR spectrum showing
intense signals in the aliphatic parts, crowded region in the sugar portion (δ 3.00-4.5) and signals ascribable to the olefinic proton signals of sesquiterpenoids, furthermore signals due to aromatic protons are also observed in the region δ 6.00-7.50.
Thus, the NMR analysis showed that the main constituents of A. cotula were present in all the studied extracts. The main classes of phytoconstituents were sesquiterpenoids and phenolics such as caffeoyl derivatives and some flavonoids. General information obtained by NMR analysis of mixture can be improved by hyphenated technique that allow separation of
constituents and acquisition of spectral data. For this reason, LC-DAD-MSn approach was used
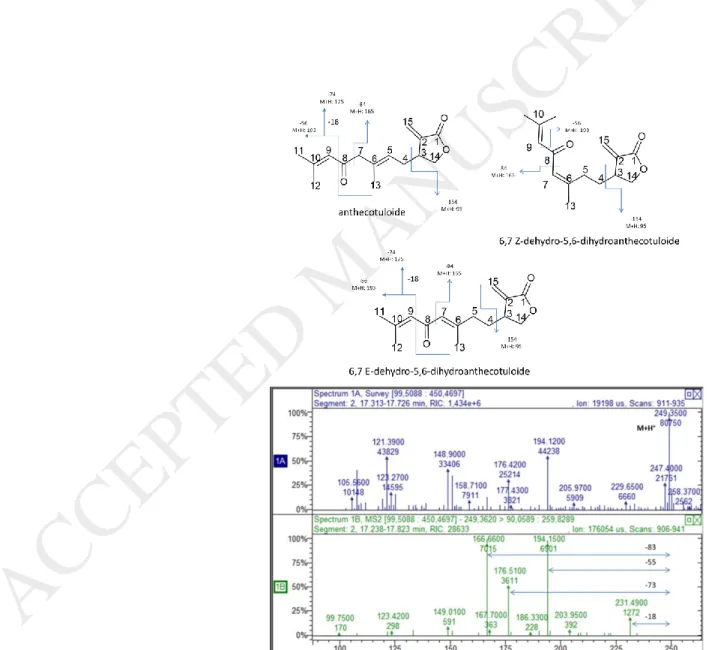
working in both in positive and negative ion mode. Data obtained observing UV spectra and the negative ion mode allowed the observation of several ion species that present fragmentation pathways related to phenolic constituents as glycosylated flavonoids and phenylpropanoid derivatives. Putative identification of compounds was reported in Table 3, confirmation of some constituents was obtained by comparison of spectral data with literature and injection of reference compounds. Referring to sesquiterpenoid, two peaks with UV max at 280 nm were detected in the time range 14-18 min. The corresponding positive ion mode MS trace showed the presence of intense signals with m/z 249. Three main peaks present intense ion at m/z 249
showing a very similar fragmentation pathway in particular with species at m/z 193 (-56 Da), 175 (-56, -18 Da), 165 (-84 Da), main fragments were indicated in the exemplificative spectrum in Figures 2 and 3. This finding is in agreement with previously published data [9, 10] that indicated the presence of three isomeric derivatives namely the anthecotuloide, 6,7 Z-dehydro-5,6-dihydroanthecotuloide, and 6,7 E-dehydro-5,6-dihydroanthecotuloide. Fragmentation pathways for the three isomers are different, anthecotuloide present strong MS2 signal at 193 while the other two derivatives presented more complex fragmentation patterns due to conjugation of the second double bond.
Peak at m/z 281, referred to hydroperoxy-6,13-dehydro-5,6-dihydro-anthecotuloide was observed and fragments at m/z 264 (-17), 247 (-34) indicated the presence of this derivative. For quantification of this compound by NMR, caffeine was used as internal standard as previously reported [12]. In this case we used the H-6 of the anthecotuloide compound for quantification. The extract once determined the amount of anthecotuloide was used to create calibration curve for quantitative HPLC-DAD measurements.
In order to evaluate the differences in term of extraction some marker compounds were selected, namely for phenolic derivatives and sesquiterpene and the results are reported in Table 4. Comparative chromatograms recorded at 254 nm are reported in Figure 4. The quantification of marker compounds in the extracts show on the other hand how much can be influenced the constituent by the different extraction conditions. The differences in type of extraction were not clear considering the GAE and RE values (Table 1) probably due to the interference of other type of constituents (as example reducing sugars for GAE or other pigments for RE) but resulted clear for the HPLC data. Maceration extracted less phenolic compounds compared to extraction methods using high temperature, namely, ASE, SE, and MAE. The differences between extracts obtained from different extraction methods can be also assessed considering the ratio of sum of extracted sesquiterpene/sum of extracted phenolics. For example, ASE and SE presented a ratio
of 1.02 and 0.97 while is 2.3 for MAE 2.83 for maceration, and is 5.0 for UAE. This reflects the difference ratio of different classes of phytoconstituents due to the various extracting procedures obtained with the same solvent. UAE appear to be the favorable in term of % of phenolics on dried extract reaching the highest value. On the other hand, the yield of extraction with UAE is much lower than for example in SE or ASE thus with the idea to develop an industrial extraction of those phenolics from the plant probably much more advantage can be obtained by methods reaching a higher yield and sufficiently high amount of compounds. This is not the case for the sesquiterpenoids. UAE allow the obtaining of very high concentration (18% on the dried extract) that, despite the low yield in term of weight, suggest a valuable
approach for obtaining specifically highly concentrated sesquiterpene fraction.
Sesquiterpenoids possess several biological activities and despite being in many cases able to induce allergy by topic contanct are on the other hand highly studied for different medicinal properties as anti-inflammatory and anticancer agents [19].
Antioxidant properties
Several antioxidant assays were employed to evaluate the antioxidant activity of the different extracts of A. cotula from different perspectives. Literature data suggest that applied extraction technique as well as extraction conditions during the process may cause different biological ability of the extracts [20]. Presently, radical scavenging, reducing power, and metal chelating assays were used. Data relating to radical scavenging and reducing power estimations of A. cotula extracts were expressed as equivalents of Trolox, a hydrophilic analogue of vitamin E. The phosphomolybdenum assay, based on the reduction of Mo (VI) to Mo (V), has been used to estimate the total antioxidant capacity of the extracts. From Table 5, it was observed that data generated by this assay did not clearly express difference in antioxidant capacity between the extracts obtained by the different extraction techniques. The total antioxidant potential of the aerial parts of A. cretica and A. fumariifolia, using phosphomolybdenum
method, has been reported previously [21]. There was more contrast in the ability of the different extracts to scavenge DPPH and ABTS radicals. A. cotula extract produced by ASE showed highest DPPH (103.44 mg TE/g extract) and ABTS (155.70 mg TE/g extract) scavenging potential. The extract obtained from maceration was the least active radical scavenger. These observations correlate with phenolic content determinations (Figure 5A). Indeed, high correlation has been reported between the phenolic content of plant extracts and their radical scavenging capacity [22]. The reducing power of A. cotula extracts obtained by the different extraction techniques was summarized in Table 5. The CUPRAC and FRAP methods, measuring copper (II) and iron (III) reduction, respectively, were used to evaluated the reducing power. Similar to the radical scavenging assays, the extract obtained by ASE (435.32 and 317.89 mg TE/g extract, for CUPRAC and FRAP assays, respectively) showed the highest activity and the extract obtained by maceration (307.66 and 196.86 mg TE/g extract, for CUPRAC and FRAP assays, respectively) showed the least activity, for both CUPRAC and FRAP assays. Compared to the conventional bench top maceration, several characteristics of ASE have contributed to its increased efficiency for the extraction of phenolic compounds and sesquiterpenoids from plant materials. The elevated solvent temperature increases solubilizing capabilities of the solvent, decreases viscosity ensuring solvent penetration in the plant matrix, increases diffusion rates thereby increasing mass transfer, while the high pressure maintains the solvent in the liquid state, this warrants saturation of the solvent and maximize solvent contact [23]. Besides, A. deserti, another species of the Anthemis genus, has been reported to possess significant antioxidant properties as a radical scavenger and reducing agent [24]. Data obtained from the chelating activity assay were given in Table 5. The chelating activity of A. cotula extracts obtained from the different extraction methods was as follows UAE > maceration > ASE > SE > MAE. It can be suggested that the low operating temperature employed during UAE helped maintaining the quality of heat labile compounds probably mainly
sesquiterpenoids. Additionally, as far as our literature survey could ascertain, this study was the first one to appraise the chelating capacity of the aerial parts of A. cotula. Data presented in this study warrant further investigation geared towards elucidating the chelating mechanism of anthecotuloide, a sesquiterpenoid abundant in the studied extracts.
Enzyme inhibition properties
A comparison of the inhibitory activity of the aerial parts of A. cotula extracted by ASE, MAE, maceration, SE, and UAE on strategic enzymes targeted for the management of Alzheimer’s disease, skin hyperpigmentation complications, and diabetes, has not been reported elsewhere. The extracts of A. cotula prepared by different extraction techniques were screened for their inhibitory action on acetyl cholinesterase (AChE), butyryl cholinesterase (BChE), tyrosinase, α-amylase, and α-glucosidase. Generally, it was noted that the different extraction techniques have no effect on the enzyme inhibition properties of A. cotula. Interestingly, A. cotula expressed inhibitory action against all the tested enzymes. A. cotula inhibited both AChE and BChE, with values ranging from 4.25 to 3.62 mg GALAE/g and 5.65 to 5.53 mg GALAE/g, for AChE and BChE, respectively. These enzymes, responsible for the termination of synaptic transmission at synaptic cleft, have been associated to Alzheimer’s disease, a chronic age-related condition characterized by memory loss, cognitive inability, and incapacity [25]. It is also noteworthy mentioning that the extracts were more active inhibitors of BChE as compared to AChE (Table 6). The increased activity of BChE during the late stage of Alzheimer’s disease has prompted unprecedented focus on its modulation in late Alzheimer’s disease management. Besides, unlike AChE, BChE is not expressed in the peripheral and parasympathic nervous systems, BChE inhibitors should thus be exempted of side-effects related to AChE inhibitors [26]. Tyrosinase is a copper-containing enzyme responsible for the biosynthesis of melanin pigment. In line with this fact, tyrosinase inhibition can be viewed as a
non-invasive alternative to manage skin hyperpigmentation conditions such as melasma, freckles, and ephelide [27]. Interestingly, the extracts of A. cotula were active inhibitors of tyrosinase (Table 6). Extensive amount of scientific evidence highlight the role of digestive enzymes, namely α-amylase and α-glucosidase, in the management of hyperglycemia, the hallmark of diabetes. Inhibition of these digestive enzymes has been related to prolonged carbohydrate digestion and thus blunt postprandial glucose rise [28]. Nonetheless, studies have reported that low α-amylase versus strong α-glucosidase inhibition was the best treatment modality for the management of diabetes. This can be explained by the fact that large amount of undigested food caused by intensive α-amylase inhibition was related to gastrointestinal discomforts [29]. Here, A. cotula extracts exhibited lower inhibition against α-amylase (0.62-0.53 mmol ACAE/g extract) and were more active against α-glucosidase (1.64-1.61 mmol ACAE/g extract).
Multivariate analysis
In this work multivariate analysis namely PLS-DA, a supervised statistical tools, and A Clustered Image Map (default values to Euclidian distance and ward linkage) were performed in order to group the different extraction methods according to similarities in their biological activities. Firstly, as show in Figure 5C&D, three main groups were obtained. The first group brings together maceration and UAE methods, the second group included MAE and SE methods while the last group was characterized by only ASE method. Another relevant information reveal by Figure 5B showed that eight of thirteen biological activities were found to have the highest discrimination potential. These are TPC, PPBD, DPPH, ABTS, FRAP, CUPRAC, metal chelating and AChE. Additionally, overall maceration and UAE methods were found to be the most effective method and have the highest AChE, PPBD, metal chelating, Tyrosinase, alpha glucosidase and alpha amylase activities (5A&C), thus suggesting that both the classes of
compounds, phenolics and sesquiterpene could be active in the tests. ASE showed a better ABTS, DPPH, FRAP, CUPRAC abilities (Figure 5A&C) and in this extract the amount of polyphenols and sesquiterpene is almost the same (Table 4). Furthermore, the classification and prediction performance of PLS-DA model was evaluated by estimating BER (classification error rate), using both “maximum and centroids” as prediction distance and 5-fold CV repeated 10 times [30]. As witnessed, a complete and clear separation between studied methods was achieved; notably the performance displayed suggests that “ncomp = 4” with overall error rate and both maximum and centroids distance is sufficient to achieve good performance (approximately 0.1 error rate).
Conclusion
This study has shown the different composition of extracts obtained from A. cotula using different innovative extraction techniques. The choice of extraction technique has great influence on the composition and in part on the in vitro test used to assay bioactivity of A. cotula extracts. According to obtained results, sesquiterpenoids and phenolic compounds were better extracted by UAE although with a lower yield on the basis of extracted material. ASE and SE offer higher yield but lower concentration of sesquiterpene compared by UAE. Thus, UAE may be suggested to be used on industrial level to obtain and extract sesquiterpenoids. ASE and SE can be useful for obtaining extracts that contain similar amount of phenolics and sesquiterpenoids. Obtained extracts showed to be rich in phenolic and sesquiterpenes, thereby, A. cotula could be considered as a promising source for natural antioxidant agents. This study appraised the possible therapeutic application of A. cotula for the management of chronic complications such as Alzheimer’s disease, diabetes, and skin hyperpigmentation disorders. Investigating the interaction of anthecotuloide with acetyl cholinesterase, butyryl cholinesterase, tyrosinase, α-amylase, and α-glucosidase using in silico molecular docking
could open new avenues for the development of novel therapeutic agents. Additionally, ethanol, generally recognized as safe, has been used as solvent in the present study, thereby facilitating the design of nutraceuticals and/or pharmaceuticals from A. cotula.
References
[1] S.K. Bardaweel, K.A. Tawaha, M.M. Hudaib, Antioxidant, antimicrobial and antiproliferative activities of Anthemis palestina essential oil, BMC Complement. Altern. Med. 14(1) (2014) 297. [2] A.E. Al-Snafi, Medical importance of Anthemis nobilis (Chamaemelum nobile)-A review, Asian J. Pharm. Sci. Technol. 6(2) (2016) 89-95.
[3] E. Ugurlu, O. Secmen, Medicinal plants popularly used in the villages of Yunt Mountain (Manisa-Turkey), Fitoterapia 79(2) (2008) 126-131.
[4] S. Baltaci, H.E. Kolatan, O. Yilmaz, B. Kivcak, Anti-inflammatory activity of Anthemis aciphylla var. aciphylla Boiss, Turkish J. Biol. 35(6) (2011) 757-762.
[5] R. Shawahna, N.A. Jaradat, Ethnopharmacological survey of medicinal plants used by patients with psoriasis in the West Bank of Palestine, BMC Complement. Altern. Med. 17(1) (2017) 4.
[6] H.S. Yusufoglu, N. Tabanca, U.R. Bernier, A.Y. Li, M.A. Salkini, S.I. Alqasoumi, B. Demirci, Mosquito and tick repellency of two Anthemis essential oils from Saudi Arabia, Saudi Pharm. J. 26(6) (2018) 860-864.
[7] M.V. Quarenghi, M.L. Tereschuk, M.D. Baigori, L.R. Abdala, Antimicrobial activity of flowers from Anthemis cotula, Fitoterapia 71(6) (2000) 710-712.
[8] M. Salimi, N. Gheisarzadeh, K. Azadmnaesh, N. Rastkari, M. Salimi, Antiproliferative effects of different fractions obtained from Anthemis nobilis leaves on human oral cancer cell, Eur. J. Cancer 50 (2014) 40.
[9] J. van Klink, H. Becker, S. Andersson, W. Boland, Biosynthesis of anthecotuloide, an irregular sesquiterpene lactone from Anthemis cotula L. (Asteraceae) via a non-farnesyl diphosphate route, Org. Biomol. Chem. 1(9) (2003) 1503-1508.
[10] J.D. Staneva, M.N. Todorova, L.N. Evstatieva, New linear sesquiterpene lactones from Anthemis cotula L, Biochem. Syst. Ecol. 1(33) (2005) 97-102.
[11] S. Uysal, G. Zengin, M. Locatelli, M.B. Bahadori, A. Mocan, G. Bellagamba, E. De Luca, A. Mollica, A. Aktumsek, Cytotoxic and enzyme inhibitory potential of two Potentilla species (P. speciosa L. and P. reptans Willd.) and their chemical composition, Front. Pharmacol. 8 (2017) 290.
[12] S. Sut, S. Dall'Acqua, V. Baldan, S.L. Ngahang Kamte, F. Ranjbarian, P.C. Biapa Nya, S. Vittori, G. Benelli, F. Maggi, L. Cappellacci, A. Hofer, R. Petrelli, Identification of tagitinin C from Tithonia diversifolia as antitrypanosomal compound using bioactivity-guided fractionation, Fitoterapia 124 (2018) 145-151.
[13] M.N. Clifford, S. Knight, N. Kuhnert, Discriminating between the six isomers of dicaffeoylquinic acid by LC-MS n, J. Agric. Food Chem. 53(10) (2005) 3821-3832.
[14] N. Fabre, I. Rustan, E. de Hoffmann, J. Quetin-Leclercq, Determination of flavone, flavonol, and flavanone aglycones by negative ion liquid chromatography electrospray ion trap mass spectrometry, J. Am. Soc. Mass Spectrom. 12(6) (2001) 707-715.
[15] F. Maggi, C. Giuliani, G. Fico, M. Ricciutelli, M. Bramucci, L. Quassinti, D. Petrelli, L.A. Vitali, K. Cianfaglione, B. Tirillini, Secondary metabolites, secretory structures and biological activity of water celery (Apium nodiflorum (L.) Lag.) growing in central Italy, Plant Biosyst. 153(2) (2019) 325-335. [16] S. Sut, S. Dall’Acqua, S. Uysal, G. Zengin, A. Aktumsek, C. Picot-Allain, F. Mahomoodally, LC-MS, NMR fingerprint of Potentilla argentea and Potentilla recta extracts and their in vitro biopharmaceutical assessment, Ind. Crops Prod. 131 (2019) 125-133.
[17] S. Saha, A.K. Singh, A.K. Keshari, V. Raj, A. Rai, S. Maity, Chapter 2 - Modern extraction techniques for drugs and medicinal agents, in: A.M. Grumezescu, A.M. Holban (Eds.), Ingredients Extraction by Physicochemical Methods in Food, Academic Press2018, pp. 65-106.
[18] J. Wang, Y.-M. Zhao, C.-Y. Guo, S.-M. Zhang, C.-L. Liu, D.-S. Zhang, X.-M. Bai, Ultrasound-assisted extraction of total flavonoids from Inula helenium, Pharmacogn. Mag. 8(30) (2012) 166-170. [19] C. Formisano, C. Sanna, M. Ballero, G. Chianese, C. Sirignano, D. Rigano, E. Millan, E. Munoz, O. Taglialatela-Scafati, Anti-inflammatory sesquiterpene lactones from Onopordum illyricum L. (Asteraceae), an Italian medicinal plant, Fitoterapia 116 (2017) 61-65.
[20] A. Cvetanović, J. Švarc-Gajić, Z. Zeković, U. Gašić, Ž. Tešić, G. Zengin, P. Mašković, M.F. Mahomoodally, S. Đurović, Subcritical water extraction as a cutting edge technology for the extraction of bioactive compounds from chamomile: Influence of pressure on chemical composition and bioactivity of extracts, Food Chem. 266 (2018) 389-396.
[21] G. Ozkan, S. Kamiloglu, T. Ozdal, D. Boyacioglu, E. Capanoglu, Potential use of Turkish medicinal plants in the treatment of various diseases, Molecules 21(3) (2016) 257-289.
[22] T. Wang, R. Jónsdóttir, G. Ólafsdóttir, Total phenolic compounds, radical scavenging and metal chelation of extracts from Icelandic seaweeds, Food Chem. 116(1) (2009) 240-248.
[23] J.J. Kellogg, E.D. Wallace, T.N. Graf, N.H. Oberlies, N.B. Cech, Conventional and accelerated-solvent extractions of green tea (Camellia sinensis) for metabolomics-based chemometrics, J. Pharm. Biomed. Anal. 145 (2017) 604-610.
[24] A.A. Shahat, A.Y. Ibrahim, M.S. Elsaid, Polyphenolic content and antioxidant activity of some wild Saudi Arabian asteraceae plants, Asian Pac. J. Trop. Med. 7(7) (2014) 545-551.
[25] G. Zengin, I. Senkardes, A. Mollica, C.M.N. Picot-Allain, G. Bulut, A. Dogan, M.F. Mahomoodally, New insights into the in vitro biological effects, in silico docking and chemical profile of clary sage – Salvia sclarea L, Comput. Biol. Chem. 75 (2018) 111-119.
[26] D. Knez, N. Coquelle, A. Pišlar, S. Žakelj, M. Jukič, M. Sova, J. Mravljak, F. Nachon, X. Brazzolotto, J. Kos, J.-P. Colletier, S. Gobec, Multi-target-directed ligands for treating Alzheimer's disease: Butyrylcholinesterase inhibitors displaying antioxidant and neuroprotective activities, Eur. J. Med. Chem. 156 (2018) 598-617.
[27] G. Zengin, M.F. Mahomoodally, C.M.N. Picot-Allain, Y.S. Cakmak, S. Uysal, A. Aktumsek, In vitro tyrosinase inhibitory and antioxidant potential of Consolida orientalis, Onosma isauricum and Spartium junceum from Turkey, S. Afr. J. Bot. 120(2019), 119-123.
[28] M.C.N. Picot, M.F. Mahomoodally, Effects of Aphloia theiformis on key enzymes related to diabetes mellitus, Pharm. Biol. 55(1) (2017) 864-872.
[29] S. Uysal, A. Aktumsek, C.M. Picot, A. Sahan, A. Mollica, G. Zengin, M.F. Mahomoodally, A comparative in vitro and in silico study of the biological potential and chemical fingerprints of Dorcycinum pentapyllum subsp. haussknechtii using three extraction procedures, New J. Chem. 41(22) (2017) 13952-13960.
[30] K.-A. Le Cao, F. Rohart, I. Gonzalez, M.K.-A. Le Cao, Package ‘mixOmics’, (2018).
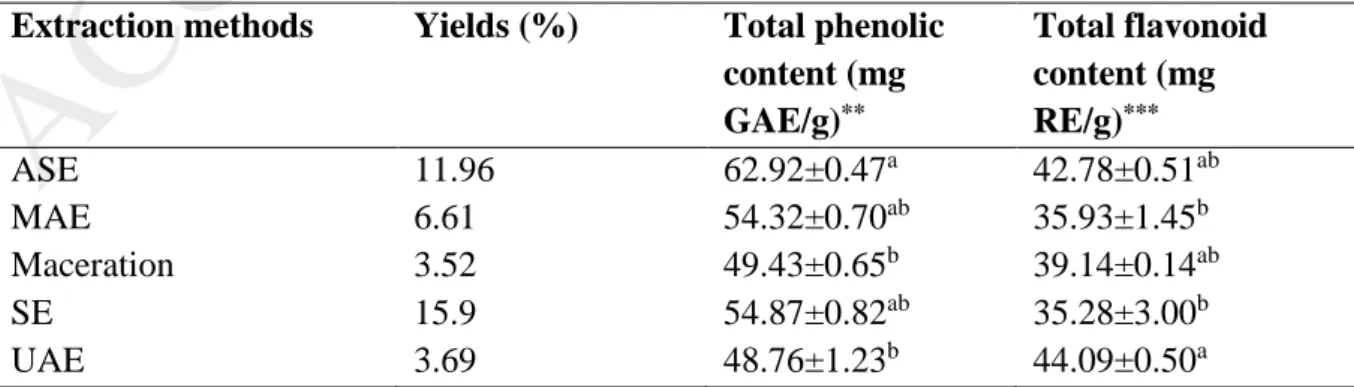
Table 1. Phenolic and flavonoid contents of the studied extracts*.
Extraction methods Yields (%) Total phenolic
content (mg GAE/g)** Total flavonoid content (mg RE/g)*** ASE 11.96 62.92±0.47a 42.78±0.51ab MAE 6.61 54.32±0.70ab 35.93±1.45b Maceration 3.52 49.43±0.65b 39.14±0.14ab SE 15.9 54.87±0.82ab 35.28±3.00b UAE 3.69 48.76±1.23b 44.09±0.50a
Values expressed are means S.D. of three parallel measurements. ASE: Accelerated solvent extraction; MAE: Microwave assisted extraction; SE: Soxhlet extraction; UAE: Ultrasound assisted extraction. GAE: Gallic acid
equivalent; RE: Rutin equivalent.**Statistical evaluation was performed by Kruskal-Wallis test. ***Statistical
evaluation was performed by ANOVA test. Different letters indicate difference in the tested extracts (p< 0.05)
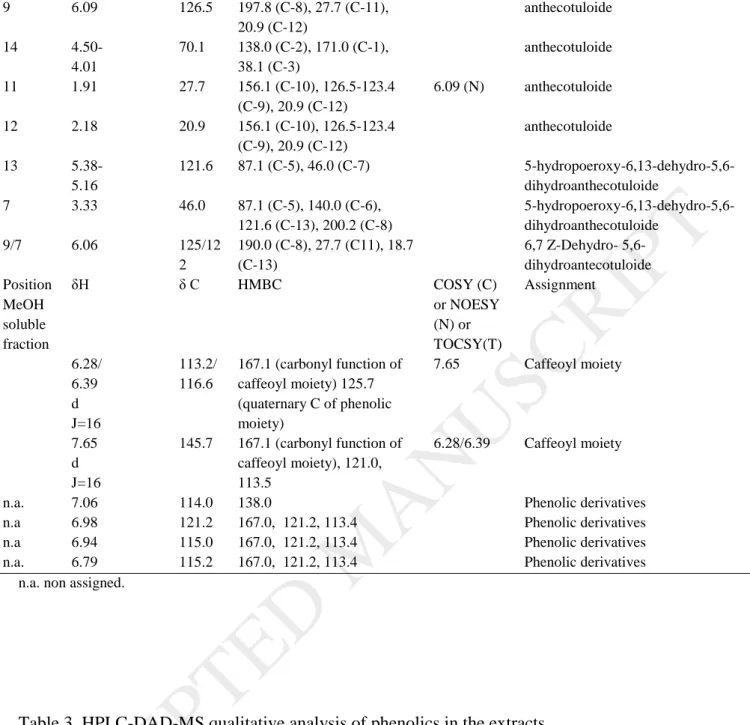
Table 2. NMR assignments of the main constituents present in the extracts of Anthemis cotula. Assignments were obtained by reading of H, HSCQ-DEPT, COSY, TOCSY, NOESY experiments as well as by comparison with the literature.
Position CDCl3 soluble fraction δH δ C HMBC COSY (C) or NOESY (N) or TOCSY(T) Assignment
1 - 171 - - C-1 lactonic ring of all the
derivatives 3 3.03 38.1 191.5 (C-5) C-3 5-oxo-6,13-dehydro-5,6-dihydroanthecotuloide 3 3.05 38.1 138.0 (C-2), 122.2 (C-15) anthecotuloide 7 3.10 54.8 197.8 (C-8), 133.8 (C-6), 123.0 (C-5), 156.5 (C-9) 6.09 (H-9) anthecotuloide
ACCEPTED MANUSCRIPT
9 6.09 126.5 197.8 (C-8), 27.7 (C-11), 20.9 (C-12) anthecotuloide 14 4.50-4.01 70.1 138.0 (C-2), 171.0 (C-1), 38.1 (C-3) anthecotuloide 11 1.91 27.7 156.1 (C-10), 126.5-123.4 (C-9), 20.9 (C-12) 6.09 (N) anthecotuloide 12 2.18 20.9 156.1 (C-10), 126.5-123.4 (C-9), 20.9 (C-12) anthecotuloide 13 5.38-5.16 121.6 87.1 (C-5), 46.0 (C-7) 5-hydropoeroxy-6,13-dehydro-5,6-dihydroanthecotuloide 7 3.33 46.0 87.1 (C-5), 140.0 (C-6), 121.6 (C-13), 200.2 (C-8) 5-hydropoeroxy-6,13-dehydro-5,6-dihydroanthecotuloide 9/7 6.06 125/12 2 190.0 (C-8), 27.7 (C11), 18.7 (C-13) 6,7 Z-Dehydro- 5,6-dihydroantecotuloide Position MeOH soluble fraction δH δ C HMBC COSY (C) or NOESY (N) or TOCSY(T) Assignment 6.28/ 6.39 d J=16 113.2/ 116.6 167.1 (carbonyl function of caffeoyl moiety) 125.7 (quaternary C of phenolic moiety) 7.65 Caffeoyl moiety 7.65 d J=16 145.7 167.1 (carbonyl function of caffeoyl moiety), 121.0, 113.5 6.28/6.39 Caffeoyl moiety
n.a. 7.06 114.0 138.0 Phenolic derivatives
n.a 6.98 121.2 167.0, 121.2, 113.4 Phenolic derivatives
n.a 6.94 115.0 167.0, 121.2, 113.4 Phenolic derivatives
n.a. 6.79 115.2 167.0, 121.2, 113.4 Phenolic derivatives
n.a. non assigned.
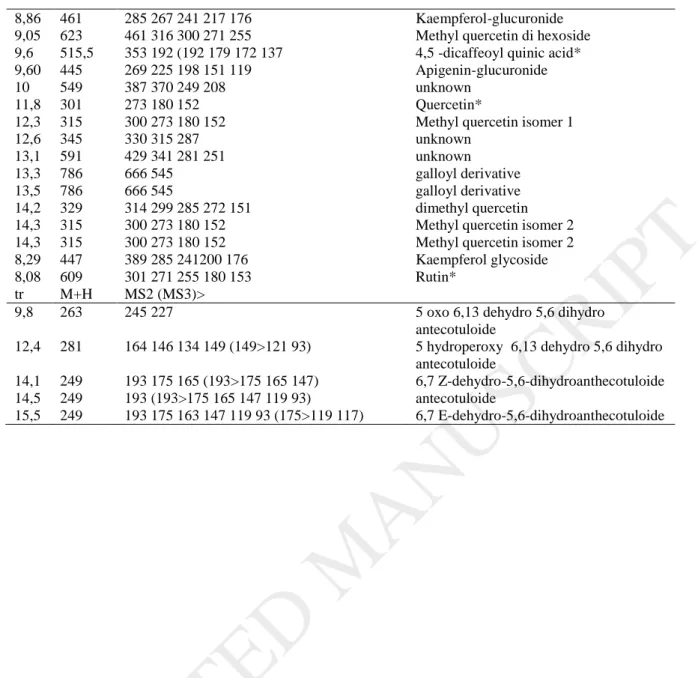
Table 3. HPLC-DAD-MS qualitative analysis of phenolics in the extracts
rt M-H fragments Compound
1,7 377,8 341 (180 162 145) Caffeic ester with sugar
5,2 469,6 421 407 302 180 unknown
5,25 353 191 (174 92 88) 5 caffeoyl quinic acid*
5,40 353 192 1749 174 3 caffeoyl quinic acid*
6,20 515,5 353 (192 179 172 137) 3,5 dicaffeoyl quinic acid*
6,15 305,4 225 (208) (198 182 166 149 137) Tetrahydrofarnesyl sulfate 6,7 387 369 343 225 208 164 tetrahydrofarnesyl glucuronide 7,3 479 317 271 227 200 169 141 (243 200) Myricetin hexoside 8,0 463 343 301 255 180 152 Quercetin-C-glycoside 8,05 463 301 273 255 180 152 Quercetin-hexoside isomer 1 8,17 593 301256 243 217 200 199 152 Kaempferol-3-O-rutinoside* 8,3 463 301 273 255 180 152 Quercetin-hexoside isomer 2 8,5 463 285 Flavanol glucuronide
8,7 515,5 353 192 (192 179 172 137 1,5 dicaffeoyl quinic acid*
8,76 493 331 316 271 243 Methoxy quercetin hexoside
8,86 461 285 267 241 217 176 Kaempferol-glucuronide
9,05 623 461 316 300 271 255 Methyl quercetin di hexoside
9,6 515,5 353 192 (192 179 172 137 4,5 -dicaffeoyl quinic acid*
9,60 445 269 225 198 151 119 Apigenin-glucuronide
10 549 387 370 249 208 unknown
11,8 301 273 180 152 Quercetin*
12,3 315 300 273 180 152 Methyl quercetin isomer 1
12,6 345 330 315 287 unknown
13,1 591 429 341 281 251 unknown
13,3 786 666 545 galloyl derivative
13,5 786 666 545 galloyl derivative
14,2 329 314 299 285 272 151 dimethyl quercetin
14,3 315 300 273 180 152 Methyl quercetin isomer 2
14,3 315 300 273 180 152 Methyl quercetin isomer 2
8,29 447 389 285 241200 176 Kaempferol glycoside
8,08 609 301 271 255 180 153 Rutin*
tr M+H MS2 (MS3)>
9,8 263 245 227 5 oxo 6,13 dehydro 5,6 dihydro
antecotuloide
12,4 281 164 146 134 149 (149>121 93) 5 hydroperoxy 6,13 dehydro 5,6 dihydro
antecotuloide
14,1 249 193 175 165 (193>175 165 147) 6,7 Z-dehydro-5,6-dihydroanthecotuloide
14,5 249 193 (193>175 165 147 119 93) antecotuloide
15,5 249 193 175 163 147 119 93 (175>119 117) 6,7 E-dehydro-5,6-dihydroanthecotuloide
Table 4. Amount of selected phytoconstituents in the obtained extracts. Quantification was obtained by HPLC-DAD, data are expressed as % (w/w) of dried extract.
Compounds ASE MAE Maceration SE UAE
Metil Quercetin isomer 1 0.41±0.02 0.34±0.02 0.18±0.01 0.32±0.02 1.21±0.02
4,5 DCQ 1.17±0.05 1.24±0.03 0.40±0.02 1.08±0.02 1.04±0.02
Metil Quercetin isomer 2 0.09±0.01 0.19±0.02 0.05±0.01 0.07±0.01 0.42±0.02
Metil Quercetin isomer 3 0.04±0.01 0.05±0.01 0.03±0.01 0.04±0.01 0.16±0.01
Apigenin glucuronide 1.01±0.02 0.77±0.02 0.15±0.02 0.57±0.01 0.77±0.01 antecotuloide 1.12±0.06 2.90±0.022 0.76±0.03 0.71±0.01 8.29±0.04 6,7 Z-dehydro-5,6-dihydroanthecotuloide 0.81±0.02 1.54±0.02 0.87±0.02 0.73±0.02 5.09±0.06 6,7 E-dehydro-5,6-dihydroanthecotuloide 0.84±0.02 1.52±0.03 0.69±0.02 0.59±0.02 4.87±0.02
Sum of considered phenolics 2.71 2.59 0.82 2.09 3.60
Sum of considered sesquiterpene 2.76 5.99 2.32 2.03 18.25
Quantitative measurement of target compounds on the different obtained dried extracts. Data are expressed as (w/w) of compound on dried extract. Data are average value of triplicate measurements.
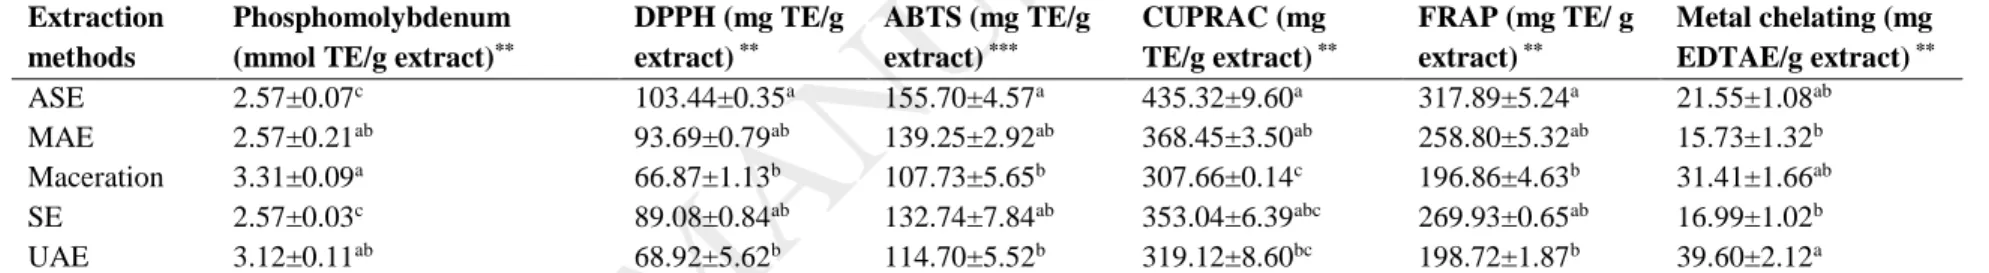
Table 5. Antioxidant properties of the studied extracts*. Extraction
methods
Phosphomolybdenum
(mmol TE/g extract)**
DPPH (mg TE/g extract) ** ABTS (mg TE/g extract) *** CUPRAC (mg TE/g extract) ** FRAP (mg TE/ g extract) ** Metal chelating (mg EDTAE/g extract) ** ASE 2.57±0.07c 103.44±0.35a 155.70±4.57a 435.32±9.60a 317.89±5.24a 21.55±1.08ab MAE 2.57±0.21ab 93.69±0.79ab 139.25±2.92ab 368.45±3.50ab 258.80±5.32ab 15.73±1.32b Maceration 3.31±0.09a 66.87±1.13b 107.73±5.65b 307.66±0.14c 196.86±4.63b 31.41±1.66ab SE 2.57±0.03c 89.08±0.84ab 132.74±7.84ab 353.04±6.39abc 269.93±0.65ab 16.99±1.02b UAE 3.12±0.11ab 68.92±5.62b 114.70±5.52b 319.12±8.60bc 198.72±1.87b 39.60±2.12a
*Values expressed are means S.D. of three parallel measurements. ASE: Accelerated solvent extraction; MAE: Microwave assisted extraction; SE: Soxhlet
extraction; UAE: Ultrasound assisted extraction. TE: Trolox equivalent; EDTAE: EDTA equivalent.**Statistical evaluation was performed by Kruskal-Wallis test. ***Statistical evaluation was performed by ANOVA test. Different letters indicate difference in the tested extracts (p< 0.05)
Table 6. Enzyme inhibitory properties of the studied extracts*. Extraction methods AChE inhibition (mg GALAE/g) BChE inhibition (mg GALAE/g) Tyrosinase inhibition (mg KAE/g) α-Amylase inhibition (mmol ACAE/g) α-Glucosidase inhibition (mmol ACAE/g) ASE 3.62±0.12b 5.53±0.07a 174.33±1.19ab 0.57±0.02ab 1.62±0.01ab MAE 3.78±0.01ab 5.59±0.01a 172.44±2.04b 0.57±0.03ab 1.61±0.01b Maceration 4.25±0.09a 5.61±0.02a 175.35±1.66ab 0.59±0.05ab 1.64±0.01a SE 3.70±0.17b 5.65±0.07a 174.81±0.60ab 0.53±0.02b 1.61±0.02b UAE 4.02±0.06ab 5.60±0.03a 176.54±0.02a 0.62±0.01a 1.62±0.01ab
*Values expressed are means S.D. of three parallel measurements. ASE: Accelerated solvent extraction; MAE: Microwave assisted extraction; SE: Soxhlet
extraction; UAE: Ultrasound assisted extraction. GALAE: Galatamine equivalent; KAE: Kojic acid equivalent; ACAE: Acarbose equivalent. Different letters indicate difference in the tested extracts (by ANOVA test, p< 0.05).
Figure 2. HPLC-MS chromatogram in positive ion mode ions related to the four main detected sesquiterpenoids are indicated
Figure 3. Proposed fragmentation schemes for anthecotuloide, 6,7 Z-dehydroanthecotuloide and 6,7 E-dehydroanthecotuloide. Exemplificative MS and MS2 spectrum of anthecotuloide is also reported.
Figure 4: HPLC-DAD chromatograms referred to the 254 nm wavelength of the different Anthemis cotula extracts, namely the Blue is Ultrasound (UAE), the red is Assisted Solvent Extraction (ASE), the green referred to microwave (MAE), the purple to maceration, and the brown to Soxhlet (SE).
m in 5 10 15 20 25 30 35 m A U 0 20 40 60 80 100 120 140
*D A D 1 A , S ig=254,4 R ef=off (P O LIF E N O LIS T E F A N O 2401\P O LIF E N O LIS T E F A N O 2401 2019-01-24 17-30-51\045-0501.D ) *D A D 1 A , S ig=254,4 R ef=off (P O LIF E N O LIS T E F A N O 2401\P O LIF E N O LIS T E F A N O 2401 2019-01-24 17-30-51\041-0101.D )
*D A D 1 A , S ig=254,4 R ef=off (P O LIF E N O LIS T E F A N O 2401\P O LIF E N O LIS T E F A N O 2401 2019-01-24 17-30-51\042-0201.D )
*D A D 1 A , S ig=254,4 R ef=off (P O LIF E N O LIS T E F A N O 2401\P O LIF E N O LIS T E F A N O 2401 2019-01-24 17-30-51\043-0301.D )
*D A D 1 A , S ig=254,4 R ef=off (P O LIF E N O LIS T E F A N O 2401\P O LIF E N O LIS T E F A N O 2401 2019-01-24 17-30-51\044-0401.D )
Figure 5. Supervised multivariate statistical analysis with PLS-DA; A: Correlation circle plot on the first two component displaying the relationship between the studied biological activities. B: Variable importance in the projection showing the best discriminating variables (bioactive compounds and biological activities) in the PLS-DA model (variable with VIP was highest than 1, was considered to be important), C&D: projection of extraction techniques into the subspace spanned by the first two components and Clustered Image Map based (Euclidean distance, Ward linkage) based on the biological activities; E: prediction model performance per component for Maximum and Centroids distance using 5-fold CV repeated 10 times.
ACCEPTED MANUSCRIPT
View publication stats View publication stats