Tarım Bilimleri Dergisi
Tar. Bil. Der.Dergi web sayfası: www.agri.ankara.edu.tr/dergi
Journal of Agricultural Sciences
Journal homepage:www.agri.ankara.edu.tr/journal
TARIM BİLİMLERİ DERGİSİ
—
JOURNAL OF AGRICUL
TURAL SCIENCES
22 (2016) 237-248
Determination of Drying Kinetics of Tunceli Garlic with Microwave
Drying Technique
Hakan YOĞURTÇUa
aTunceli University, Faculty of Engineering, Department of Chemical Engineering, 62000, Tunceli, TURKEY ARTICLE INFO
Research Article
Corresponding Author: Hakan YOĞURTÇU, E-mail: [email protected], Tel: + 90 (428) 213 17 94 Received: 30 September 2014, Received in Revised Form: 23 January 2015, Accepted: 14 February 2015
ABSTRACT
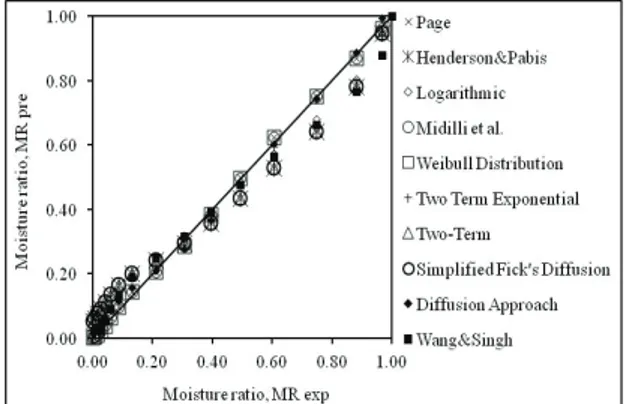
In this study, drying kinetics of 4 mm-thick slices of Tunceli garlic (Allium tuncelianum) was investigated by using microwave technique at an interval of 90-600 W microwave output power. Ten mathematical models were used to
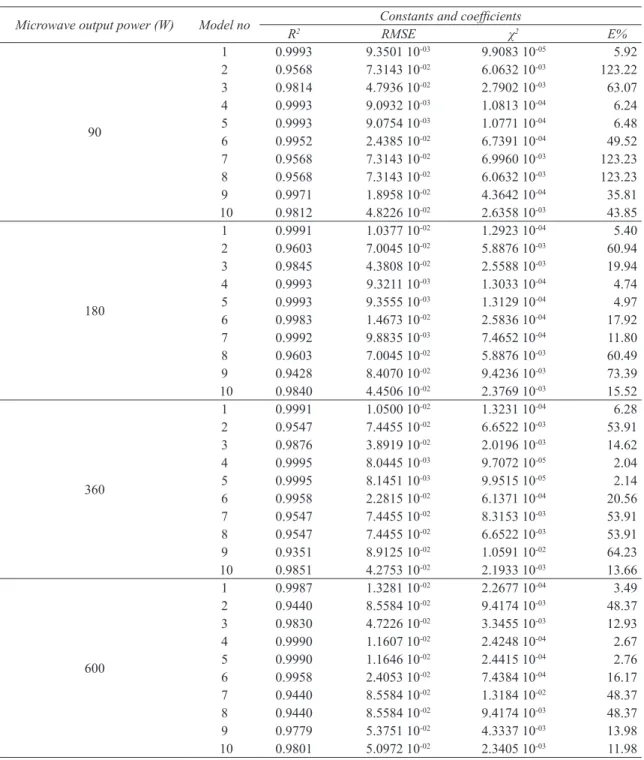
represent the experimental data in this study. The determination of coefficient (R2), root mean square error (RMSE),
chi-square (χ2) and percentage error (E%) values that show compatibility to these models were determined. The
determination of coefficient (R2) values were found to vary at an interval of 0.9440-0.9993. The Midilli et al model
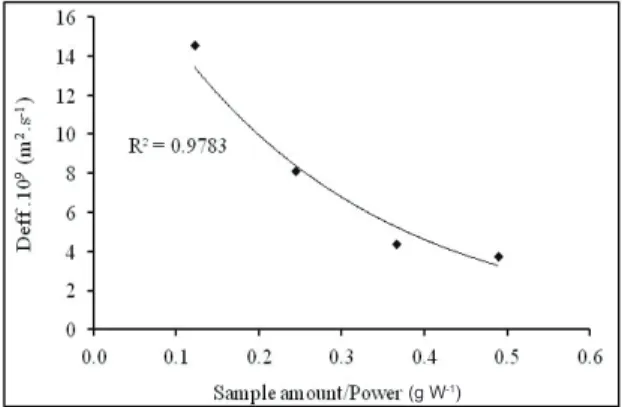
was determined to be the best model that represents the experimental data. It was seen that drying rate increases with the increase in microwave output power (P) and decreases with the increase in sample mass (m). Effective diffusion
coefficients (Deff) and drying rate constants (k) were determined for different sample masses at microwave output power
of 90 W. Activation energies for both effective diffusion coefficients and drying rate constants were determined by using an Arrhenius type exponential equation. Activation energies from effective diffusion coefficients and drying rate constants were found as 3.85 W g-1 and 3.99 W g-1 respectively.
Keywords: Tunceli garlic; Thin-layer drying; Microwave drying
Tunceli Sarımsağının Mikrodalga Kurutma Tekniği ile Kuruma
Kinetiğinin Belirlenmesi
ESER BİLGİSİ
Araştırma Makalesi
Sorumlu Yazar: Hakan YOĞURTÇU, E-posta: [email protected], Tel: + 90 (428) 213 17 94 Geliş Tarihi: 30 Eylül 2014, Düzeltmelerin Gelişi: 23 Ocak 2015, Kabul: 14 Şubat 2015
ÖZET
Bu çalışmada, mikrodalga tekniği kullanılarak 90-600 W mikrodalga çıkış gücü aralığında 4 mm kalınlıktaki Tunceli sarımsağı (Allium tuncelianum) dilimlerinin kuruma kinetiği incelenmiştir. Deneysel verileri temsil etmek için on adet
matematiksel model kullanılmıştır. Bu modellere uygunluğu gösteren determinasyon katsayısı (R2), ortalama hata kareleri
karekökü (root mean square error, RMSE), ki- kare (χ2) ve yüzde hata (% E) değerleri belirlenmiştir. Determinasyon
Determination of Drying Kinetics of Tunceli Garlic with Microwave Drying Technique, Yoğurtçu
238
Ta r ı m B i l i m l e r i D e r g i s i – J o u r n a l o f A g r i c u l t u r a l S c i e n c e s 22 (2016) 237-2481. Introduction
Allium tuncelianum, whose original name is Allium macrochaetum Boiss and Haussk subsp. tuncelianum
Kollmann, is an endemic plant that grows in Tunceli (Turkey) and its environs, especially in the counties of Ovacık, Pülümür, Hozat and Pertek. For this reason, it is called “Tunceli garlic” or “Ovacık garlic” in the region (Ipek et al 2008). The most prominent features of Tunceli garlic that distinguish it from other garlic species are that it is single-cloved and yields seeds by flowering. It is an economically valuable plant and people in the region depend on it for their livelihoods. Various projects are carried out by the Ministry of Food, Agriculture and Livestock in order to grow and market Tunceli garlic. It loses its aroma and taste in a short time if it is not stored under suitable conditions.
Drying can be described in simple terms as removing water from a wet/moist material. However, drying is a complex process of heat and mass transfer between the moist material and its environment (Midilli et al 2002). Drying can be said to be one of the oldest methods of increasing the durability of food items and consuming them later. Drying is the best method in terms of preserving their vitamin potential, appearance, taste, advantage in packaging due to a reduction in size and the improvement in storing and transportation of food products (Doymaz 2013).
Such drying methods as contact drying, convective drying, radiative drying, freeze drying and osmotic drying are used to dry vegetables, fruits and cereal products. (Yagcioglu et al 1999). Microwave drying has an important place
among radiative drying methods. Microwaves are generally used as heat sources due to their fast heating capabilities. Microwave drying has gained popularity as an alternative drying method in the food industry in recent years (Cui et al 2004). Due to the fact that the inner temperature of the food that is dried with microwave is greater than its surface temperature, a more dynamic moisture transfer compared to convective drying is achieved (Torringa et al 2001; Wang & Sheng 2006). Compared to the traditional and conventional hot air drying methods, microwave drying method has such advantages as homogenous energy distribution, high thermal conductivity, conservation of energy, a smaller area of drying, a shorter drying time and preservation of food items from enzymatic decay (Decareau 1992; Rhen & Chen 1998; Schiffmann 2001).
Microwave drying of various agricultural products was investigated by various researchers; for example, potato (Bouraout et al 1994), soybean (Adu & Otten 1994), white bean (Adu & Otten 1996), grape (Tulasidas et al 1997), apple (Feng & Tang 1998), carrot (Lin et al 1998; Litvin et al 1998), banana (Maskan 2000), kiwi (Maskan 2001), parsley (Soysal 2004), spinach (Ozkan et al 2007), grapevine leaves (Alibaş 2012). Related to garlic drying, different drying methods were reported in the literature (Madamba et al 1996; Sablani et al 2007; Babetto et al 2011; Thuwapanichayanan et al 2014). Microwave drying for garlic clove was also investigated in some studies (Sharma & Prasad 2001; Sharma & Prasad 2006; Figiel 2009).
The aim of this study is to investigate the drying kinetics of Tunceli garlic in a microwave oven at different microwave power levels and different
temsil eden en iyi model olarak belirlenmiştir. Mikrodalga çıkış gücündeki (P) artma ile kuruma hızı artarken örnek kütlesindeki (m) artma ile kuruma hızının azaldığı görülmüştür. Farklı örnek kütleleri için etkin difüzyon katsayıları
(Deff) ve kuruma hız sabitleri (k) 90 W mikrodalga çıkış gücünde belirlenmiştir. Hem kuruma hız sabitleri hem de etkin
difüzyon katsayıları için Arrhenius tipi exponansiyel bir eşitlik kullanılarak aktivasyon enerjisi belirlenmiştir. Etkin
difüzyon katsayılarından ve kuruma hız sabitlerinden aktivasyon enerjileri sırasıyla 3.85 W g-1 ve 3.99 W g-1 olarak
belirlenmiştir.
Anahtar Kelimeler: Tunceli sarımsağı; İnce tabaka kurutma; Mikrodalga kurutma
Tunceli Sarımsağının Mikrodalga Kurutma Tekniği ile Kuruma Kinetiğinin Belirlenmesi, Yoğurtçu
239
Ta r ı m B i l i m l e r i D e r g i s i – J o u r n a l o f A g r i c u l t u r a l S c i e n c e s 22 (2016) 237-248amounts of the garlic and to apply the chosen thin layer drying models. This will be the first study investigating drying behavior of Tunceli garlic. This study is also original due to using microwave drying which is recently used as an alternative drying method in the food industry for Tunceli garlic.
2. Material and Methods
2.1. MaterialTunceli garlic (Allium tuncelianum) samples used in this study were obtained from a Tunceli-based and licensed producer, who grows garlic in a natural-like medium. Dirt and plant residues of the garlic samples were cleaned off and stored unpeeled at 4±0.5 °C in a refrigerator. Moisture determination device with a halogen lamp (AND MX50, Japan) was used to determine the initial moisture content of the garlic samples. The moisture content of the garlic samples was found to be 1.42 kgwater kgdm-1.
The deviation among the five measurement results was ±2%.
2.2. The experimental set-up and method
In the garlic drying experiments, a domestic microwave oven with a maximum output power of 800 W and a frequency of 2450 MHz (SIEMENS HF12G240, Germany) was used. This microwave oven was modified by attaching 0.01 g sensitive digital scales to the oven and a pendulum to the scales (Figure 1). The teflon (PTFE) string attached to the pendulum was dangled into the oven whose internal dimensions were 194 mm (H) x 290 mm (W) x 300 mm (D). A teflon dish (diameter of 120 mm and depth of 5 mm) attached to the teflon string was used to place the garlic samples in microwave oven. Changes in mass were monitored periodically with a chronometer.
Garlic was peeled before each drying experiment and sliced 4±0.5 mm thick. Garlic slices placed in the teflon dish were dried at 90, 180, 360 and 600 W microwave output powers until their ultimate moisture content of 0.05 kgwater kgdm-1. Drying
experiments were realized in duplicate.
Figure 1- Microwave drying experimental setup. 1, microwave oven; 2, power and time set; 3, electronic balance; 4, pendulum hanger; 5, PP pendulum rope; 6, PTFE plate
Şekil 1- Mikrodal kurutma deney düzeneği 1, mikrodalga fırın; 2, güç ve zaman ayar düğmeleri; 3, elektronik terazi; 4, sarkaç tutucu; 5, PP sarkaç ipi; 6, PTFE tabak
2.3. Modeling of microwave drying curves
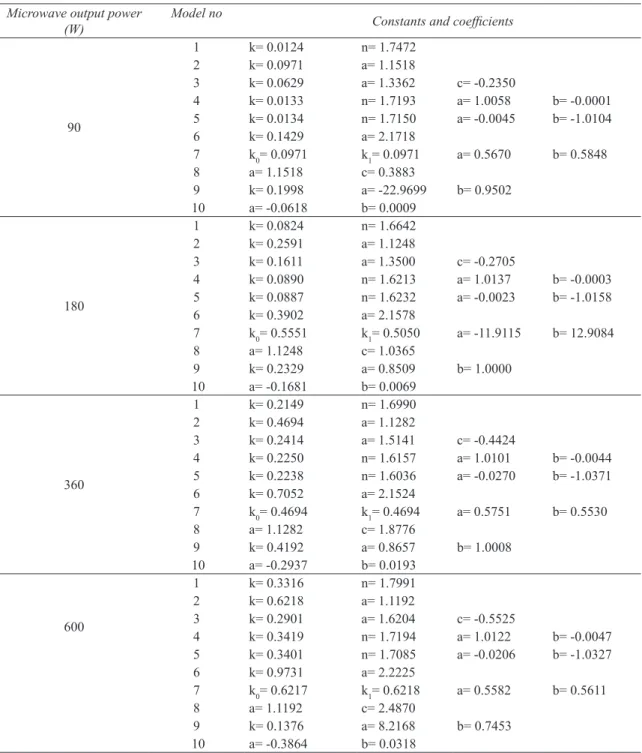
Mathematical models to represent the thin layer drying behaviors of food products and agricultural products were developed by many researchers. Ten mathematical models in the literature were used in this study (Table 1). The dimensionless moisture ratio (MR) in these models is calculated with the Equation 1 and 2.
3
Garlic was peeled before each drying experiment and sliced 4±0.5 mm thick. Garlic slices placed in the teflon dish were dried at 90, 180, 360 and 600 W microwave output powers until their ultimate moisture content of 0.05 kgwater kgdm-1. Drying experiments were realized in duplicate.
Figure 1- Microwave drying experimental setup. 1, microwave oven; 2, power and time set; 3, electronic balance; 4, pendulum hanger; 5, PP pendulum rope; 6, PTFE plate
Şekil 1- Mikrodal kurutma deney düzeneği 1, mikrodalga fırın; 2, güç ve zaman ayar düğmeleri; 3, elektronik terazi; 4, sarkaç tutucu; 5, PP sarkaç ipi; 6, PTFE tabak
2.3. Modeling of microwave drying curves
Mathematical models to represent the thin layer drying behaviors of food products and agricultural products were developed by many researchers. Ten mathematical models in the literature were used in this study (Table 1). The dimensionless moisture ratio (MR) in these models is calculated with the Equation 1 and 2.
MR=MCt - MCe
MC0 - MCe (1)
MC=𝑊𝑊𝑡𝑡 − 𝑊𝑊𝑑𝑑
𝑊𝑊𝑑𝑑 (2)
Where; wt (kg) and wd, masses of the garlic samples (kg) at any time of drying and at the end of drying,
respectively; MC0 and MCt, moisture contents of the garlic samples (kgwater kgdm-1) in the beginning and at
any time of drying, respectively; MCe, equilibrium moisture content (kgwater kgdm-1). It has been regarded
as the moisture content at the end of drying in the microwave drying (Ren & Chen 1998; Altan & Maskan 2005).
Drying rate of the garlic slices (DR (kgwater kgdm-1 min-1)) was calculated with the Equation 3.
DR=MCt+dtdt - MCt (3)
Where; dt, period between two consecutive measurements (min).
The constants of the mathematical models were determined by doing regression analysis. Regression analyses were done with STATISTICA data analysis program (version 10). The consistency between the moisture ratios that were determined experimentally and calculated from the mathematical model was determined by using statistical parameters, i.e. determination of coefficient (R2), chi-square ( 2), root
mean square error (RMSE), and percentage error (E%). Small 2 and RMSE values and high R2 values
show that the model was more suitable (Yaldız & Ertekin 2001; Midilli & Küçük 2003).
Where; wt (kg) and wd, masses of the garlic samples (kg) at any time of drying and at the end of drying, respectively;
3
Garlic was peeled before each drying experiment and sliced 4±0.5 mm thick. Garlic slices placed in the teflon dish were dried at 90, 180, 360 and 600 W microwave output powers until their ultimate moisture content of 0.05 kgwater kgdm-1. Drying experiments were realized in duplicate.
Figure 1- Microwave drying experimental setup. 1, microwave oven; 2, power and time set; 3, electronic balance; 4, pendulum hanger; 5, PP pendulum rope; 6, PTFE plate
Şekil 1- Mikrodal kurutma deney düzeneği 1, mikrodalga fırın; 2, güç ve zaman ayar düğmeleri; 3, elektronik terazi; 4, sarkaç tutucu; 5, PP sarkaç ipi; 6, PTFE tabak
2.3. Modeling of microwave drying curves
Mathematical models to represent the thin layer drying behaviors of food products and agricultural products were developed by many researchers. Ten mathematical models in the literature were used in this study (Table 1). The dimensionless moisture ratio (MR) in these models is calculated with the Equation 1 and 2.
MR=MCt - MCe
MC0 - MCe (1)
MC=𝑊𝑊𝑡𝑡 − 𝑊𝑊𝑑𝑑
𝑊𝑊𝑑𝑑 (2)
Where; wt (kg) and wd, masses of the garlic samples (kg) at any time of drying and at the end of drying,
respectively; MC0 and MCt, moisture contents of the garlic samples (kgwater kgdm-1) in the beginning and at
any time of drying, respectively; MCe, equilibrium moisture content (kgwater kgdm-1). It has been regarded
as the moisture content at the end of drying in the microwave drying (Ren & Chen 1998; Altan & Maskan 2005).
Drying rate of the garlic slices (DR (kgwater kgdm-1 min-1)) was calculated with the Equation 3.
DR=MCt+dt - MCt
dt (3)
Where; dt, period between two consecutive measurements (min).
The constants of the mathematical models were determined by doing regression analysis. Regression analyses were done with STATISTICA data analysis program (version 10). The consistency between the moisture ratios that were determined experimentally and calculated from the mathematical model was determined by using statistical parameters, i.e. determination of coefficient (R2), chi-square ( 2), root
mean square error (RMSE), and percentage error (E%). Small 2 and RMSE values and high R2 values
show that the model was more suitable (Yaldız & Ertekin 2001; Midilli & Küçük 2003).
and
3
Garlic was peeled before each drying experiment and sliced 4±0.5 mm thick. Garlic slices placed in the teflon dish were dried at 90, 180, 360 and 600 W microwave output powers until their ultimate moisture content of 0.05 kgwater kgdm-1. Drying experiments were realized in duplicate.
Figure 1- Microwave drying experimental setup. 1, microwave oven; 2, power and time set; 3, electronic balance; 4, pendulum hanger; 5, PP pendulum rope; 6, PTFE plate
Şekil 1- Mikrodal kurutma deney düzeneği 1, mikrodalga fırın; 2, güç ve zaman ayar düğmeleri; 3, elektronik terazi; 4, sarkaç tutucu; 5, PP sarkaç ipi; 6, PTFE tabak
2.3. Modeling of microwave drying curves
Mathematical models to represent the thin layer drying behaviors of food products and agricultural products were developed by many researchers. Ten mathematical models in the literature were used in this study (Table 1). The dimensionless moisture ratio (MR) in these models is calculated with the Equation 1 and 2.
MR=MCt - MCe
MC0 - MCe (1)
MC=𝑊𝑊𝑡𝑡 − 𝑊𝑊𝑑𝑑
𝑊𝑊𝑑𝑑 (2)
Where; wt (kg) and wd, masses of the garlic samples (kg) at any time of drying and at the end of drying,
respectively; MC0 and MCt, moisture contents of the garlic samples (kgwater kgdm-1) in the beginning and at
any time of drying, respectively; MCe, equilibrium moisture content (kgwater kgdm-1). It has been regarded
as the moisture content at the end of drying in the microwave drying (Ren & Chen 1998; Altan & Maskan 2005).
Drying rate of the garlic slices (DR (kgwater kgdm-1 min-1)) was calculated with the Equation 3.
DR=MCt+dt - MCt
dt (3)
Where; dt, period between two consecutive measurements (min).
The constants of the mathematical models were determined by doing regression analysis. Regression analyses were done with STATISTICA data analysis program (version 10). The consistency between the moisture ratios that were determined experimentally and calculated from the mathematical model was determined by using statistical parameters, i.e. determination of coefficient (R2), chi-square ( 2), root
mean square error (RMSE), and percentage error (E%). Small 2 and RMSE values and high R2 values
show that the model was more suitable (Yaldız & Ertekin 2001; Midilli & Küçük 2003).
, moisture contents of the garlic samples (kgwater kgdm-1) in the
beginning and at any time of drying, respectively;
3
Garlic was peeled before each drying experiment and sliced 4±0.5 mm thick. Garlic slices placed in the teflon dish were dried at 90, 180, 360 and 600 W microwave output powers until their ultimate moisture content of 0.05 kgwater kgdm-1. Drying experiments were realized in duplicate.
Figure 1- Microwave drying experimental setup. 1, microwave oven; 2, power and time set; 3, electronic balance; 4, pendulum hanger; 5, PP pendulum rope; 6, PTFE plate
Şekil 1- Mikrodal kurutma deney düzeneği 1, mikrodalga fırın; 2, güç ve zaman ayar düğmeleri; 3, elektronik terazi; 4, sarkaç tutucu; 5, PP sarkaç ipi; 6, PTFE tabak
2.3. Modeling of microwave drying curves
Mathematical models to represent the thin layer drying behaviors of food products and agricultural products were developed by many researchers. Ten mathematical models in the literature were used in this study (Table 1). The dimensionless moisture ratio (MR) in these models is calculated with the Equation 1 and 2.
MR=MCt - MCe
MC0 - MCe (1)
MC=𝑊𝑊𝑡𝑡 − 𝑊𝑊𝑑𝑑
𝑊𝑊𝑑𝑑 (2)
Where; wt (kg) and wd, masses of the garlic samples (kg) at any time of drying and at the end of drying,
respectively; MC0 and MCt, moisture contents of the garlic samples (kgwater kgdm-1) in the beginning and at
any time of drying, respectively; MCe, equilibrium moisture content (kgwater kgdm-1). It has been regarded
as the moisture content at the end of drying in the microwave drying (Ren & Chen 1998; Altan & Maskan 2005).
Drying rate of the garlic slices (DR (kgwater kgdm-1 min-1)) was calculated with the Equation 3.
DR=MCt+dt - MCt
dt (3)
Where; dt, period between two consecutive measurements (min).
The constants of the mathematical models were determined by doing regression analysis. Regression analyses were done with STATISTICA data analysis program (version 10). The consistency between the moisture ratios that were determined experimentally and calculated from the mathematical model was determined by using statistical parameters, i.e. determination of coefficient (R2), chi-square ( 2), root
mean square error (RMSE), and percentage error (E%). Small 2 and RMSE values and high R2 values
show that the model was more suitable (Yaldız & Ertekin 2001; Midilli & Küçük 2003).
, equilibrium moisture content (kgwater kgdm-1).
Determination of Drying Kinetics of Tunceli Garlic with Microwave Drying Technique, Yoğurtçu
240
Ta r ı m B i l i m l e r i D e r g i s i – J o u r n a l o f A g r i c u l t u r a l S c i e n c e s 22 (2016) 237-248end of drying in the microwave drying (Ren & Chen 1998; Altan & Maskan 2005).
Drying rate of the garlic slices (DR (kgwater kgdm-1
min-1)) was calculated with the Equation 3.
3
Garlic was peeled before each drying experiment and sliced 4±0.5 mm thick. Garlic slices placed in the teflon dish were dried at 90, 180, 360 and 600 W microwave output powers until their ultimate moisture content of 0.05 kgwater kgdm-1. Drying experiments were realized in duplicate.
Figure 1- Microwave drying experimental setup. 1, microwave oven; 2, power and time set; 3, electronic balance; 4, pendulum hanger; 5, PP pendulum rope; 6, PTFE plate
Şekil 1- Mikrodal kurutma deney düzeneği 1, mikrodalga fırın; 2, güç ve zaman ayar düğmeleri; 3, elektronik terazi; 4, sarkaç tutucu; 5, PP sarkaç ipi; 6, PTFE tabak
2.3. Modeling of microwave drying curves
Mathematical models to represent the thin layer drying behaviors of food products and agricultural products were developed by many researchers. Ten mathematical models in the literature were used in this study (Table 1). The dimensionless moisture ratio (MR) in these models is calculated with the Equation 1 and 2.
MR=MCt - MCe
MC0 - MCe (1)
MC=𝑊𝑊𝑡𝑡 − 𝑊𝑊𝑑𝑑
𝑊𝑊𝑑𝑑 (2)
Where; wt (kg) and wd, masses of the garlic samples (kg) at any time of drying and at the end of drying,
respectively; MC0 and MCt, moisture contents of the garlic samples (kgwater kgdm-1) in the beginning and at
any time of drying, respectively; MCe, equilibrium moisture content (kgwater kgdm-1). It has been regarded
as the moisture content at the end of drying in the microwave drying (Ren & Chen 1998; Altan & Maskan 2005).
Drying rate of the garlic slices (DR (kgwater kgdm-1 min-1)) was calculated with the Equation 3.
DR=MCt+dtdt - MCt (3)
Where; dt, period between two consecutive measurements (min).
The constants of the mathematical models were determined by doing regression analysis. Regression analyses were done with STATISTICA data analysis program (version 10). The consistency between the moisture ratios that were determined experimentally and calculated from the mathematical model was determined by using statistical parameters, i.e. determination of coefficient (R2), chi-square ( 2), root
mean square error (RMSE), and percentage error (E%). Small 2 and RMSE values and high R2 values
show that the model was more suitable (Yaldız & Ertekin 2001; Midilli & Küçük 2003).
(3) Where; dt, period between two consecutive measurements (min).
The constants of the mathematical models were determined by doing regression analysis. Regression analyses were done with STATISTICA data analysis program (version 10). The consistency between the moisture ratios that were determined experimentally and calculated from the mathematical model was determined by using statistical parameters, i.e. determination of coefficient (R2), chi-square (χ2), root mean square error (RMSE), and percentage error (E%). Small χ2 and RMSE values and high
R2 values show that the model was more suitable (Yaldız & Ertekin 2001; Midilli & Küçük 2003).
The E% values smaller than 10% were acceptable (Park et al 2002; Mohapatra & Rao 2005). The values of χ2, RMSE and E% were calculated with the Equations 4, 5 and 6.
4
Table 1- Thin-layer drying models applied to Tunceli garlic microwave drying curvesÇizelge 1- Uygulanan ince tabaka kuruma modelleri
Model
no Model name Model equation Reference
1 Page 𝑀𝑀𝑀𝑀 = 𝑒𝑒𝑒𝑒𝑒𝑒(−𝑘𝑘𝑡𝑡𝑛𝑛) Arslan & Özcan (2010)
2 Henderson & Pabis 𝑀𝑀𝑀𝑀 = 𝑎𝑎𝑒𝑒𝑒𝑒𝑒𝑒(−𝑘𝑘𝑡𝑡) Yagcıoglu et al (1999)
3 Logarithmic 𝑀𝑀𝑀𝑀 = 𝑎𝑎 𝑒𝑒𝑒𝑒𝑒𝑒(−𝑘𝑘𝑡𝑡) + 𝑐𝑐 Yaldız & Ertekin (2001)
4 Midilli et al 𝑀𝑀𝑀𝑀 = 𝑎𝑎 𝑒𝑒𝑒𝑒𝑒𝑒(−𝑘𝑘𝑡𝑡𝑛𝑛) + 𝑏𝑏𝑡𝑡 Midilli et al (2002)
5 Weibull Distribution 𝑀𝑀𝑀𝑀 = 𝑎𝑎 − 𝑏𝑏𝑒𝑒𝑒𝑒𝑒𝑒(−(𝑘𝑘𝑡𝑡𝑛𝑛)) Corzo et al (2008)
6 Two Term Exponential 𝑀𝑀𝑀𝑀 = 𝑎𝑎 𝑒𝑒𝑒𝑒𝑒𝑒(−𝑘𝑘𝑡𝑡) + (1 − 𝑎𝑎)𝑒𝑒𝑒𝑒𝑒𝑒(−𝑘𝑘𝑎𝑎𝑡𝑡) Yaldız & Ertekin (2001)
7 Two-Term 𝑀𝑀𝑀𝑀 = 𝑎𝑎 𝑒𝑒𝑒𝑒𝑒𝑒(−𝑘𝑘0𝑡𝑡) + 𝑏𝑏𝑒𝑒𝑒𝑒𝑒𝑒(−𝑘𝑘1𝑡𝑡) Arslan & Özcan (2010)
8 Simplified Fick’s
Diffusion 𝑀𝑀𝑀𝑀 = 𝑎𝑎𝑒𝑒𝑒𝑒𝑒𝑒(−𝑐𝑐(𝑡𝑡 𝐿𝐿
2)
⁄ ) Diamante & Munro (1991)
9 Diffusion Approach 𝑀𝑀𝑀𝑀 = 𝑎𝑎 𝑒𝑒𝑒𝑒𝑒𝑒(−𝑘𝑘𝑡𝑡) + (1 − 𝑎𝑎)𝑒𝑒𝑒𝑒𝑒𝑒(−𝑘𝑘𝑏𝑏𝑡𝑡) Doymaz (2013)
10 Wang & Singh 𝑀𝑀𝑀𝑀 = 1 + 𝑎𝑎𝑡𝑡 + 𝑏𝑏𝑡𝑡2 Eştürk & Soysal (2010)
The E% values smaller than 10% were acceptable (Park et al 2002; Mohapatra & Rao 2005). The values of 2, RMSE and E% were calculated with the Equations 4, 5 and 6.
2 = ∑Ni=1(MR𝑒𝑒𝑒𝑒𝑒𝑒, i-MR𝑒𝑒𝑝𝑝𝑒𝑒, i)2 N-z (4) RMSE = √∑Ni=1(MR𝑒𝑒𝑒𝑒𝑒𝑒, i-MR𝑒𝑒𝑝𝑝𝑒𝑒, i)2 𝑁𝑁 (5) E% = 100N ∑ |MR𝑒𝑒𝑒𝑒𝑒𝑒, i -MR𝑒𝑒𝑝𝑝𝑒𝑒, i| MR𝑒𝑒𝑒𝑒𝑒𝑒, i N i=1 (6)
Where; MRexp, i, experimental moisture ratio at i th observation; MRpre, i, predicted moisture ratio for
this observation; N, number of observations and z, number of constants in the model. 2.4. Diffusion of moisture
Removal of moisture from the solid matter during drying was diffusion-controlled. The effective diffusion coefficient for the garlic slices was determined by using Fick’s diffusion equation. The effective diffusion coefficient was calculated with the Equation 7 (Crank 1975).
MR=MCt - MCe
MC0 - MCe = 8
𝜋𝜋2∑
1
(2i+1)2 exp(-(2i+1) 2∙π2∙Deff
4∙L2 ∙t)
∞
i=0 (7)
Where; t, time (s); L, half-thickness of garlic slice (m); Deff, effective diffusion coefficient (m2 s-1).
For long drying periods Equation 7 can be written as Equation 8 (i.e. for i= 0) (Lopez et al 2000).
MR=MCt - MCe MC0 - MCe = 8 𝜋𝜋2exp(− π2∙Deff 4∙L2 ∙t) (8)
The Equation 8 can be written in logarithmic form as in Equation 9.
ln(MR) = ln (π82) - (
π2∙Deff
4∙L2 ∙t) (9)
Experimental ln (MR) values and drying time can be transferred onto a graph and the effective diffusion coefficient is calculated from the slope (Equation 10) of line obtained from the graph.
Slope =π2∙Deff
4∙L2 (10)
Where; MRexp, i, experimental moisture ratio at i th observation; MRpre, i, predicted moisture ratio for this observation; N, number of observations and z, number of constants in the model.
2.4. Diffusion of moisture
Removal of moisture from the solid matter during drying was diffusion-controlled. The effective diffusion coefficient for the garlic slices was determined by using Fick’s diffusion equation. The effective diffusion coefficient was calculated with the Equation 7 (Crank 1975).
4 Table 1- Thin-layer drying models applied to Tunceli garlic microwave drying curves
Çizelge 1- Uygulanan ince tabaka kuruma modelleri Model
no Model name Model equation Reference
1 Page 𝑀𝑀𝑀𝑀 = 𝑒𝑒𝑒𝑒𝑒𝑒(−𝑘𝑘𝑡𝑡𝑛𝑛) Arslan & Özcan (2010)
2 Henderson & Pabis 𝑀𝑀𝑀𝑀 = 𝑎𝑎𝑒𝑒𝑒𝑒𝑒𝑒(−𝑘𝑘𝑡𝑡) Yagcıoglu et al (1999) 3 Logarithmic 𝑀𝑀𝑀𝑀 = 𝑎𝑎 𝑒𝑒𝑒𝑒𝑒𝑒(−𝑘𝑘𝑡𝑡) + 𝑐𝑐 Yaldız & Ertekin (2001) 4 Midilli et al 𝑀𝑀𝑀𝑀 = 𝑎𝑎 𝑒𝑒𝑒𝑒𝑒𝑒(−𝑘𝑘𝑡𝑡𝑛𝑛) + 𝑏𝑏𝑡𝑡 Midilli et al (2002)
5 Weibull Distribution 𝑀𝑀𝑀𝑀 = 𝑎𝑎 − 𝑏𝑏𝑒𝑒𝑒𝑒𝑒𝑒(−(𝑘𝑘𝑡𝑡𝑛𝑛)) Corzo et al (2008)
6 Two Term Exponential 𝑀𝑀𝑀𝑀 = 𝑎𝑎 𝑒𝑒𝑒𝑒𝑒𝑒(−𝑘𝑘𝑡𝑡) + (1 − 𝑎𝑎)𝑒𝑒𝑒𝑒𝑒𝑒(−𝑘𝑘𝑎𝑎𝑡𝑡) Yaldız & Ertekin (2001) 7 Two-Term 𝑀𝑀𝑀𝑀 = 𝑎𝑎 𝑒𝑒𝑒𝑒𝑒𝑒(−𝑘𝑘0𝑡𝑡) + 𝑏𝑏𝑒𝑒𝑒𝑒𝑒𝑒(−𝑘𝑘1𝑡𝑡) Arslan & Özcan (2010)
8 Simplified Fick’s
Diffusion 𝑀𝑀𝑀𝑀 = 𝑎𝑎𝑒𝑒𝑒𝑒𝑒𝑒(−𝑐𝑐(𝑡𝑡 𝐿𝐿
2)
⁄ ) Diamante & Munro (1991) 9 Diffusion Approach 𝑀𝑀𝑀𝑀 = 𝑎𝑎 𝑒𝑒𝑒𝑒𝑒𝑒(−𝑘𝑘𝑡𝑡) + (1 − 𝑎𝑎)𝑒𝑒𝑒𝑒𝑒𝑒(−𝑘𝑘𝑏𝑏𝑡𝑡) Doymaz (2013)
10 Wang & Singh 𝑀𝑀𝑀𝑀 = 1 + 𝑎𝑎𝑡𝑡 + 𝑏𝑏𝑡𝑡2 Eştürk & Soysal (2010)
The E% values smaller than 10% were acceptable (Park et al 2002; Mohapatra & Rao 2005). The
values of 2, RMSE and E% were calculated with the Equations 4, 5 and 6.
2 = ∑Ni=1(MR𝑒𝑒𝑒𝑒𝑒𝑒, i-MR𝑒𝑒𝑝𝑝𝑒𝑒, i)2 N-z (4) RMSE = √∑Ni=1(MR𝑒𝑒𝑒𝑒𝑒𝑒, i-MR𝑒𝑒𝑝𝑝𝑒𝑒, i)2 𝑁𝑁 (5) E% = 100N ∑ |MR𝑒𝑒𝑒𝑒𝑒𝑒, i -MR𝑒𝑒𝑝𝑝𝑒𝑒, i| MR𝑒𝑒𝑒𝑒𝑒𝑒, i N i=1 (6)
Where; MRexp, i, experimental moisture ratio at i th observation; MRpre, i, predicted moisture ratio for
this observation; N, number of observations and z, number of constants in the model.
2.4. Diffusion of moisture
Removal of moisture from the solid matter during drying was diffusion-controlled. The effective diffusion coefficient for the garlic slices was determined by using Fick’s diffusion equation. The effective diffusion coefficient was calculated with the Equation 7 (Crank 1975).
MR=MCt - MCe
MC0 - MCe =
8 𝜋𝜋2∑
1
(2i+1)2 exp(-(2i+1)
2∙π2∙Deff
4∙L2 ∙t)
∞
i=0 (7)
Where; t, time (s); L, half-thickness of garlic slice (m); Deff, effective diffusion coefficient (m2 s-1).
For long drying periods Equation 7 can be written as Equation 8 (i.e. for i= 0) (Lopez et al 2000).
MR=MCt - MCe MC0 - MCe = 8 𝜋𝜋2exp(− π2∙Deff 4∙L2 ∙t) (8)
The Equation 8 can be written in logarithmic form as in Equation 9.
ln(MR) = ln (π82) - (
π2∙D
eff
4∙L2 ∙t) (9)
Experimental ln (MR) values and drying time can be transferred onto a graph and the effective diffusion coefficient is calculated from the slope (Equation 10) of line obtained from the graph.
Slope =π2∙Deff
4∙L2 (10)
(7) Where; t, time (s); L, half-thickness of garlic slice (m); Deff, effective diffusion coefficient (m2 s-1).
For long drying periods Equation 7 can be written as Equation 8 (i.e. for i= 0) (Lopez et al 2000).
4
Table 1- Thin-layer drying models applied to Tunceli garlic microwave drying curvesÇizelge 1- Uygulanan ince tabaka kuruma modelleri
Model
no Model name Model equation Reference
1 Page 𝑀𝑀𝑀𝑀 = 𝑒𝑒𝑒𝑒𝑒𝑒(−𝑘𝑘𝑡𝑡𝑛𝑛) Arslan & Özcan (2010)
2 Henderson & Pabis 𝑀𝑀𝑀𝑀 = 𝑎𝑎𝑒𝑒𝑒𝑒𝑒𝑒(−𝑘𝑘𝑡𝑡) Yagcıoglu et al (1999)
3 Logarithmic 𝑀𝑀𝑀𝑀 = 𝑎𝑎 𝑒𝑒𝑒𝑒𝑒𝑒(−𝑘𝑘𝑡𝑡) + 𝑐𝑐 Yaldız & Ertekin (2001)
4 Midilli et al 𝑀𝑀𝑀𝑀 = 𝑎𝑎 𝑒𝑒𝑒𝑒𝑒𝑒(−𝑘𝑘𝑡𝑡𝑛𝑛) + 𝑏𝑏𝑡𝑡 Midilli et al (2002)
5 Weibull Distribution 𝑀𝑀𝑀𝑀 = 𝑎𝑎 − 𝑏𝑏𝑒𝑒𝑒𝑒𝑒𝑒(−(𝑘𝑘𝑡𝑡𝑛𝑛)) Corzo et al (2008)
6 Two Term Exponential 𝑀𝑀𝑀𝑀 = 𝑎𝑎 𝑒𝑒𝑒𝑒𝑒𝑒(−𝑘𝑘𝑡𝑡) + (1 − 𝑎𝑎)𝑒𝑒𝑒𝑒𝑒𝑒(−𝑘𝑘𝑎𝑎𝑡𝑡) Yaldız & Ertekin (2001)
7 Two-Term 𝑀𝑀𝑀𝑀 = 𝑎𝑎 𝑒𝑒𝑒𝑒𝑒𝑒(−𝑘𝑘0𝑡𝑡) + 𝑏𝑏𝑒𝑒𝑒𝑒𝑒𝑒(−𝑘𝑘1𝑡𝑡) Arslan & Özcan (2010)
8 Simplified Fick’s
Diffusion 𝑀𝑀𝑀𝑀 = 𝑎𝑎𝑒𝑒𝑒𝑒𝑒𝑒(−𝑐𝑐(𝑡𝑡 𝐿𝐿
2)
⁄ ) Diamante & Munro (1991)
9 Diffusion Approach 𝑀𝑀𝑀𝑀 = 𝑎𝑎 𝑒𝑒𝑒𝑒𝑒𝑒(−𝑘𝑘𝑡𝑡) + (1 − 𝑎𝑎)𝑒𝑒𝑒𝑒𝑒𝑒(−𝑘𝑘𝑏𝑏𝑡𝑡) Doymaz (2013)
10 Wang & Singh 𝑀𝑀𝑀𝑀 = 1 + 𝑎𝑎𝑡𝑡 + 𝑏𝑏𝑡𝑡2 Eştürk & Soysal (2010)
The E% values smaller than 10% were acceptable (Park et al 2002; Mohapatra & Rao 2005). The values of 2, RMSE and E% were calculated with the Equations 4, 5 and 6.
2 = ∑Ni=1(MR𝑒𝑒𝑒𝑒𝑒𝑒, i-MR𝑒𝑒𝑝𝑝𝑒𝑒, i)2 N-z (4) RMSE = √∑Ni=1(MR𝑒𝑒𝑒𝑒𝑒𝑒, i-MR𝑒𝑒𝑝𝑝𝑒𝑒, i)2 𝑁𝑁 (5) E% = 100N ∑ |MR𝑒𝑒𝑒𝑒𝑒𝑒, i -MR𝑒𝑒𝑝𝑝𝑒𝑒, i| MR𝑒𝑒𝑒𝑒𝑒𝑒, i N i=1 (6)
Where; MRexp, i, experimental moisture ratio at i th observation; MRpre, i, predicted moisture ratio for
this observation; N, number of observations and z, number of constants in the model. 2.4. Diffusion of moisture
Removal of moisture from the solid matter during drying was diffusion-controlled. The effective diffusion coefficient for the garlic slices was determined by using Fick’s diffusion equation. The effective diffusion coefficient was calculated with the Equation 7 (Crank 1975).
MR=MCt - MCe
MC0 - MCe = 8
𝜋𝜋2∑
1
(2i+1)2 exp(-(2i+1) 2∙π2∙Deff
4∙L2 ∙t)
∞
i=0 (7)
Where; t, time (s); L, half-thickness of garlic slice (m); Deff, effective diffusion coefficient (m2 s-1).
For long drying periods Equation 7 can be written as Equation 8 (i.e. for i= 0) (Lopez et al 2000).
MR=MCt - MCe MC0 - MCe = 8 𝜋𝜋2exp(− π2∙Deff 4∙L2 ∙t) (8)
The Equation 8 can be written in logarithmic form as in Equation 9.
ln(MR) = ln (π82) - (
π2∙Deff
4∙L2 ∙t) (9)
Experimental ln (MR) values and drying time can be transferred onto a graph and the effective diffusion coefficient is calculated from the slope (Equation 10) of line obtained from the graph.
Slope =π2∙Deff
4∙L2 (10)
(8)
Table 1- Thin-layer drying models applied to Tunceli garlic microwave drying curves Çizelge 1- Uygulanan ince tabaka kuruma modelleri
Model no Model name Model equation Reference
1 2 3 4 5 6 7 8 9 10 Page
Henderson & Pabis Logarithmic Midilli et al Weibull Distribution Two Term Exponential Two-Term
Simplified Fick’s Diffusion Diffusion Approach Wang & Singh
4
Table 1- Thin-layer drying models applied to Tunceli garlic microwave drying curvesÇizelge 1- Uygulanan ince tabaka kuruma modelleri
Model
no Model name Model equation Reference
1 Page 𝑀𝑀𝑀𝑀 = 𝑒𝑒𝑒𝑒𝑒𝑒(−𝑘𝑘𝑡𝑡𝑛𝑛) Arslan & Özcan (2010)
2 Henderson & Pabis 𝑀𝑀𝑀𝑀 = 𝑎𝑎𝑒𝑒𝑒𝑒𝑒𝑒(−𝑘𝑘𝑡𝑡) Yagcıoglu et al (1999)
3 Logarithmic 𝑀𝑀𝑀𝑀 = 𝑎𝑎 𝑒𝑒𝑒𝑒𝑒𝑒(−𝑘𝑘𝑡𝑡) + 𝑐𝑐 Yaldız & Ertekin (2001)
4 Midilli et al 𝑀𝑀𝑀𝑀 = 𝑎𝑎 𝑒𝑒𝑒𝑒𝑒𝑒(−𝑘𝑘𝑡𝑡𝑛𝑛) + 𝑏𝑏𝑡𝑡 Midilli et al (2002)
5 Weibull Distribution 𝑀𝑀𝑀𝑀 = 𝑎𝑎 − 𝑏𝑏𝑒𝑒𝑒𝑒𝑒𝑒(−(𝑘𝑘𝑡𝑡𝑛𝑛)) Corzo et al (2008)
6 Two Term Exponential 𝑀𝑀𝑀𝑀 = 𝑎𝑎 𝑒𝑒𝑒𝑒𝑒𝑒(−𝑘𝑘𝑡𝑡) + (1 − 𝑎𝑎)𝑒𝑒𝑒𝑒𝑒𝑒(−𝑘𝑘𝑎𝑎𝑡𝑡) Yaldız & Ertekin (2001)
7 Two-Term 𝑀𝑀𝑀𝑀 = 𝑎𝑎 𝑒𝑒𝑒𝑒𝑒𝑒(−𝑘𝑘0𝑡𝑡) + 𝑏𝑏𝑒𝑒𝑒𝑒𝑒𝑒(−𝑘𝑘1𝑡𝑡) Arslan & Özcan (2010)
8 Simplified Fick’s
Diffusion 𝑀𝑀𝑀𝑀 = 𝑎𝑎𝑒𝑒𝑒𝑒𝑒𝑒(−𝑐𝑐(𝑡𝑡 𝐿𝐿
2)
⁄ ) Diamante & Munro (1991)
9 Diffusion Approach 𝑀𝑀𝑀𝑀 = 𝑎𝑎 𝑒𝑒𝑒𝑒𝑒𝑒(−𝑘𝑘𝑡𝑡) + (1 − 𝑎𝑎)𝑒𝑒𝑒𝑒𝑒𝑒(−𝑘𝑘𝑏𝑏𝑡𝑡) Doymaz (2013)
10 Wang & Singh 𝑀𝑀𝑀𝑀 = 1 + 𝑎𝑎𝑡𝑡 + 𝑏𝑏𝑡𝑡2 Eştürk & Soysal (2010)
The E% values smaller than 10% were acceptable (Park et al 2002; Mohapatra & Rao 2005). The values of 2, RMSE and E% were calculated with the Equations 4, 5 and 6.
2 = ∑Ni=1(MR𝑒𝑒𝑒𝑒𝑒𝑒, i-MR𝑒𝑒𝑝𝑝𝑒𝑒, i)2 N-z (4) RMSE = √∑Ni=1(MR𝑒𝑒𝑒𝑒𝑒𝑒, i-MR𝑒𝑒𝑝𝑝𝑒𝑒, i)2 𝑁𝑁 (5) E% = 100N ∑ |MR𝑒𝑒𝑒𝑒𝑒𝑒, i -MR𝑒𝑒𝑝𝑝𝑒𝑒, i| MR𝑒𝑒𝑒𝑒𝑒𝑒, i N i=1 (6)
Where; MRexp, i, experimental moisture ratio at i th observation; MRpre, i, predicted moisture ratio for
this observation; N, number of observations and z, number of constants in the model. 2.4. Diffusion of moisture
Removal of moisture from the solid matter during drying was diffusion-controlled. The effective diffusion coefficient for the garlic slices was determined by using Fick’s diffusion equation. The effective diffusion coefficient was calculated with the Equation 7 (Crank 1975).
MR=MCt - MCe
MC0 - MCe = 8
𝜋𝜋2∑
1
(2i+1)2 exp(-(2i+1) 2∙π2∙Deff
4∙L2 ∙t)
∞
i=0 (7)
Where; t, time (s); L, half-thickness of garlic slice (m); Deff, effective diffusion coefficient (m2 s-1).
For long drying periods Equation 7 can be written as Equation 8 (i.e. for i= 0) (Lopez et al 2000).
MR=MCt - MCe MC0 - MCe = 8 𝜋𝜋2exp(− π2∙Deff 4∙L2 ∙t) (8)
The Equation 8 can be written in logarithmic form as in Equation 9.
ln(MR) = ln (π82) - (
π2∙Deff
4∙L2 ∙t) (9)
Experimental ln (MR) values and drying time can be transferred onto a graph and the effective diffusion coefficient is calculated from the slope (Equation 10) of line obtained from the graph.
Slope =π2∙Deff
4∙L2 (10)
Arslan & Özcan (2010) Yagcıoglu et al (1999) Yaldız & Ertekin (2001) Midilli et al (2002) Corzo et al (2008) Yaldız & Ertekin (2001) Arslan & Özcan (2010) Diamante & Munro (1991) Doymaz (2013)