TOBB UNIVERSITY OF ECONOMICS & TECHNOLOGY GRADUATE SCHOOL OF NATURAL AND APPLIED SCIENCES
MASTER OF ARCHITECTURE
APRIL 2020
INVESTIGATION OF URBAN CLIMATE AND BUILT ENVIRONMENT RELATIONS BY USING MACHINE LEARNING
Supervisor: Asst. Prof. Aktan ACAR Mustafa KOÇ
ii
DECLARATION OF THE THESIS
I hereby declare that all information in this document has been obtained and presented in accordance with academic rules and ethical conduct. I also declare that, as required by these rules and conduct, I have fully cited and referenced all material and results that are not original to this work. This document is prepared in accordance with TOBB ETU Institute of Science thesis writing rules.
iii
TEZ BİLDİRİMİ
Tez içindeki bütün bilgilerin etik davranış ve akademik kurallar çerçevesinde elde edilerek sunulduğunu, alıntı yapılan kaynaklara eksiksiz atıf yapıldığını, referansların tam olarak belirtildiğini ve ayrıca bu tezin TOBB ETÜ Fen Bilimleri Enstitüsü tez yazım kurallarına uygun olarak hazırlandığını bildiririm.
iv
ABSTRACT
Master of Architecture
INVESTIGATION OF URBAN CLIMATE AND BUILT ENVIRONMENT RELATIONS BY USING MACHINE LEARNING
Mustafa KOÇ
TOBB University of Economics and Technology Institute of Natural and Applied Sciences
Department of Architecture Supervisor: Asst. Prof. Aktan ACAR
Date: April 2020
Climate change can cause a cascade of effects from the individual organisms to ecosystem-scale where in nature all species are elements of complex networks of interactions so every effect on every scale has great role. The properties of those networks are decisive on ecosystems all around the world so how they will be modified by climate change needs serious studies. Urban areas’ vast population exert significant effects on the climate change even though they cover a small proportion of the Earth’s surface, however, impacts of the urbanization on climate and ecosystems remain inadequately understood. In the meantime, urbanization continues to increase and in the 2030, 2/3 of the population is expected to be living in urban areas and this rate will increase in time. It is of importance to elaborate the studies investigating the relations between the urbanization and climate. In this respect, the use of information technologies with an extensive computational capacity is one of the cornerstones of the climate and urban studies.
v
Machine learning algorithms is a branch of computer science that deals with automated recognition of patterns from data. The use of the machine learning algorithms can bring great advantages to both understanding and predicting the climate. The computational power with big data and ability to capture nonlinear behavior, learn as new data arrive, etc. make the machine learning favorable tool for understanding climate and developing urban planning. In this sense, purpose of this study is showing the advantages of machine learning algorithms by achieving working recurrent neural network algorithm to make climate predictions, and through this achievement, stating possible effects of machine learning on design and its contribution to understanding the climate.
Keywords: Architecture, Climate, Urban Design, Climate Change, Machine
vi
ÖZET
Yüksek Lisans Tezi
KENTSEL İKLİM VE YAPILI ÇEVRE İLİŞKİLERİNİN MAKİNE ÖĞRENİMİ İLE İNCELENMESİ
Mustafa KOÇ
TOBB Ekonomi ve Teknoloji Üniveritesi Fen Bilimleri Enstitüsü
Mimarlık Anabilim Dalı
Danışman: Dr. Öğr. Üyesi Aktan Acar Tarih: Nisan 2020
İklim değişikliği, bütün türlerin karmaşık bir etkileşim ağının öğesi olduğu doğada, tek organizma ölçeğinden ekosistem ölçeğine kadar bir etkiler zincirine sebep olabilir; bu nedenle her ölçekteki her etkinin değişimdeki rolü çok büyüktür. Bu ağların özellikleri, dünyadaki bütün ekosistemlerde belirleyici role sahiptir, bu nedenle iklim değişikliğinden nasıl etkileneceği ciddi araştırmalar sonucunda ortaya çıkacaktır. Kentsel alanlar, Dünya yüzeyinin küçük bir kısmını oluşturmasına rağmen iklim değişikliği üzerinde önemli etkiler yaratmaktadırlar ve bu etkilere karşın, kentleşmenin iklim ve ekosistemler üzerindeki etkileri yeterince çalışılmamıştır. Bu arada, kentleşme dünya genelinde artmaya devam etmektedir ve 2030'da nüfusun 2/3'ünün kentsel alanlarda yaşaması ve bu oranın zamanla artması beklenmektedir. Kentleşmeyi arttırmak, kentsel klimatolojiyi anlamayı ve gelecekteki senaryoları tahmin etmeyi iklim değişikliği konusunda önemli bir sorun haline getirmektedir. Günümüzde bu alandaki analitik araçların kullanımı artmış ve çok sayıda yazılım geliştirilmiştir. Bu yazılımları kullanmak, iklim değişikliğinin etkilerine göre kentsel alanlar oluşturmak için iklimi ve özellikleri hakkında kavrayışımızı geliştirecektir. Diğer yandan, gelişen teknoloji ile birlikte, model oluşturma ve simülasyon yapmada kullanılabilecek araçlar da artmakta ve gelişmektedir. Bu araçlardan biri,
vii
bilgisayardaki veri bilimlerinde otomatik olarak tanınmasıyla ilgilenen bilgisayar bilimi dalı olan makine öğrenmesi algoritmalarıdır. Makine öğrenmesi algoritmalarının kullanılmasının, iklimi anlama ve öngörmede büyük avantajlar sağlaması hedeflenmektedir. Büyük veriye dair hesaplama gücü ve doğrusal olmayan davranışları yakalama, yeni veriler geldiğinde öğrenme vb. özellikleri, makine öğrenmesini iklimin anlaşılması ve kentsel planlamanın geliştirilmesi için uygun bir araç haline getirecektir. Bu çalışmada açık kaynaklı bir makine öğrenmesi algoritması ele alınarak, iklim parametrelerinin geleceğe yönelik tahminlerini yapmak için modifiye edilmiştir. Bu anlamda, bu çalışmanın amacı, iklim tahmini yapmak için çalışan “recurrent neural network” algoritması elde ederek makine öğrenmesi algoritmalarının avantajlarını ve kullanılabilirliğini göstermek, bunun üzerinden makine öğreniminin tasarım elemanı olarak etkin bir şekilde kullanılması üzerine ve iklimin anlaşılması üzerine olası durumları tartışmaktadır.
Anahtar Kelimeler: Mimarlık, İklim, Kentsel Tasarım, İklim Değişikliği, Makine
viii
ix
ACKNOWLEDGEMENTS
First of all, I would like to thank my supervisor Asst. Prof. Aktan Acar even though it is not enough to show my gratitude to him. I am very thankful to his patience, innovativeness, open mindnesses and mostly to his great knowledge. As an outsider to the department, I am very grateful that he gave me the chance to work with him. I would like to also thank to Prof. Dr. T. Nur Çağlar, Asst. Prof. Murat Sönmez and Asst. Prof. Pelin Gürol Öngören for their contributions to me and my education during postgraduation. I would also like to thank to jury members, Assoc. Prof. Olgu Çalışkan and Asst. Prof. Koray Pekeriçli for their valuable comments and evaluations in the jury. Also, I would like to thank Assoc. Prof. Murat Özbayoğlu for his valuable comments.
I would want to thank my friends; Kevser Özkul, Burçin Sönmez Yılmaz, Havva Nur Başağaç, Altuğ Berkay Farsakoğlu, Ömer Özgenç, and Şeyma Nur Çalışkan for their friendship and support. Especially, I want to thank my friends Mert Alay, Çağın Lenk, and Uğurcan Muğan for their contributions and great friendship.
Finally, I would like to thank my family, especially to my brother Mehmet Koç because of his great contributions and support to this work and me. They are the best.
x
TABLE OF CONTENTS
Page
DECLARATION OF THE THESIS ... ii
TEZ BİLDİRİMİ ... iii ABSTRACT ... iv ÖZET ... vi ACKNOWLEDGEMENTS ... ix TABLE OF CONTENTS ... x LIST OF FIGURES ... xi ABBREVIATIONS ... xiii 1. INTRODUCTION ... 1
1.1 Purpose and Structure of the Thesis ... 2
1.2 Method of the Study ... 2
1.3 Limitations ... 3
2. AN INTERDISCIPLINARY APPROACH TO CLIMATE, BUILT ENVIRONMENT AND MACHINE LEARNING ... 5
2.1 Climate ... 5
2.2 Climate Change and Built Environment ... 7
2.3 Machine Learning ... 11
2.3.1 Neural Networks ... 13
2.3.2 Long Short-Term Memory (LSTM) Recurrent Neural Networks ... 14
2.3.3 Artificial Intelligence (AI) and Architecture ... 15
2.4 A Projective Tool for the Climate Change Impacts on Built Environment 17 3. MODELS AND METHOD ... 19
3.1 Models Used in the Study ... 20
3.1.1 LSTM Neural Network Model ... 20
3.1.2 Image Process for Building Detection Model ... 21
3.2 Data Used in the Study ... 23
3.3 Formation and Adaptation Method ... 26
3.3.1 Formation and Adaptation of Data Used ... 26
3.3.2 Formation and Adaptation of Algorithms Used ... 27
3.4 Results ... 29
3.4.1 Results of Climate Prediction Model ... 29
3.4.2 Results of Image Process for Building Detection ... 38
3.4.3 Forecasts ... 41
4. CONCLUSION ... 47
4.1 Analyses of the Results ... 47
4.2 Discussions ... 48
4.3 Future Works ... 50
REFERENCES ... 53
xi
LIST OF FIGURES
Page
Figure 2.1 : Example of One Node of Neural Network (Nicholson, 2019) ... 13
Figure 2.2 : Example of Layers of Neural Network (Nicholson, 2019) ... 13
Figure 2.3 : Detailed Schematic of LSTM Memory Block (Nicholson, 2019) ... 14
Figure 3.1 : Gabor features of the satellite image of Esenboğa region ... 22
Figure 3.2 : Detected buildings from satellte image of Esenboğa region after spatial voting ... 22
Figure 3.3 : Built environment detected from satellite image of Esenboğa region .... 23
Figure 3.4 : Temperature and Dewpoint Temperature Data ... 24
Figure 3.5 : Atmospheric Air Pressure and Atmospheric Air Pressure Reduced to Sea Level Data ... 25
Figure 3.6 : Relative Humidity and Precipitation Amount Data ... 25
Figure 3.7 : Cloud Cover and Vertical Visibility Data ... 26
Figure 3.8: Detected buildings from satellite image of Esenboğa region in cloudy day before and after adjusting the image ... 28
Figure 3.9 : Temperature Data and Building Number ... 29
Figure 3.10 : High Errored Temperature Prediction Model Loss and Comparison of Real and Predicted Data ... 29
Figure 3.11 : Low Errored Temperature Prediction Model Loss and Comparison of Real and Predicted Data ... 30
Figure 3.12 : Relative Humidty Data and Building Number ... 30
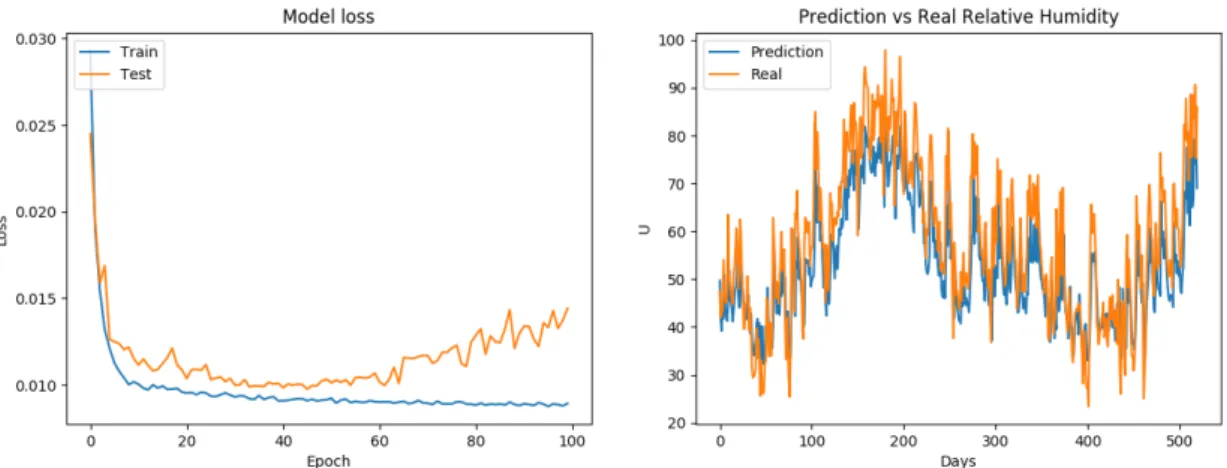
Figure 3.13 : High Errored Relative Humidity Prediction Model Loss and Comparison of Real and Predicted Data ... 31
Figure 3.14 : Low Errored Relative Humidity Prediction Model Loss and Comparison of Real and Predicted Data ... 31
Figure 3.15 : Atmospheric Air Pressure Data and Building Number ... 32
Figure 3.16 : High Errored Atmospheric Air Pressure Prediction Model Loss and Comparison of Real and Predicted Data ... 32
Figure 3.17 : Low Errored Atmospheric Air Pressure Prediction Model Loss and Comparison of Real and Predicted Data ... 32
Figure 3.18 : Dewpoint Temperature Data and Building Number ... 33
Figure 3.19 : High Errored Dewpoint Temperature Prediction Model Loss and Comparison of Real and Predicted Data ... 33
Figure 3.20 : Low Errored Dewpoint Temperature Prediction Model Loss and Comparison of Real and Predicted Data ... 33
Figure 3.21 : Atmospheric Air Pressure Reduced to Sea Level Data and Building Numbers ... 34
Figure 3.22 : High Errored Atmospheric Air Pressure Reduced to Sea Level Prediction Model Loss and Comparison of Real and Predicted Data ... 34
Figure 3.23 : Low Errored Atmospheric Air Pressure Reduced to Sea Level Prediction Model Loss and Comparison of Real and Predicted Data ... 35
xii
Figure 3.24 : Cloud Cover Amount in % Data and Building Number ... 35
Figure 3.25 : High Errored Cloud Cover Amount in % Prediction Model Loss and Comparison of Real and Predicted Data ... 36
Figure 3.26 : Low Errored Cloud Cover Amount in % Prediction Model Loss and Comparison of Real and Predicted Data ... 36
Figure 3.27 : Precipitation Amount in mm Data and Building Numbers ... 37
Figure 3.28 : High Errored Precipitation Amount in mm Prediction Model Loss and Comparison of Real and Predicted Data ... 37
Figure 3.29 : Low Errored Precipitation Amount in mm Prediction Model Loss and Comparison of Real and Predicted Data ... 37
Figure 3.30 : Esenboğa Territory, 2002-4-15 and 2019-3-30 ... 38
Figure 3.31 : Esenboğa Territory 2, 2002-4-15 and 2019-3-30 ... 38
Figure 3.32 : Esenboğa Airport, 2002-4-15 and 2019-3-30 ... 39
Figure 3.33 : Detected Buildings and Weekly Temperature Averages ... 39
Figure 3.34 : Detected Buildings and Weekly Precipitation Amount in mm ... 40
Figure 3.35 : Forecast of Temperature ... 42
Figure 3.36 : Forecast of Humidity ... 42
Figure 3.37 : Forecast of Air Pressure ... 43
Figure 3.38 : Forecast of Precipitation Amount ... 43
Figure 3.39 : Forecast of Dewpoint Temperature ... 44
Figure 3.40 : Forecast of Cloud Amounts in % ... 44
xiii
ABBREVIATIONS
ML : Machine Learning
LSTM : Long Short-Term Memory
RNN : Recurrent Neural Network
AI : Artificial Intelligence
1
1. INTRODUCTION
In the last 70 years, the growing economy and population bring the need for energy that mostly provided by fossil fuels (Dobbins, et al., 2015). The vast usage of fossil fuels brings greenhouse gases that considered the main reason for climate change. Climate change has direct and indirect effects on human beings through effects on health, water scarcity, food security, loss of habitats, deforestation, etc. (Pachauri, 2006). As the impact area broaden, the problem becomes complex as it interests various disciplines as economics, sociology, architecture, engineering, geopolitics. How the natural and built environment will be modified by the climate change and features of the bilateral impacts of them on each other is in serious need of studies. Developing spatial technology platforms and big data offer new approaches to understand, evaluate, monitor, and manage urban areas which leads a changing urban analysis from integrated quantitative and qualitative perspectives (Boeing, 2019). In this sense, machine learning (ML) algorithms offer themselves as a great tool for processing the vast amount of data gathered in various ways and deduce useful information from it. In this study, a machine learning algorithm trial for predicting urban climate, and image process algorithm for identifying built environment have been utilized.
Despite the number of studies for adapting to climate change worldwide, absolute success does not seem to be achievable. Furthermore, with advances in technology, model simulations, satellites, and observations are providing a vast amount of climate data (Faghmous & Kumar, 2014). Neither the human skills nor the computational capacity of contemporary climate science can handle the changing instruments and methods collecting enormous climate data which brings an increasing need for technological tools in studies. On the one hand, technology creates the problem and on the other hand, it provides the necessary tools to solve the problem. Advanced computing methods such as machine learning algorithms, can process the emerged vast amount of climate data and produce meaningful, useful information. In this
2
context, this study offers a projective tool that can enhance the understanding of climate and built environment relation.
1.1 Purpose and Structure of the Thesis
The main objective of the study is to investigate the use and benefits of two functioning machine learning models working with climate data and urbanization separately. For urban research and praxis, information management became an essential component and data-driven modeling and analysis of cities need data analyses as data acquisition and transformation, and processing data to produce useful information (Boeing, 2019). In this sense, long short-term memory recurrent neural network (LSTM-RNN) algorithm - machine learning algorithm for time series problems - is used for climate prediction of the region Esenboğa, Ankara. Machine learning algorithms have a great advantage with respect to traditional simulations since their computational power with big data, ability to capture nonlinear behavior, and learn as new data arrive and can provide significant information for the design process (Hill, O'Connor, & Remus, 1996). The second algorithm was an image process model that uses gabor filters and spatial voting for identifying buildings in satellite images is used to detect the built environment.
Background knowledge on climate, climate change, and its effects on built environment, machine learning are given under the second chapter. Then, the models and data used in this study are introduced and modifications to models and data are described in the third chapter. As a conclusion, results are analyzed, discussions and future works about the study are indicated in the fourth chapter.
1.2 Method of the Study
The purpose of the study is to develop two functioning machine learning models concerning the climate data and urbanization. Two independent algorithms have been examined and adapted to make prediction about future. It is of significance to underline that this study does not look for correlation or causality. The results were considered as a demonstration of possibilities and limitations of machine learning models in architecture and urban studies. The outcomes of the study are motive for further correlational researches. In order to achieve the purpose, proper models, satellite
3
images and climate data have been found as open-source and necessary modifications are done to obtain working models.
The long short-term memory recurrent neural network is used for reading the data and the making the predictions, also gabor filters and spatial voting is used for identifying the features of buildings in order to separate and detect built environment from the satellite images of the Esenboğa region in order to compare the built environment and climate data. The data and the algorithms are taken from open sources due to considerations of accessibility. The climate data which involves temperature, air pressure, precipitation, humidity, cloud cover, etc. are read and reformatted in Matlab to eliminate the incompatibility for the LSTM algorithm. The process of the work is described under the relative titles extensively.
1.3 Limitations of the Study
The major limitation of the study is the lack of correlational analysis of the results due to lack of relevant data that could be used in both algorithms. Another limitation was obtaining the climate data for the Esenboğa region of Ankara which is caused by one of the principals of this study that is using open sources. The climatic data needed in this study must be long term which is a limitation in finding the data. However, the climate of the airport areas is recorded by various companies for many reasons, which became a factor for region selection in this study. Another limitation of the study was formatting and adapting the algorithm and data to each other to achieve a proper model for processing the climate data and obtaining a prediction model. Another limitation was detecting the buildings from satellite images to compare the climate data with built environment to reveal the relationship between urban climate and built environment. The absence of the data related to built environment requires further studies.
5
2. AN INTERDISCIPLINARY APPROACH TO CLIMATE, BUILT ENVIRONMENT AND MACHINE LEARNING
Climate by itself is defined and understand as a system of very complex networks and the studies to discover it is still insufficient. The studies include many disciplines to understand the climate and foresee future impacts on earth. Built environment and climate studies are common and most studied topics recently since the effects of climate change are already seen in urban areas and expected to increase in the future. In addition to that, the increasing population and conducted studies show that the great percent of the population will begin to live in urban areas and urban areas will begin to expand (Haase, Frantzeskaki, & Elmqvist, 2014).
In this context, built environment and climate as a study topic continue to enhance the interest and need. The complex relationship between built environment and climate creates a demand for complex tools to understand it which makes most of the studies interdisciplinary. As technology continues to develop, it offers great opportunities and tools to advance our studies, and as our understanding of the natural and built environment. Machine learning as a recently developing tool presents great opportunities and convenience for researches. ML has proven itself as a useful tool in understanding complex networks, discovering information among big data, and making projections on the future even in the early stages. The climate and built environment studies, the relation and impacts of them on each other is a very complex topic and requires interdisciplinary complex researches.
2.1 Climate
Climate is the outcome of the general circulation of the atmosphere which is affected by the surface and extra-terrestrial events, in other words, climate includes all major components of the natural environment (Atkinson, 1998). Climate has a key role in affecting the structure and functioning of the ecosystem globally and regionally (Sippel, Zscheischler, & Reichstein, 2016).
6
The basic definition of the ecosystem was first mentioned by Sir Arthur Tansley in 1935 as biotic community or assemblage and its associated physical environment in a specific place, in a very simple way, an ecosystem is the sum of both biotic and abiotic components of natural community and their interactions (Pickett & Cadenasso, 2002). This definition states the ecosystem is above all an intellectual construct and both a physical and biological system (Gignoux, Davies, Flint, & Zucker, 2011). Ecosystems' scales can be any size like as small as a patch of soil supporting plants and microbes or as large as the entire biosphere of the Earth, and ecosystem concept is free of narrow assumptions; it is not restricted to equilibrium or complex or stable system (Pickett & Cadenasso, 2002).
There is a pendulum of scientific thought on who controls who between ecosystem and climate. Depending on studies of Hayden (1998), at all scales, the climate controls the ecosystem and the ecosystem controls the climate; there is a bilateral relation between them. Emission of greenhouse gases, albedo, evapotranspiration, long-wave radiation, produced aerosols, and surface roughness are the main processes of the ecosystem that affect climate and cause it to change and also cause the climate to affect the ecosystem in return (Hayden, 1998). These factors generally concentrated on urban ecology which makes understanding the processes and foreseeing future scenarios vital for the future of urban areas.
Urban ecology according to its simple definition is studying the interactions of organisms, built structures, and the physical environment, where people are concentrated (Forman, 2014). Today most people live in urban areas and urbanization seems to continue into the foreseeable future; 75% of the world population is projected to live in cities and their peri-urban surroundings in 2050 according to UN World Population Prospects 2012 (Haase, Frantzeskaki, & Elmqvist, 2014). The population size, spatial extent, a rate of growth, number, and environmental impact of urbanized areas are unprecedented (Forman, 2014). It is clear that the way we understand, use, and connect with natural resources is affected by urbanization in a most profound manner and urban landscape in its diverse manifestations is becoming the most familiar environment to the majority of the human population both currently and in future (Breuste, Elmqvist, Gustenpergen, James, & Mclntyre, 2011). Urban areas' vast populations exert significant effects on the planet, even though they cover a small proportion of the Earth's surface, and the impacts of urbanization on ecosystems
7
remain inadequately understood (Breuste, Elmqvist, Gustenpergen, James, & Mclntyre, 2011). Opposed to general opinion, the effects of urbanization to ecosystem and biodiversity should not be perceived as negative since the variety of human effects diversifies the urban environment by modifying ecosystems, as consequence to this modification, biodiversity in urban areas can be high (Breuste, Elmqvist, Gustenpergen, James, & Mclntyre, 2011). Even more, cities that are designed and developed using sustainability and resilience practices, can support and enhance the capacities of ecosystems in and around cities (Schewenius, McPhearson, & Elmqvist, 2014). Ecologists suggest that “healthy ecosystem is one that is stable and sustainable while maintaining its organization and autonomy over time and its resilience to stress,” and that makes the incorporation of ecological knowledge and principles into the management and creation of cities key tool for developing healthy, livable, sustainable, and resilient urban ecosystems (Forman, 2014). In order to accomplish the developing healthy, livable, sustainable, and resilient urban ecosystems, understanding how urban ecosystem functions, provide goods and services, their transformation and limitations play a critical role (Haase, Frantzeskaki, & Elmqvist, 2014).
The major field of interest in urban ecology studies covers the negative impacts of buildings and paved areas and their revegetation. The relation between built environment and biodiversity, however, might be considered as an evolutionary process. The adaptation or return of biological life to the cities is mainly welcomed with great enthusiasm as a kind of triumph of nature over the tyranny of humankind. It is of importance to investigate the possibilities and opportunities provided by contemporary urban environments. The relations between built environment and biodiversity have been studied extensively. For example, the vertical or horizontal vegetation of hard surfaces of traditional structures, walls, or paves have always been an important topic for researches or the bird population occupying high-rise buildings’ rooftops are on the radar of researchers for long (Lundholm, 2011). Yet, there are still unexplored interactions among the biotic components and new abiotic factors of the urban settlements.
2.2 Climate Change and Built Environment
In the last 70 years, the global economy has grown ten times, one billion people have risen out of extreme poverty, and this growth in economy and population brings the
8
need for energy with itself that mostly provided by fossil fuels (Dobbins, et al., 2015). According to studies, carbon dioxide concentrations have exceeded the safe limit which means the risk of irreversible climate change that can cause a cascade of effects from the individual organism to an ecosystem scale is inevitable (Beier, 2004). The effects of climate change not only direct to human welfare and well-being but also climate change has indirect effects on human beings through effects on health, water scarcity, food security, and loss of habitat and species (Pachauri, 2006). Since the impact area of climate change is broad, the problem moves beyond science and becomes part of the questions of economics, lifestyle, sociology, and local and global geopolitics (Bee, 2007). In nature, all species are elements of complex networks of interactions and several studies have shown that there are universal patterns in the interactions of species (Montoya & Raffaelli, 2010). The way the properties of those networks and the ecosystem are connected and how they will be modified by climate change is still in need of serious studies.
Today, the global mean surface temperature is approximately 1°C warmer and by mid 21st century Earth’s population will be approximately around 9 billion and if humans' reliance on fossil fuels stays at similar levels, concentrations of greenhouse gases in the atmosphere will have potentially significant deleterious effects (Dobbins, et al., 2015). There are many studies for adapting to climate change worldwide, yet absolute success does not seem to be achievable. In the past, research methods for ecosystem services and urban ecology have been roughly scaled, and nowadays the use of analytical tools in this field has increased and a lot of sophisticated software has been developed (Doğa Koruma Merkezi Vakfı, 2017). Furthermore, model simulations, satellites, and observations are providing a vast amount of climate data that is increasing in terms of variety, volume, and velocity (Faghmous & Kumar, 2014). Neither the human skills nor the computational capacity of contemporary climate science can handle the changing instruments and methods collecting enormous climate data.
Urban areas have a multidimensional effect on climate change so understanding their climatology and predicting future scenarios become an essential problem in both urban planning and climate change (Blake, et al., 2011). According to the World Meteorological Organization (1996), urbanization affects the climate in at least two ways; a major source of greenhouse gases and a high amount of land area used (World
9
Meteorological Organization, 1996). The effects of urbanization on climate can be observed more intensively in the local climate of urban areas, where urbanization has changed the land surface characteristics which has changed the term local climate into urban climate. The main effects of urbanization can be sorted as; urban heat island (UHI), urban water balance, urban winds, solar radiation, pollution, land-use planning, natural hazards in cities, energy consumption, and as a result, the greenhouse effect (World Meteorological Organization, 1996). Even though urban areas have the most effective role in climate change, according to While and Whitehead (2013) they are the most vulnerable areas to the effects of climate change (While & Whitehead, 2013). Since the difference of urban climate from rural areas, biological and physical components in and around the urban areas are affected by the urban climate and climate change (Oke, Mills, Christen, & Voogt, 2017). Naturally, urban biodiversity is changing with the changing climate too, where there is a lack of knowledge on the effects of this change in the future.
Based on the facts about the rapid urbanization, a dramatic increase in population, and a decrease in the natural sources, there is a strong need for a new way of thinking and research concerning a new urban ecosystem triggered or facilitated by the abiotic sources and components of built environment. In 2030, the projected population living in urban areas will be %60 of the population and this urban growth combined with global climate change will make cities more vulnerable to urban environmental problems such as extreme weather and climate conditions, poor air quality, etc. (Chen, et al., 2012). As an outcome of the rapid growth of urban areas, urban systems will become an important factor in human climate interactions. Predicting future risks and defining mitigation strategies by understanding the regional climate affected by cities becomes a fundamental problem, however, there is still a lack of knowledge that exists in the role of climates on cities and cities on climate (Alexander, 2016). Altered interactions between biotic and abiotic factors due to new habits or evolution of living organisms in urbanized areas should be examined with considering the new and old construction materials and techniques. Deterioration, aging, or reactions of those new materials should be investigated in relation to the climate change since these factors have direct and indirect impacts on climate (Oke, Mills, Christen, & Voogt, 2017). If required data about building environment is provided, projections and predictions
10
about built environment can be achieved by a machine learning algorithm with precision.
As stated in Helmut’s book (1981), cities have grown into vast conurbations where the future of their effects on the local atmosphere plays an important role in climate (Landsberg, 1981). Cities have a multidimensional effect on climate change especially with the urban heat island effect, in other words, the ecological phenomenon of the 21st century is defined by cities (While & Whitehead, 2013). As stated by Popescu and Luca (2017), developed cities have higher temperatures than surrounding rural areas, and changing climate can have various causes and factors such as built environment, a large amount of construction materials, concentrated sunlight, etc. (Popescu & Luca, 2017). From a general perspective, urban areas have two features that affect the atmosphere: urban form and urban function (Oke, Mills, Christen, & Voogt, 2017). The urban form has three main features that affect the atmosphere as fabric – determines radiative, thermal, and moisture properties of the surface, surface cover – relevant to the partitioning of heat, and urban structure – determines albedo and aerodynamic roughness and also controls radiative exchange and airflow (Oke, Mills, Christen, & Voogt, 2017). As a result, there is a growing interest in anticipating climate change in the science of urban climatology and its intersection with urban form and design (Corburn, 2009). Today it is known that urban and suburban settlements will face more frequent and intense climate extremes where forecast predictability can help cities prepare for those extremes since making projections for climate change is a fundamental step for developing strategies (Blake, et al., 2011). It is important to understand the climatic processes of areas before designing especially with the importance of climate change, in this sense, systems of monitoring and predictions provide important information for planning and designing (Coseo, 2013). By gaining information and data on climate, climate change trends can be documented and can give us an opportunity to design accordingly. It is clear that the future is uncertain, however, predictions of future change and scenarios reduce the range of possibilities and allow to plan long-term management more strategically (Brimblecombe & Grossi, 2017). In reference to Oke, Mills, Christen, & Voogt, the population concentration in urban areas has two phases, one is complete majorly and other is still happening where information related to urban forms and functions as a result of the first phase are limited, and knowledge about cities emerging in the second phase can be considered
11
elemental (Oke, Mills, Christen, & Voogt, 2017). The knowledge acquired about urban climates should be applied to the design of new cities and the reconstruction of old ones in order to eliminate the deleterious climatic changes caused by urban areas (Landsberg, 1981).
2.3 Machine Learning
Learning is a wide range of process that is difficult to define (Nilsson, 1998). Machines are not intelligent by nature however, machine learning enables machines to perform skillfully by using intelligent software (Mohammed, Khan, & Bashier, 2017). Machine Learning is a statistical method considered as an alternative to a physical model of Earth Systems and the term machine learning means automated detection of meaningful patterns in data (Shalev-Shwartz & Ben-David, 2014). The history of AI and machine learning has started when first neural network model represented as the electrical circuit is introduced by neurophysiologist Waren McCulloch and mathematician Walter Pits in 1943, then in 1950, Alan Turing presented B-type neural networks and concept of a test of intelligence which is called Turing Test that for a computer to pass, it has to convince a human that it is a human, not a computer (Mohammed, Khan, & Bashier, 2017). In 1958, psychologist Frank Rosenblatt designed the first artificial neural network called Perceptron which was constructed based on biological principles and showed an ability to learn in pattern and shape recognition (Mayo, Punchihewa, Emile, & Morrison, 2018). Even though the success of studies on machine learning there was not much of progress until the late 1970s since the relative complexity of neural networks and the high expenses on researches, however, there was a growth in the research of knowledge-based systems in the period of 1969 to 1979 (Mohammed, Khan, & Bashier, 2017).
The topic started to gain interest in the 1980s with developments in the discipline and in the 1990s, IBM developed the computer ‘Deep Blue’ which was a chess-playing computer that beat the world chess champion in 1997 (Mayo, Punchihewa, Emile, & Morrison, 2018). Today many businesses have realized that machine learning will increase the calculation potential and started to invest in the topic. Computer vision, hearing, natural languages processing, image processing, and pattern recognition, cognitive computing, knowledge representation, etc. constitute the main focus area of the current researches which aim to provide the ability to gather data through sensors
12
and then processing the gathered data by using computational intelligence tools ad machine learning methods to conduct predictions and making decisions at the same level as humans (Mohammed, Khan, & Bashier, 2017).
Machine learning is a branch of computer science that deals with automated recognition of patterns from data and algorithms can be divided into four categories roughly: supervised, unsupervised, reinforcement learning, and neural networks and deep learning (Feng, Segond, Vasile, & Goz, 2016). A variety of algorithms are used to learn from data to improve the performance of the machine and as those algorithms absorb data, producing more precise models becomes possible (Hurwitz & Kirsch, 2018). The need for machine learning is approached from two aspects, the problem’s complexity and the need for adaptivity (Shalev-Shwartz & Ben-David, 2014). Nilsson stated in his book that whenever a machine changes its structure, program, or data in order to improve its future performance, it learns which is a similar process to ones in animals and humans which makes learning in machines important for understanding how animals and humans learn (Nilsson, 1998). A machine learning model is the output generated when the algorithm is trained with data then when input is provided, the model generates an output based on the data that trained the model (Hurwitz & Kirsch, 2018). With machine learning models, internal structures of machines can be adjusted to produce correct outputs for a vast amount of sample inputs to constrain input/output fraction to reveal the relationship in the samples, the hidden relations, and correlations among the large data can be extracted, a large amount of knowledge about certain tasks can be able to be captured, the need for constant redesign due to changing environments can be reduced and new knowledge about tasks can be tracked easily (Nilsson, 1998).
There is various type of machine learning algorithms such as regression, classification, clustering, non-clustering, neural networks, etc. today with respect to specifications of problems, yet in this study, a specific type of a neural network which is long short-term memory recurrent neural network and ai are considered.
13
2.3.1 Neural Networks
Figure 2.1 : Example of One Node of Neural Network (Nicholson, 2019).
Networks of non-linear elements have an important role in machine learning’s development. The brain is a dynamic information processing system that evolves its structure and functionality in time through information processing at different levels which makes it efficient to build computational models that integrate principles from different information levels like in the brain for solving complex problems (Du & Swamy, 2013). These networks which are interconnected through adjustable weights are called neural networks and function very similar to biological neurons (Nilsson, 1998). In other words, neural networks are considered as simplified models of neural processing in the brain. Neural networks composed of several layers that made of nodes that combine the input from data with a set of coefficients that either amplify or reduce that input with respect to the task that algorithm tries to learn (Nicholson, 2019). Neural networks have emerged as an alternative paradigm for computation; the instructions can be distributed amongst the different computing units which make easier to solve problems too difficult to solve by conventional mathematical models (Chakrabarti, 1995).
14
The operation of neural networks is divided into two stages as learning which is also called training, and generalization which is also called recalling (Du & Swamy, 2013). A neural network consists of three or more layers as, input layer that ingest the data, one or many hidden layers where data is modified, and the output layer based on the weights applied to these nodes (Hurwitz & Kirsch, 2018). When the training process is done, the network can be used to operate in a static manner, emulation of unknown dynamics, or nonlinear relationships (Du & Swamy, 2013). The learning procedure of a neural network can be considered as a nonlinear optimization problem for finding a set of network parameters that minimize the cost function for given examples. However, in neural networks, the solution way is not given to the computer, instead, it learns from observational data to figure out a solution to the problem (Nielsen, 2015). Neural networks are occurred as a strong alternative to traditional statistical forecasting methods because of the computational power with big data, capturing nonlinear behavior, learning as new data arrive and etc. (Hill, O'Connor, & Remus, 1996). Since they can generate non-linear mappings during training the data, neural networks are convenient for real-life problems such as understanding the climate (Ustaoglu, Karaca, & Cigizoglu, 2008). Generating a 14-day weather forecast can easily take 12 hours even on fast computers where using large data with machine learning algorithms can compensate for lack of complex models and can give usable forecast with less time (Abrahamsen, Brastein, & Lie, 2018).
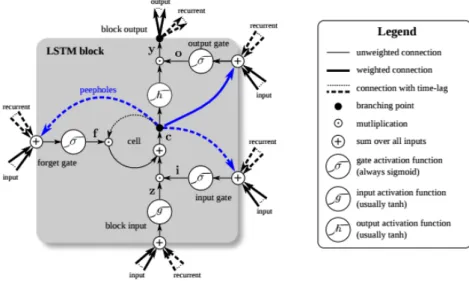
2.3.2 Long Short-Term Memory (LSTM) Recurrent Neural Networks
15
The recurrent neural network was first developed in the 1980s with a chain-like structure of repeating modules as a memory to store information from previous processing steps (Le, Ho, Lee, & Jung, 2019). Recurrent neural networks have at least one feedback connection which makes network size to be compact compared to feedforward networks (Du & Swamy, 2013). The feedback connections enable the network to do temporal processing and learn sequences, e.g., perform sequence recognition or reproduction or temporal association or prediction. The feedback connections can be used by recurrent neural networks to store representations of recent input events in the form of activations which is a form of memory (Hochreiter & Schmidhuber, 1997). Recurrent neural networks (RNN) are powerful computational models capable of instantiating almost arbitrary dynamics (Gers, 2001).
LSTM is a specific recurrent neural network algorithm to model temporal sequences and their long-range dependencies more accurately than conventional neural networks (Sak, Senior, & Beaufays, 2014). LSTM as an evolution of RNN is capable of learning long-term dependencies and remembering information for extensive periods of time (Le, Ho, Lee, & Jung, 2019). LSTM contains memory blocks in the recurrent hidden layer in addition to RNNs and these memory blocks contain memory with self-connections storing the temporal state of the network with Gates to control the flow of the information (Sak, Senior, & Beaufays, 2014). LSTMs preserve the error that can be backpropagated through time and layers for allowing the network to learn over many time steps (Nicholson, 2019). These additional features provide great computational power and make the model remember past data and make LSTM well-suited to classify, process, and predict time series.
2.3.3 Artificial Intelligence (AI) and Architecture
Technology has always directed the design parameters in history and will continue to do so. The digital revolution as improvements in computational power not only digitized the processes also rationalized them, by means of this, understanding the performance of space and place became much easier, and now machine learning offers appositeness, timeliness, scalability of solutions and new ways to study urbanization, speed of change, climate and population growth (Simondetti, Luebkeman, & Uerz, 2017). Computing is one of the most important developments for professions including architecture hence, it becomes essential to study the implications of computing for
16
architecture and examine whether there are new ways of thinking about architecture, space, and form of built environment (Reffat, 2008). Self-learning algorithms can compute a great amount of data in a short period and can learn from the data to create new knowledge. Artificial intelligence and machine learning algorithms are bringing methods to unresolved challenges in almost every field and with such potential, this technology can reshape the architectural discipline (Chaillou, 2019). As stated in Cross’s study (2001), computational models of design activity have the potential of being descriptive models of human design behavior and attempts so far to create computational models have provided paradigms for understanding creative design activity (Cross, 2001). According to Negroponte (1969), machine-assisted architecture has two general concerns; large scale problems since their complexity and small-scale problems which are ignored by the architects (Negroponte, 1969). Researchers are developing various computer programs with great computing power to free designers to eliminate the mentioned problems. As stated in Dorst’s study, a designer needs to construct a design that transcends or connects the different discourses in a general sense or in the concrete instance of the design to be developed (Dorst, 2006). Development in AI can enable designers to make artworks with human-like sensibilities such as interacting with viewers in ways considered intelligent and learning by experiencing (Wilson, 1983). The many attributes of design cognition that are regarded as essential features of design have been identified as a result of attempts to simulate design activity in AI (Cross, 2001). In other words, the design process of a machine is very related to the design process of humans.
Architecture has been understood as a basis for the relationship between the material world and their construction and the mathematics of the cosmos from the beginning of architectural theory (Hays, 2005). Today, most of the revolutionary works would be unthinkable without computers and their advantages. According to Tamke, et al. (2018), architecture is in a change of paradigm from architectural representations of unbound data to practices with a great amount of information data including urban, climate or 3D scanning data, whether the data is generated within the project, obtained by simulations or coming through sensors, in any case, the information-rich data expands the architectural models by including more phases of design, creating new scales of design concern and bringing more information from various disciplines (Tamke, Nicholas, & Zwierzycki, 2018). This new situation forces architects to work
17
in collaboration with other disciplines to find new methods to process the data to find meaningful information for a design where the machine learning concept has a great potential to achieve. Machine learning algorithms can change the design paradigms by processing the overwhelming amount of data and create information to be used in the design process. As stated by Thomsen (2016), building culture enters a rethinking era, and developing fundamental infrastructures for unknown practices should be preferred to common standards for known practices (Thomsen, 2016).
2.4 A Projective Tool for the Climate Change Impacts on Built Environment
Today machine learning is recognized as a powerful tool and many fields have begun seeking input from it (Rolnick, et al., 2019). In climate researches, machine learning is used for various objectives as making predictions, reading big data, discovering dependencies in data provided, replacing of components of large climate models with machine learning models with lower computational cost and the variety of the objects of the machine learning and its models with variant functions make the ML useful tool for understanding the complex system as climate. Machine learning can enable monitoring the gathering data of built environments, deforestation, carbon emission, energy consumption, and related topics by remote sensing and it can contribute to scientific discoveries about climate change and relation to the built environment (Rolnick, et al., 2019). Machine learning is a tool that enables other tools across various fields and can lead to interdisciplinary methodological innovations in the climate and built environment studies. The information about the correlation of climate and built environment that can be gathered from machine learning models can be crucial in urban planning, ecology, architectural researches and with such projective tools, a basis can be effectuated for future researches in the future.
In this study, LSTM neural network model is used for climate prediction. The LSTM model is selected in this study to predict the climate parameters since the model’s computational power with large data and its ability to cope with the correlation within time series which is a series of data points indexed in time order. The model is selected amongst open-source models for predicting stock price and reformatted to fit for
climate prediction from the website Github
(https://github.com/DarkKnight1991/Stock-Price-Prediction). Adaptations towards to working model for climate are done on both climate data and model.
18
Another advantage of the model is that it is open to development and to the integration with other models. In this study, simple predictions based on every climate parameter’s own historical data in the selected region of an urban area are done and results have shown the success of the model.
19
3. MODELS AND METHOD
“All models are wrong, but some are useful.”
George Box (Knutti, 2019). There are many different types of climate models according to their complexity from zero-dimensional models to very complex models which can be run by only a few supercomputers therefore which type one should use and what parameters must be driven depends on what is wanted to be learned, and thus the scale and prioritization of model should be based on the question of interest (Snyder, Mastrandrea, & Schneider, 2011). Besides this, since the complex models require too much computational power, on long time periods or with a large number of experiments, using simple and fast models is necessary, yet more designing a model with important properties to meet the requirements of the question of interest can be more elucidative (Goosse, Barriat, Lefebvre, Loutre, & Zunz, 2015). Climate models have a scale of 10 km to 50 km generally, however, to get more specific knowledge about climate events, the scale of a few kilometers is needed, yet smaller scales mean larger computing powers (Knutti, 2019). To develop useful predictions from computationally feasible and more accurate models, the big climate data needs to be condensed into coherent, computationally operationalizable modes (Rolnick et al., 2019). Machine Learning models are likely to be more operational and less expensive to work with.
Climate is simply the description of the long-term pattern of weather in a specific area also it is defined as average weather for a specific region and time period (Atkinson, 1998). Yet this basic definition is not capable of highlighting the complexity of the climate. Climate is the outcome of the general circulation of the atmosphere which is affected by the surface and extra-terrestrial events where we can say that climate includes all major components of the natural environment (Atkinson, 1998). The scientists look at averages of precipitation, temperature, humidity, sunshine, wind, fog, frost, and such phenomena that occur over a long period to understand the climate (Gutro, 2005). The Earth's climate changes in response to natural and anthropogenic
20
drivers, so the past and the future of the earth’s climate becomes unstable (Hayhoe, et al., 2017). This instability in Earth’s climate makes it infeasible to derive what can happen in the future based on just the observation of the past, and the only tools- can tell what may happen in the future- that science has in its hands are climate models (Jancovici, 2007). A climate model can be defined as mathematical equations based on physical, chemical, and biological principles to replicate the climate system (Goosse, Barriat, Lefebvre, Loutre, & Zunz, 2015). These numerical solutions can support observed climate data by reanalyzing and showing how climate responds to different forces such as solar radiation, greenhouse effects, and so on (Abiodun & Adedoyin, 2016). The climate models are necessary for an understanding of the climate system process properly and for identifying the effects of human influences on climate change (Carson, 1996). The ideal climate model should involve all processes known to have climatological consideration and should include spatial and temporal details to model phenomena that occur over small regions and short time periods, in other words, models should include all the relevant scales of processes and interactions within the climate system, including the various subsystems, their nonlinear behavior and their connections throughout the whole system, yet even today’s best models still require compromises and approximations due to computational complexity and lack of knowledge on many small-scale processes and they drive large-scale processes (Snyder, Mastrandrea, & Schneider, 2011). Generally, each component of the climate model can be run separately or coupled to other components, the most preferred versions are coupled climate models (Gettelman & Rood, 2016).
All climate models are basically an attempt to represent the processes that produce climate and to understand the functioning of the climate system. The most important objective of climate models is predicting the effects of changes and interactions in the climate system (McGuffie & Henderson-Sellers, 2005).
3.1 Models Used in the Study 3.1.1 LSTM Neural Network Model
The open-source code for LSTM neural network which is originally modeled for predicting stock price for companies is accessed from the open-source website Github (Nayak, Stock-Price-Prediction, 2019). Also, the image process model for identifying
21
the features of buildings in order to detect the built environment from satellite images is acquired from the open-source website Matlab (Sirmacek, File Exchange, 2018). The working principle of the algorithm is analyzed and reformatted with respect to the climate data obtained from the company Raspisaniye Pogodi Ltd., St. Petersburg, Russia. Data is divided into two sets: train and test sets. The training set contains 80% of the data and the test set contains the rest 20%. After dividing the data into two sets, the LSTM model is created for the simulation and trained to get outputs. Model trains the data in training set for finding a pattern within to make a prediction. After finding the pattern, the model tries to predict the test set and compare the actual value with the predicted value; the difference between the real value and predicted value gives the model error. The lesser the model error, the more accurate predictions it makes.
3.1.2 Image Process for Building Detection Model
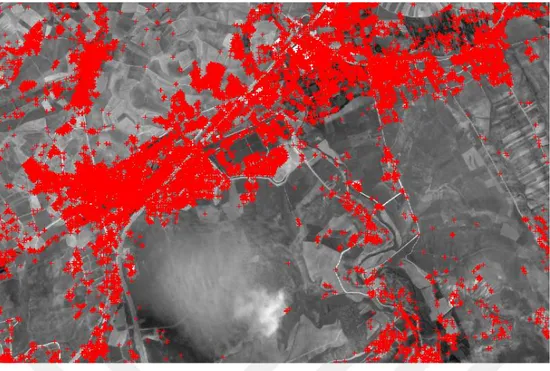
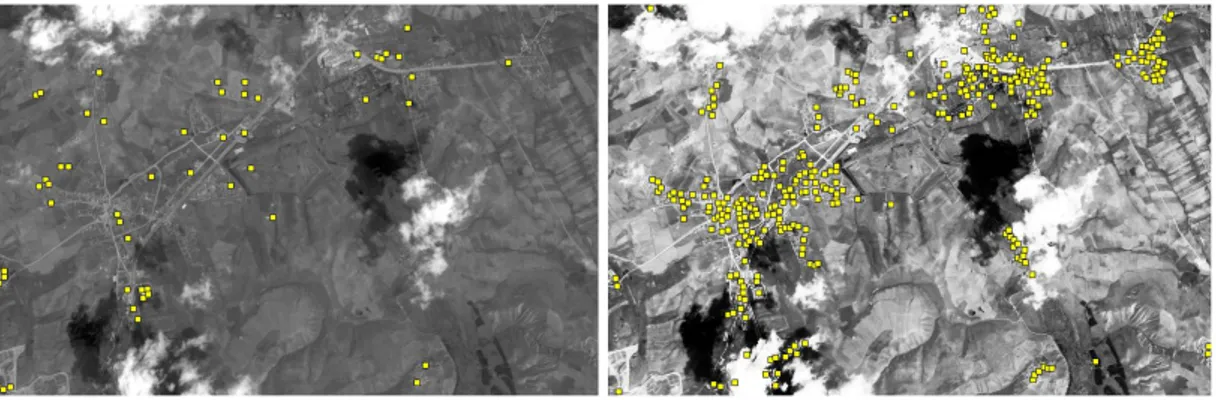
The image process model is also studied and reformatted with respect to used satellite images in this project. The model uses gabor features and spatial voting in order to identify the features of the built environment for detecting the buildings from satellite images. Gabor features extract local pieces of information in order to combine them to recognize an object or region of interest (Kamarainen, 2012). After extracting the local features and their descriptor vectors which are mathematical representations of the features, the model uses them to generate a voting matrix such that each descriptor votes to possible building locations and its certain proximity (Sirmacek & Unsalan, 2009). The building locations are identified by maximum votes in the voting matrix. In figure 3.1, the results of the gabor filtering applied to satellite image can be seen, after extracting the gabor features of the image, with spatial voting the buildings in the image are identified among the gabor features as in figure 3.2.
22
Figure 3.1 : Gabor features of the satellite image of Esenboğa region.
23
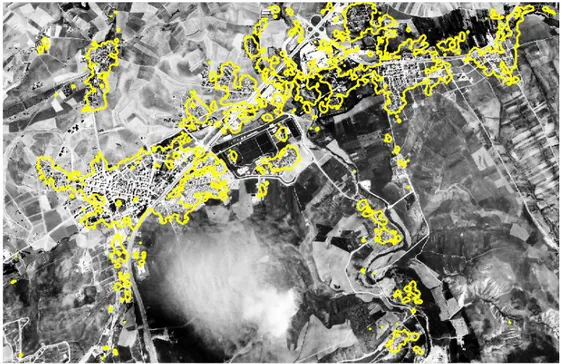
Figure 3.3 : Built environment detected from satellite image of Esenboğa region.
The built environment in the image is identified through the detected buildings by spatial voting as in figure 3.3 and the boundaries of the built environment are shown on the satellite image.
3.2 Data Used in the Study
The climate data for Esenboğa, Ankara is founded by the company Raspisaniye Pogodi Ltd., St. Petersburg, Russia. The company has a license for activity in hydrometeorology and adjacent fields (Raspisaniye Pogodi Ltd., 2004). Location is selected according to available data for the maximum time interval possible. Since Esenboğa, Ankara contains the airport of the city, available data is much more than other regions of the city. The daily climate data of Esenboğa, Ankara for the years 2005 to 2019 is obtained from the website of the company,
https://rp5.ru/Weather_in_the_world. The data contains; • minimum, maximum and average temperatures, • atmospheric pressure at weather station level, • atmospheric pressure reduced to mean sea level, • pressure tendency,
• relative humidity, • mean wind direction,
24
• mean wind speed at a height of 10-12 meters above the surface, • maximum gust value at a height of 10-12 meters above the surface, • total cloud cover,
• clouds of genera Stratocumulus, Stratus, Cumulus, Cumulonimbus, • amount of all the clouds present,
• height of base of the lowest cloud,
• clouds of the genera Altocumulus, Altostratus, Nimbostratus, • clouds of the genera Cirrus, Cirrocumulus, Cirrostratus, • horizontal visibility,
• dewpoint temperature at a height of 2 meters, • amount of precipitation,
• the period of time during which the specified amount of precipitation was accumulated
• state of the ground without snow or measurable ice cover, • the minimum soil surface temperature at night.
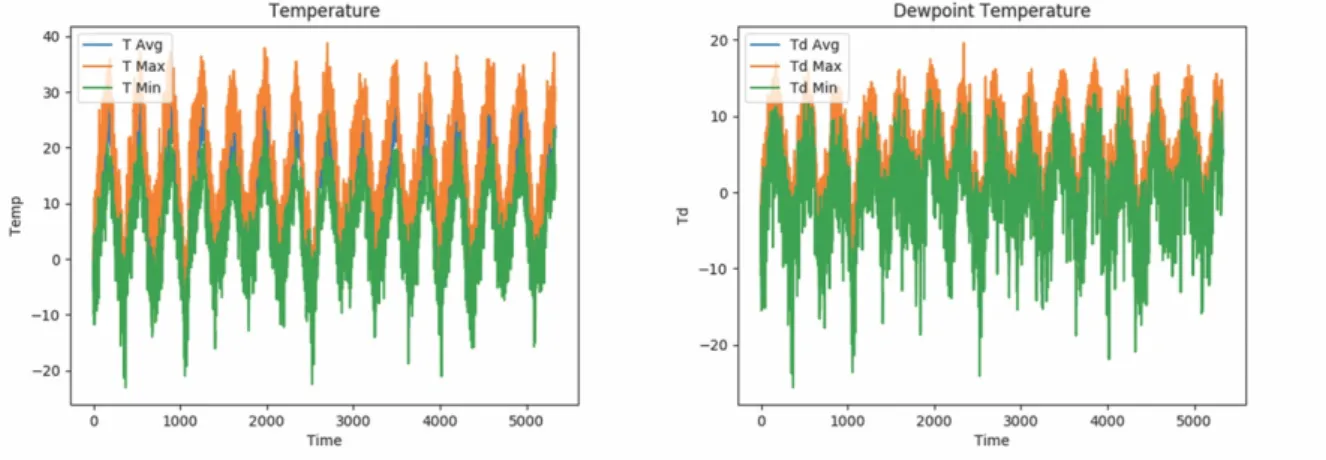
Some of the climate data have no continuity between the years 2005 and 2019, so the simulation for those parameters has not been run since the output could not be accurate. Data used for the simulation are temperatures, atmospheric pressure at weather station level, atmospheric pressure reduced to mean sea level, relative humidity, horizontal visibility, dewpoint temperature, amount of precipitation, amount of all the cloud presents.Data graphics of the concerned climate parameters are given below:
25
The graphs are showing the maximum, minimum, and average value of daily temperature and dewpoint temperature. A pattern can be seen roughly on the data yet the small changes due to climate change cannot be seen by the eye.
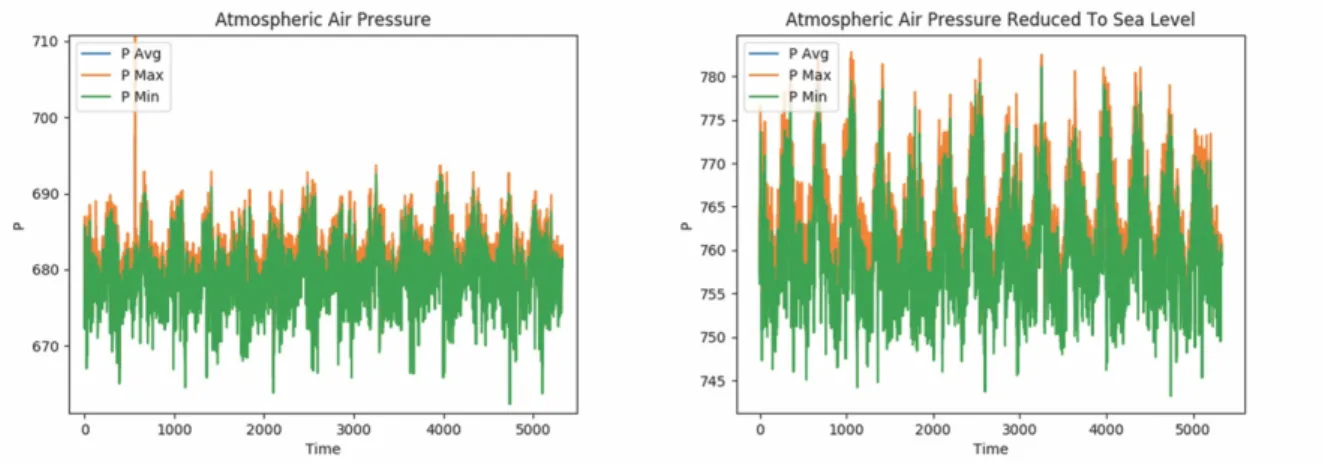
Figure 3.5 : Atmospheric Air Pressure and Atmospheric Air Pressure Reduced to Sea Level Data.
The graphs are showing the maximum, minimum, and average value of daily atmospheric air pressure and atmospheric air pressure reduced to sea level. In those data, a pattern as seen in temperature data cannot be seen easily which makes it hard to analyze the data by hand.
Figure 3.6 : Relative Humidity and Precipitation Amount Data.
The graphs are showing the maximum, minimum, and average values of daily relative humidity and precipitation amount. In these data, a pattern can be seen in relative humidity yet in precipitation amount, it can be said that there is no pattern.
26
Figure 3.7 : Cloud Cover and Vertical Visibility Data.
The graphs are showing the maximum, minimum, and average values of daily cloud amount and the vertical visibility distance. Data of both parameters have no pattern as can be seen in graphs which makes it hard to analyze the data by conventional methods.
3.3 Formation and Adaptation Method
The model and the data were not able to be used together in the first place. To remove this incompatibility, some modifications are applied to both of them. Even so, there were still some errors in the results such as overfitting and underfitting. After compatibility problem was solved, modifications to the algorithm were considered to increase the accuracy of the results while avoiding overfitting.
Matlab is used for formatting the climate data in order to determine the maximum, minimum, and average values for climate parameters and saved as text files as an input to the machine learning algorithm. The algorithm is revised in order to work with climate data by testing the algorithm each turn to check the consistency of output and the test set.
3.3.1 Formation and Adaptation of Data Used
All of the data is read and reformatted in Matlab to get them into a proper format for simulation. Data were taken every 3 hours every day which makes 8 measurements for every day, therefore, in Matlab, the minimum, maximum, and average measurements of every climate parameter for every day are calculated. Initially, there were 43,528 data at total and after reformatting the data as explained before, there were 5,441 data of every climate input for the simulation from 02.02.2005 to 27.08.2019. After
27
formatting the data, it is read and analyzed by plotting from the algorithm and checked if there are any null values to interrupt the simulation.
The data is divided into the train set and the test set for checking the algorithm’s accuracy. The data is normalized by MinMaxScaler from Sci-kit Learn which is a module in python for machine learning. Normalization helps the algorithm in converging to find local/global minimum efficiently. Then data is converted into time-series and supervised learning problems and divided into two sets; train set and test set. The train set is used for finding the pattern within the data and the test set is used for validating the found pattern. The prediction for all parameters is done with respect to their daily minimum, maximum, average values, and the building number of the region. This makes the model as simple as possible since no other dependencies involved in computing. Also, real-life data contains the dependencies in itself already just like temperature changes are the result of parameters it depends on. In other words, each climate parameter consists of other parameters, since the climate is a form of complex networks of interactions. This means, the historical data of each parameter actually contains the dependencies to other parameters and as the algorithm trains the data and find a pattern within it, it actually trains the dependencies too. In addition to that, building number is given as input to the algorithm besides the historical data of climatic parameter.
3.3.2 Formation and Adaptation of Algorithms Used
3.3.2.1 Formation and Adaptation of LSTM Neural Network for Climate Prediction
After formation, climate data is used in the model to modify the algorithm’s parameters. These parameters are batch size, epoch number, timesteps, the dropout rate of the model. The adaptation of parameters is obtained by trying the model with various values for getting the minimum error value. The batch size of the train data, timesteps of the algorithm, epoch number, and the dropout rate is rearranged for the climate prediction. Batch size is the number of samples the neural network sees before it updates internal model parameters, timesteps is the number of units back in time the network sees, epoch defines the number that the model will run across the entire training dataset and dropout is a regularization method during training a network where
28
input and recurrent connections to model units are probabilistically removed to reduce overfitting.
Adjusting those parameters allows us to modify the network’ s compatibility with the climate data. As can be seen on the graphs provided, before adjusting the network’s parameters, the results had high error value and predictions of test set were not accurate. After adjusting the network’s parameters to work suitable with climate data, the error value of the model has decreased, and the predictions of test sets became accurate.
3.3.2.2 Formation and Adaptation of Image Process for Building Detection
In the image process algorithm, the great changes and adjustments are not needed in order to obtain accurate results since the algorithm was already created for identifying the built environment from satellite images. The satellite images of the region Esenboğa are obtained from software program Google Earth with respect to years and then inserted into the image process algorithm to adjust the filter coefficients properly. The algorithm is working with 88.17% accuracy in satellite images in identifying buildings (Sirmacek & Unsalan, 2009). The coefficients of the gabor filter of the algorithm for extracting the gabor features are adjusted with respect to satellite image properties such as if the image is bright, dark, cloudy, etc. in order to obtain the best accuracy in obtaining the buildings.
Figure 3.8 : Detected buildings from satellite image of Esenboğa region in cloudy day before and after adjusting the image.
As can be seen in figure 3.8, adjusting the image properties and filter coefficients of the algorithm enhances the identifying buildings form the satellite image greatly. The obtained building numbers are given as input to the climate prediction algorithm in order to train the climate data with respect to the built environment. Since there are
29
not enough satellite images as climate data, the changes in building numbers between the years that satellite images taken are distributed linearly.
3.4 Results
3.4.1 Results of Climate Prediction Model
The high errored results and adopted low errored, more accurate results are given below to show that the model’s success at predicting the climate measurements. As can be seen on result graphics, training of the model has been succeeded.
Figure 3.9 : Temperature Data and Building Number.
Figure 3.10 : High Errored Temperature Prediction Model Loss and Comparison of Real and Predicted Data.
30
Figure 3.11 : Low Errored Temperature Prediction Model Loss and Comparison of Real and Predicted Data.
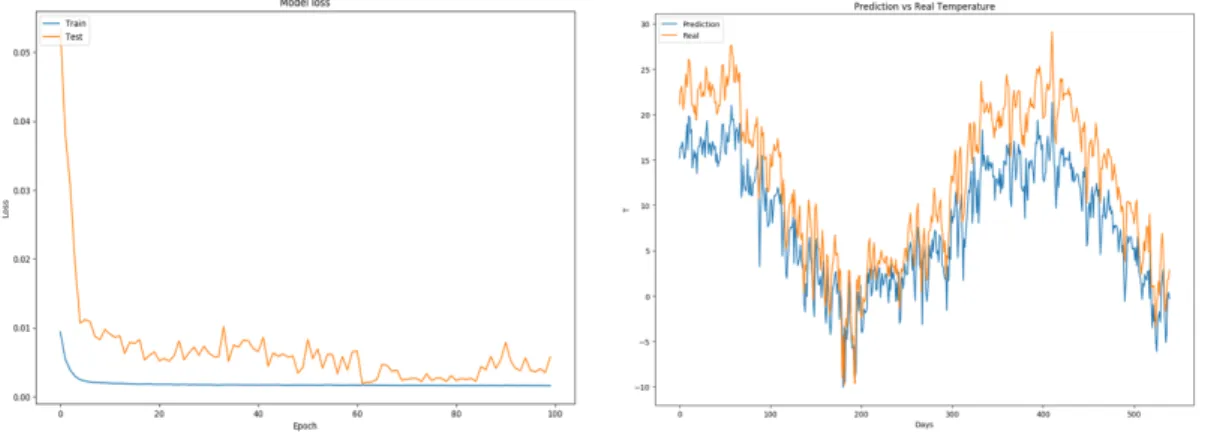
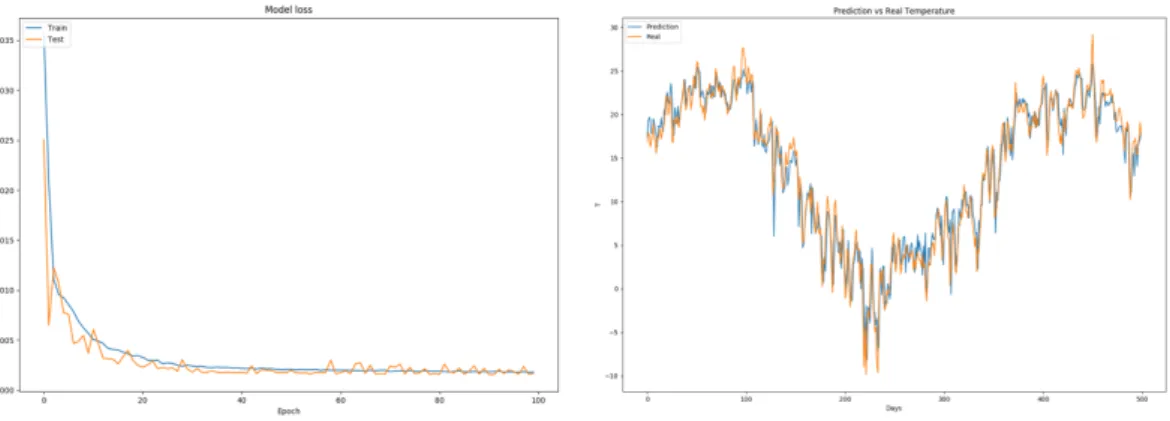
As can be seen in the first set of graphs, there is a high model loss while training the data which resulted in unsuccessful prediction. The model loss was 0.008234 which is relatively high and resulted in predicting lower values than real data. After adopting the algorithm to predict more precisely, the model loss has decreased to 0.001474 and the effect of the adaptation can be seen on the second set of graphs. The prediction of the test set has improved, and accuracy has increased.
31
Figure 3.13 : High Errored Relative Humidity Prediction Model Loss and Comparison of Real and Predicted Data.
Figure 3.14 : Low Errored Relative Humidity Prediction Model Loss and Comparison of Real and Predicted Data.
As can be seen in the first set of graphs, there is a high model loss while training the data which resulted in relatively unsuccessful prediction. The model loss was 0.0119876 which is high and resulted in a noisy prediction. After adopting the algorithm, the model loss has decreased to 0.0077957 which can be high for temperature data yet low for relative humidity and the effect of the adaptation can be seen on the second set of graphs. The prediction of the test set has improved, and accuracy has increased.
32
Figure 3.15 : Atmospheric Air Pressure Data and Building Number.
Figure 3.16 : High Errored Atmospheric Air Pressure Prediction Model Loss and Comparison of Real and Predicted Data.
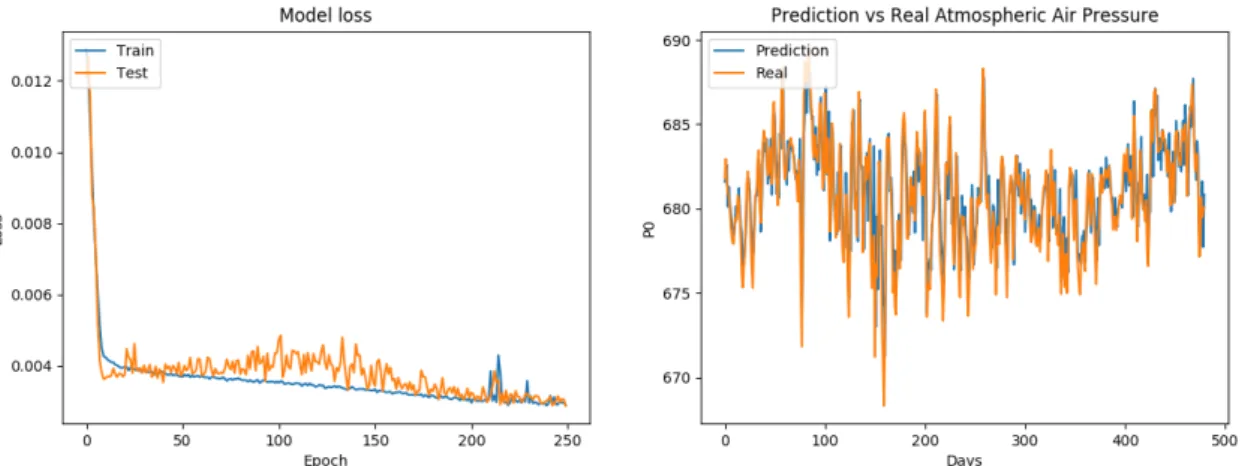
Figure 3.17 : Low Errored Atmospheric Air Pressure Prediction Model Loss and Comparison of Real and Predicted Data.
As can be seen in the first set of graphs, there is a high model loss while training the data which resulted in underfitting prediction. The model loss was 0.0048609 which is relatively high and resulted in predicting in smaller range than real data. After