THE LONG AND SHORT RUN EFFECTS BETWEEN
UNEMPLOYMENT AND ECONOMIC GROWTH IN EUROPE
AVRUPA’DA İŞSİZLİK VE İKTİSADİ BÜYÜME ARASINDA UZUN VE KISA DÖNEMLİ ETKİLER*
Ferda Yerdelen TATOGLU
İstanbul Ünivesitesi İktisat Fakültesi Ekonometri Bölümü [email protected]
ABSTRACT: In this paper, the movement of unemployment rate and the long and short term relationships between unemployment rate and economic growth rate are examined for individuals and pooled cases in European countries over the period 1977-2008. Several panel techniques are used for non-stationary panels and thereby some evidence are found for unemployment hysteresis in all European Countries. The Okun’s coefficients are also estimated. The results show that the validity of Okun’s Law and the significance of the relationship between economic growth rate and unemployment rate vary between countries.
Keywords: Hysteresis; Okun’s Law; Panel Unit Root; Panel Cointegration, Panel Error Correction Model
JEL Classifications: C01; C23; E24; O47
ÖZET: Bu çalışmada, 1977-2008 yılları arasında Avrupa ülkelerinde işsizlikteki hareketler ile işsizlik oranı ve iktisadi büyüme arasındaki kısa ve uzun dönemli ilişkiler ülkeler bazında ve tüm panelde incelenmiştir. Durağan olmayan panellere ilişkin çeşitli teknikler kullanılmış ve tüm Avrupa Ülkelerinde işsizlik histerisine ait bazı deliller bulunmuştur. Okun katsayısı da hesaplanmıştır. Sonuçlar, Okun Kanununun ve işsizlikle büyüme arasındaki ilişkinin anlamlılığının ülkeden ülkeye farlılıklar gösterdiğini göstermektedir.
Anahtar Kelimeler: Histeri; Okun Kanunu; Panel Birim Kök; Panel Koentegrasyon; Panel Hata Düzeltme Modeli
1. Introduction
The issue of unemployment is clearly one of the most important problems of the world, so it covers an important area in macroeconomic and econometric research. Macroeconomists have tried to explain the hysteresis in unemployment, the cause of unemployment and the relationship between unemployment and some macroeconomic variables such as inflation, growth etc. These subjects play a very important role in macroeconomic building and provide some significant knowledge for macroeconomic policy; furthermore the knowledge of the relationship between unemployment and growth is regarded as a benchmark for policy makers to measure the cost of higher unemployment.
* Bu çalışma, İstanbul Üniversitesi Bilimsel Araştırma Projeleri Birimi tarafından (proje
numarası: 560/14082006) ve University of Leicester Department of Economis tarafından desteklenmiştir.
There are two main alternative hypotheses about the movements in unemployment: the natural rate hypothesis (NAIRU) and the hysteresis hypothesis. According to the natural rate hypothesis, deviations in unemployment from the natural rate should be temporary; on the other hand, the unemployment hysteresis hypothesis argues that cyclical fluctuations will have permanent effect on the level of unemployment rate due to labour market rigidities. The unit root test provides a convenient methodological framework to empirically investigate this hypothesis; hysteresis is consistent with non-stationary unemployment rates. In theoretical and empirical literature, several works have attempted to test the presence of hysteresis in unemployment using time series data and panel data. The basic studies related to hysteresis applied by Blanchard and Summers (1986) and Mitchell (1993). Apart from hysteresis, economists have been aware of an inverse relationship between movements of unemployment rate and Gross Domestic Product (GDP). Arthur Okun (1962) concludes that each percentage point of unemployment above four percent of the labour force implies about three percent decrement in real GDP for the U.S. There have been several studies about the relationship between GDP and unemployment for various countries.
The main purpose of this paper is to examine the movements of unemployment and the relationship between unemployment and GDP in European countries. We consider 19 European Countries between 1977 and 2008. The main results of this paper are as follows. First, we analyze the existence of the unemployment hysteresis using several panel unit root tests in these countries. Although there have been a lot of studies related to hysteresis, OECD countries have been discussed in many of them. Roed (1999) and Leon-Ledesma (2002) find that hysteresis for the EU and natural rate for the U.S. are the more plausible hypotheses. Arestis and Mariscal (2000) examine 22 OECD countries and they find that hysteresis is not rejected only in 10 countries. Strazicich et.al. (2001) find that for OECD countries, the hysteresis hypothesis cannot be rejected. But the results change dramatically when they also allow for structural breaks in the stationary tests: hysteresis in unemployment is not only strongly rejected in the panel, but also in the individual country tests. Gustavsson and Österholm (2006) examine various countries and find hysteresis effect in only Australia with nonlinear unit root test. Romero-Avila and Usabiaga (2007) accept hysteresis hypothesis for Spain and natural rate hypothesis for the U.S. using unit root test with structural change. Lee and Chang (2008) find that unemployment rates are stationary with breaks for OECD countries. The application results in this paper suggest that there is unemployment hysteresis in all European countries.
Second, we examine the relationship between unemployment and GDP. Panel cointegration test results indicate the long term relationship, so we introduce a long run equation such that we can obtain Okun’s coefficient for the model in which GDP is the dependent variable. We estimate DOLS (Dynamic OLS) and FMOLS (Fully Modified OLS) for the long run coefficient and a panel error correction model with PMGE (Pooled Mean Group) and MGE (Mean Group) methods for the long and short run coefficients. The test results indicate that the PMG is an appreciated method. The PMGE results show that the Okun’s coefficient is -0.70 in 19 European countries for the period between 1977 and 2008. According to the results, pooled and individual error correction coefficients and pooled and most of individual short run coefficients are significant. Although the Okun’s coefficient is defined for the U.S. by Okun (1962), there are some studies for other countries to test the convergence of the Okun’s Law. These studies show us that the absolute value of the Okun’s coefficient seems to be varying over time and from country to country. For example, although the Okun’s
coefficient is found between -2 and -3 in USA by Okun (1962), Attfield and Silverstone (1997), Prachowny (1993), Weber and West (1996), Freeman (2001), Silvapulle et al. (2004) find this coefficient under -2. While Freeman (2001) estimates unemployment and output relationships for industrialized countries, Gabrisch and Buscher (2005) estimate these for transitions countries. Okun coefficient is estimated as -0.05 in Greek Regions by Christopoulos (2004) and it is found about -1.42 for the UK by Attfield and Silverstone (1998). Izyumov and Vahaly (2002) estimate the Okun’s coefficient as -1.32 in EU countries and -0.79 in non-EU countries for 1991-2000. According to Kim (2005), unemployment, economic growth and unionization are correlated with each other in the long run for Korea. Silvapulle et al. (2004) (for the U.S.) and Harris and Silverstone (2001) (for the OECD countries) show that Okun’s Law is asymmetric. Virén (2001) (for the OECD countries) and Huang and Lin (2006) (for the US) support the hypothesis that the Okun’s relationship is nonlinear. Sögner and Stiassny (2002) investigate the unemployment-GDP relationship by means of Kalman Filtering techniques for the OECD countries. Adanu (2005) estimates Okun’s coefficient with the Hodrick Prescott detrending and the quadratic detrending methods for 10 Canadian Provinces.
The outline of the paper is as follows. In section (2), we discuss the economic theory. Section (3) presents the application of panel unit root, panel cointegration tests and estimation of the long and short run models. Several empirical results are also discussed. Finally, section (4) concludes the paper.
2. The Model
The natural rate hypothesis proposed by Phelps (1967) and Friedman (1968) who argue that deviations from the natural rate should be temporary and the unemployment rate should revert to its mean. Because of the high unemployment rates especially during the 1970s and 1980s, some researchers looked for alternative explanations to the natural rate hypothesis. The unemployment hysteresis hypothesis is one of them. The term “unemployment hysteresis” was introduced in the labour market literature by Blanchard and Summers (1986). The hypothesis is described as a high degree dependence of the current employment level on the past.
Econometrically, the hysteresis hypothesis implies that the unemployment rates are non-stationary and unit root tests can be used to test this hypothesis. Let
u
it be the unemployment rate of country i=1,2,…..,N at time t=1,2,…..,T. The existence of unit root in unemployment series is tested with the following basic Augmented Dickey Fuller (ADF) specification for panel data;0 1 1 2 1 i mlag it i i it i ij it j it j u u t u
(1)This specification allows the lag order for the difference terms (mlag) to vary across the cross-section. There are several panel unit root test that are constructed using different null and alternative hypotheses:
Hypotheses (A) H0:1i 0 for all i versus H1:1i 0 for all i
Hypotheses (B) H0:1i 0 for all i versus H1:1i 0 for some i
While hypotheses (A) is used for Levin et al. (2002) panel unit root test; hypotheses (B) is assumed in Im et al. (2003) and Fisher type tests (ADF–Fisher and PP-Fisher) proposed by Maddala and Wu (1999) and Choi (2001). Hypotheses (C) is used in Hadri (2000) panel unit root test. Using these types of tests, the unemployment hysteresis can be tested.
An inverse relationship between the unemployment rate and real GDP has been known for a long time. According to Okun (1962), a one percentage point change in the rate of unemployment leads to three percent inverse change in the output. A typical version of Okun’s Law is a gap equation;
* ( *)
t t t t t
y y u u (2) 0
where, y is the logarithm of real output product, t u is the logarithm of t unemployment, * *
t t
y and u are the corresponding potential values and t is error
term. Okun’s Law can be shown in following model using its panel form;
* * ln it ln it i it it it y u y u i=1,2,…..,N ; t=1,2,…..,N (3) logarithm of unemployment rate and logarithm of output variables are potentially non-stationary variables, so the long term relationship can be investigated between these series. Assuming u and it y are both I(1) and if it it~I(0), cointegration relationship exists between these series (see Engle and Granger, 1987). Pedroni (1999) suggests seven Philips-Perron type panel cointegration tests (four panel and three group test statistics) under the null hypothesis of no cointegration against the alternative of cointegration with allowance for heterogeneity. Each of these panel test statistics under appropriate standardization is distributed asymptotically as a normal distribution and expressed as follows:
(0,1)
NT N N
v
(4)
Pedroni (1999) gives critical values for μ and v with and without intercepts and deterministic trends. Kao (1999) discusses bias-corrected tests for the null of no cointegration in a model where the variance of innovations is the same in all cross-section units. Kao suggests five panel cointegration tests, Kao ADF test is obtained by running the following regression;
1 1 ˆit ˆit p j ˆit j itp j v
(5)and the ADF test statistic is constructed as (Kao, 1999; 8):
0v 2 2 0 2 2 0 ˆ 6 ˆ 2 ˆ 3ˆ ˆ ˆ 2 10 v ADF v v v v N t ADF (6)
where, tADF is the t statistics of ρ, ˆv2 ˆyy ˆyx ˆxx1 and ˆ02v . ˆyy ˆ ˆyx xx1 ˆi refer long run variance of the residuals.
If there is long term relationship between
series according to panel cointegration tests results, the long term relationship can be estimated with FMOLS (fully modified OLS) proposed by Philips and Moon (1999) and Pedroni (2000) and DOLS (dynamic OLS) (Stock and Watson, 1993) estimation methods. The FMOLS estimator is constructed by making corrections for endogenity and serial correlation to the OLS estimator and it is obtained using the following equation (Pedroni, 2000, 102-103);
2 1
* 2 1 1 * 22 11 22 1 1 1 1 ˆ N ˆ T N ˆ ˆ T ˆ NT i it i i i it i it i i t i t L u u L L u u T
(7)where, ˆ is standard panel OLS estimator, NT ui refer to the individual specific means.
* 21 21 21 21 22 22 22 22 ˆ ˆ ˆ ˆ ˆ ˆ ˆ , ˆ i o ˆ i o it it it i i i i i i i L L x L L (8)and ˆ is a scalar long run variance of the residuals, ˆi o
i
is the contemporaneous
covariance and is a weighted sum of autocovariances. ˆi L is a lower triangular i
decomposition of ˆ . i 2 2 2
11
ˆ ˆ ˆ ˆ
i u u
L and Lˆ22i ˆ2 are the conditional long
term variances. The estimator of ˆ*
NT
converges to the true value at rate T N and is distributed as,
ˆ*
(0, ), where 2 if 0 6 else as and . i i NT u y T N N v v T N (9)The panel DOLS estimator is obtained by running the following regression which include leads and lags of differenced I(1) regressor in the regression;
q it i it ij it j it j q y u c u v
(10)Although FMOLS and DOLS estimation methods examine only long run parameters, the PMG and MG estimation methods calculate both long and short run parameters. MG estimation method proposed by Pesaran and Smith (1995) derives the long run parameters for the panel from averages of the long run parameters of the ARDL models for individual unit. The PMG estimation method introduced by Pesaran et al. (1999) occupies intermediate position between the MG method in which both slopes and intercepts are allowed to differ across unit and the standard fixed effect method in which the slopes are fixed and the intercepts are allowed vary. PMGE constraints the long run coefficients to be identical in an error correction framework, but allows the short run coefficients and error variances to differ across groups. Error correction equation (Hahn, 2004, 1200):
1 1 1 1 0 p q it i it i it ij it j ij it j it j j u y u y
(11) where, * * 1 0 1 1 1 p , q , p , q i ij i ij ij im ij im j j m j m j
and it-1 is error correction term. If
i is significant and negative, there exists longterm relationship between yit and uit. The equation can be estimated using a
maximum likelihood procedure to get the PMG estimator. This regression can also be estimated with MGE. The presence of slope homogeneity is tested using a joint
Hausman test† based on the null hypothesis of equivalence between the PMGE and
MGE. If the long-run coefficients are homogenous, then the MG estimators are
consistent and efficient (Pesaran et al., 1999). Under the hypothesis i 0, there
exists a long term homogeneous relationship between yit and uit defined by;
it i it it
y u (12)
where, (i i/ )i and it is a stationary process. The long run coefficient is the
same across group.
3. The Results
We use annual balanced panel data from 1977 to 2008 for 19 European Countries (18 of them are current EU members Austria, Belgium, Cyprus, Denmark, Finland, France, Germany, Greece, Ireland, Italy, Luxembourg, Malta, Netherlands, Portugal, Spain, Sweden, UK, while Hungary and Turkey are candidates). The variables that we consider are the logarithm of unemployment rate and the logarithm of real GDP. Austria, Cyprus and Luxembourg have the lowest unemployment rate and Spain and Turkey have generally the highest unemployment rate among these countries. In other countries, some increases have been seen in various periods.
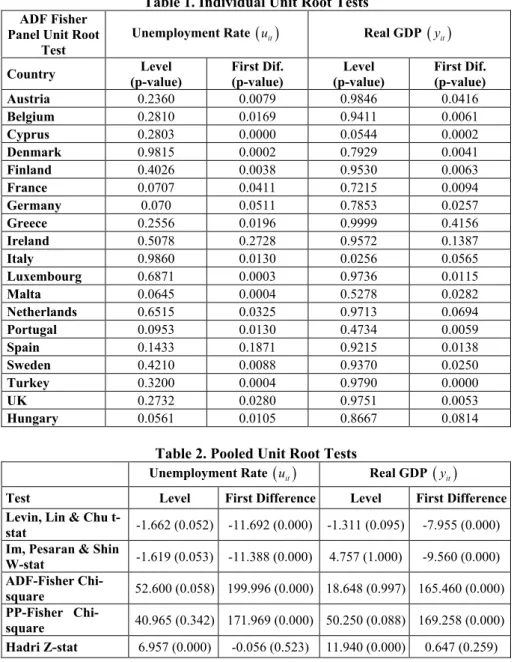
First, we apply several panel unit root tests for unemployment rate and GDP, the individual and the pooled panel unit root tests results are represented in Table 1 and Table 2, respectively. The lag orders are chosen by Akaike information criterion. Pooled unit root test results show that the unit root null hypothesis for panel data cannot be rejected in level for both series, however it is rejected for the first differences: both unemployment and GDP series are I(1). According to ADF individual panel unit root test results, the unemployment rate series for all countries except Ireland and Spain are I(1) in 10% significance level and GDP series of all countries except Greece and Ireland are also I(1). We can say by virtue of these results that unemployment hysteresis hypothesis is accepted in all European countries. For Turkey, Barışık and Çevik (2008) demonstrate hysteresis hypothesis with break in 1968. We also find hysteresis in Turkey using several panel unit root tests.
† Hausman test statistics;
ˆvar ˆ 1ˆ H ~2
n ˆ PMG MG , here, is the difference vector between MG and PMG.
Table 1. Individual Unit Root Tests
ADF Fisher Panel Unit Root
Test
Unemployment Rate
u Real it GDP
y itCountry (p-value) Level First Dif. (p-value) (p-value) Level First Dif. (p-value) Austria 0.2360 0.0079 0.9846 0.0416 Belgium 0.2810 0.0169 0.9411 0.0061 Cyprus 0.2803 0.0000 0.0544 0.0002 Denmark 0.9815 0.0002 0.7929 0.0041 Finland 0.4026 0.0038 0.9530 0.0063 France 0.0707 0.0411 0.7215 0.0094 Germany 0.070 0.0511 0.7853 0.0257 Greece 0.2556 0.0196 0.9999 0.4156 Ireland 0.5078 0.2728 0.9572 0.1387 Italy 0.9860 0.0130 0.0256 0.0565 Luxembourg 0.6871 0.0003 0.9736 0.0115 Malta 0.0645 0.0004 0.5278 0.0282 Netherlands 0.6515 0.0325 0.9713 0.0694 Portugal 0.0953 0.0130 0.4734 0.0059 Spain 0.1433 0.1871 0.9215 0.0138 Sweden 0.4210 0.0088 0.9370 0.0250 Turkey 0.3200 0.0004 0.9790 0.0000 UK 0.2732 0.0280 0.9751 0.0053 Hungary 0.0561 0.0105 0.8667 0.0814
Table 2. Pooled Unit Root Tests
Unemployment Rate
u Real it GDP
y itTest Level First Difference Level First Difference Levin, Lin & Chu
t-stat -1.662 (0.052) -11.692 (0.000) -1.311 (0.095) -7.955 (0.000) Im, Pesaran & Shin
W-stat -1.619 (0.053) -11.388 (0.000) 4.757 (1.000) -9.560 (0.000) ADF-Fisher Chi-square 52.600 (0.058) 199.996 (0.000) 18.648 (0.997) 165.460 (0.000) PP-Fisher Chi-square 40.965 (0.342) 171.969 (0.000) 50.250 (0.088) 169.258 (0.000) Hadri Z-stat 6.957 (0.000) -0.056 (0.523) 11.940 (0.000) 0.647 (0.259) p-values are in parenthesis.
The null hypothesis in Hadri-Z test that series are stationary and in other tests the null
hypothesis that series are non-stationary.
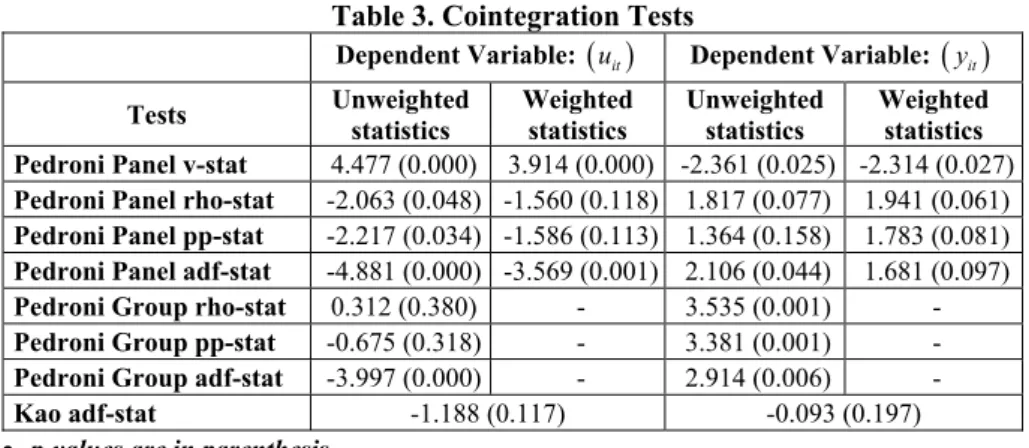
Second, a test for panel cointegration is implemented between GDP and unemployment rate. We test the existence of the long term relationship using Pedroni (1999) and Kao (1999) cointegration tests. The panel cointegration test results are stated in Table 3. The lag orders are chosen by Akaike information criterion, individual intercepts are included. We can not reject cointegration relationship between unemployment rate and GDP for 19 European countries for
both model 1 (dependent variable: unemployment rate, uit) and model 2 (dependent
Table 3. Cointegration Tests
Dependent Variable:
uit Dependent Variable:
yitTests Unweighted statistics Weighted statistics Unweighted statistics Weighted statistics Pedroni Panel v-stat 4.477 (0.000) 3.914 (0.000) -2.361 (0.025) -2.314 (0.027)
Pedroni Panel rho-stat -2.063 (0.048) -1.560 (0.118) 1.817 (0.077) 1.941 (0.061)
Pedroni Panel pp-stat -2.217 (0.034) -1.586 (0.113) 1.364 (0.158) 1.783 (0.081)
Pedroni Panel adf-stat -4.881 (0.000) -3.569 (0.001) 2.106 (0.044) 1.681 (0.097)
Pedroni Group rho-stat 0.312 (0.380) - 3.535 (0.001) -
Pedroni Group pp-stat -0.675 (0.318) - 3.381 (0.001) -
Pedroni Group adf-stat -3.997 (0.000) - 2.914 (0.006) -
Kao adf-stat -1.188 (0.117) -0.093 (0.197) p-values are in parenthesis,
The null hypothesis is no cointegration for all cointegration tests.
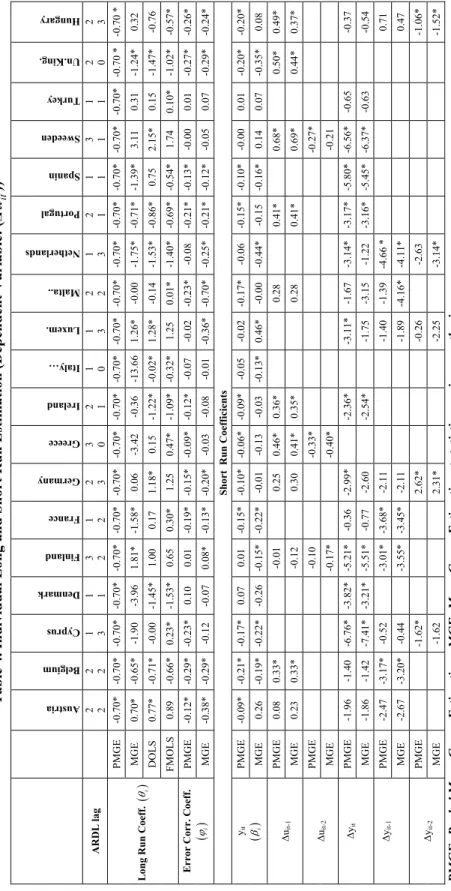
The next step is to estimate the long run model using FMOLS (fully modified OLS), DOLS (dynamic OLS) and OLS estimation methods. The results are displayed in Table 4 and Table 5 for individual and in Table 6 and Table 7 for pooled. Moreover, we compare these results with the PMG and MG estimation results, which are used to estimate both short and long run coefficients. The results are presented in Table 4-5 for individual and in Table 6-7 for pooled. The PMG method restricts the long run coefficients to be the same for each country however MG method does not use a restriction like this. The findings of the Hausman Test used in Table 6 and Table 7 for testing the hypothesis that long run coefficients are the same for all of the countries, display that the null hypothesis could not be rejected for both models. Thus, the PMGE is valid; in other words, the long run coefficients are homogenous and do not change according to the country. Therefore, the interpretations would be through the results of this estimation method. The results are reported in Table 4-6 for model 1 and in Table 5-7 for model 2. Although the estimated coefficients across the different estimation methods are generally close, they are quite different in terms of standard errors and t-statistics. We use the Akaike information criterion to choose lag length for all estimation methods. The error correction coefficient is significant for all countries except Denmark, Finland, Italy, Luxembourg, Netherlands, Sweden and Turkey according to PMGE results in model 1. It indicates that there are the long run relation between unemployment and growth in these countries. The long run coefficient is significant and its value is the same for all countries. This coefficient is Okun coefficient and indicates the long run elasticity. If the economic growth rate increases 1%, growth in the unemployment rate decreases 0.70% in the long run. Consequently, we can say that the Okun coefficient is lower in European countries than the US and the Okun Law does not hold for Denmark, Finland, Italy, Luxembourg, Netherlands, Sweden and Turkey. In the short run, one lagged first difference of unemployment rate is significant and positive in Belgium, Greece, Ireland, Portugal, Sweden, UK and Hungary. In Greece and Sweden, two lagged first difference of the unemployment rate is significant and negative. The first difference of GDP is significant and negative in Cyprus, Denmark, Finland, Germany, Ireland, Luxembourg, Netherlands, Portugal, Spain and Sweden. In Belgium, Finland, France and Netherlands, one lagged first difference of GDP has negative effect on the first difference of unemployment rate. The first difference of unemployment rates is negatively affected by two lagged of first differences of GDP in Cyprus, Germany and Hungary.
Do
ğu
ş Üniversitesi Dergisi
, 12 (1) 2011, 99-113
Table 4. Individual Long and Sho
rt Run Estimation (Dependent Variable: (
Δ it
u
)) Austria Belgium Cyprus Denmark Finland France Germany Greece Ireland Italy… Luxem. Malta.. Netherlands Portugal Spanin Sweeden Turkey Un.King. ARDL lag 2 2 2 2 1 3 1 1 3 2 1 2 2 3 3 0 2 1 1 0 1 3 2 2 1 3 2 1 1 1 3 1 1 1 2 0 2 3Long Run Coeff.
i PMGE -0.70* -0.70* -0.70* -0.70* -0.70* -0.70* -0.70* -0.70* -0.70* -0.70* -0.70* -0.70* -0. 70* -0.70* -0.70* -0.70* -0.70* -0.70 * -0.70 * MGE 0.70* -0.65* -1.90 -3.96 1.81* -1.58* 0.06 -3.42 -0.36 -13.66 1.26* -0.00 -1.75* -0.71* -1 .39* 3.11 0.31 -1.24* 0.32 DOLS 0.77* -0.71* -0.00 -1.45* 1.00 0.17 1.18* 0.15 -1.22* -0.02* 1. 28* -0.14 -1.53* -0.86* 0.75 2.15* 0.15 -1.47* -0.76 FMOLS 0.89 -0.66* 0.23* -1 .53* 0.65 0.30* 1.25 0.47* -1.09* -0.32* 1.25 0.01* -1.40* -0.69* -0.54* 1.74 0.10* -1.02* -0.57* Error Co rr. Co eff. i PMGE -0.12* -0.29* -0.23* 0.10 0.01 -0.19* -0.15* -0.09* -0.12* -0.07 -0.02 -0.23* -0.08 -0.21* -0.13* -0.00 0.01 -0.27* -0.26* MGE -0.38* -0.29* -0.12 -0.07 0.08* -0.13* -0.20* -0.03 -0.08 -0.01 -0.36* -0.70* -0.25* -0.21* -0. 12* -0.05 0.07 -0.29* -0.24*
Short Run Coefficients
yit i PMGE -0.09* -0.21* -0.17* 0.07 0.01 -0.15* -0.10* -0.06* -0.09* -0.05 -0.02 -0.17* -0.06 -0.15* -0.10* -0.00 0.01 -0.20* -0.20* MGE 0.26 -0.19* -0.22* -0.26 -0.15* -0.22* -0.01 -0.13 -0.03 -0.13* 0.46* -0.00 -0.44* -0.15 -0 .16* 0.14 0.07 -0.35* 0.08 ∆ uit-1 PMGE 0.08 0.33* -0.01 0.25 0.46* 0. 36* 0.28 0.41* 0.68* 0.50* 0.49* MGE 0.23 0.33* -0.12 0.30 0.41* 0.35* 0.28 0.41* 0.69* 0.44* 0.37* ∆ uit-2 PMGE -0.10 -0.33* -0.27* MGE -0.17* -0.40* -0.21 ∆ yit PMGE -1.96 -1.40 -6.76* -3.82* -5.21* -0.36 -2.99* -2.36* -3.11* -1.67 -3.14* -3.17* -5.80* -6.56* -0.65 -0.37 MGE -1.86 -1.42 -7.41* -3.21* -5.51* -0.77 -2.60 -2.54* -1.75 -3.15 -1.22 -3.16* -5.45* -6.37* -0.63 -0.54 ∆ yit-1 PMGE -2.47 -3.17* -0.52 -3.01* -3.68* -2.1 1 -1.40 -1.39 -4.66 * 0.71 MGE -2.67 -3.20* -0.44 -3.55* -3.45* -2.11 -1.89 -4.16* -4.11* 0.47 ∆ yit-2 PMGE -1.62* 2.62* -0.26 -2.63 -1.06* MGE -1.62 2.31* -2.25 -3.14* -1.52*
PMGE: Pooled Mean Group Estimation, MGE: Mean
Do
ğu
ş Üniversitesi Dergisi
, 12 (1) 2011, 99-113
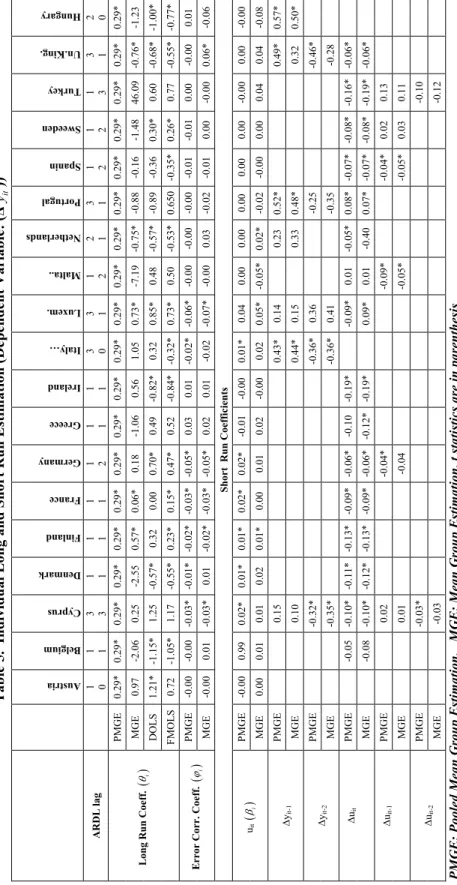
Table 5. Individual Long and Sho
rt Run Estimation (Dependent Variable: (
Δ it y )) Austria Belgium Cyprus Denmark Finland France Germany Greece Ireland Italy… Luxem. Malta.. Netherlands Portugal Spanin Sweeden Turkey Un.King. ARDL lag 1 0 1 1 3 3 1 1 1 1 1 1 1 2 1 1 1 1 3 0 3 1 1 2 2 1 3 1 1 2 1 2 1 3 3 1 2 0
Long Run Coeff.
i PMGE 0.29* 0.29* 0.29* 0. 29* 0.29* 0.29* 0.29* 0.29* 0.29* 0.29* 0.29* 0.29* 0.29* 0.29* 0.29* 0.29* 0.29* 0.29* 0.29* MGE 0.97 -2.06 0.25 -2.55 0.57* 0.06* 0. 18 -1.06 0.56 1.05 0.73* -7.19 -0. 75* -0.88 -0.16 -1.48 46.09 -0.76* -1.23 DOLS 1.21* -1.15* 1.25 -0.57* 0. 32 0.00 0.70* 0.49 -0.82* 0. 32 0.85* 0.48 -0.57* -0.89 -0 .36 0.30* 0.60 -0.68* -1.00* FMOLS 0.72 -1.05* 1.17 -0.55* 0.23* 0.15* 0.47* 0.52 -0.84* -0.32* 0.73* 0.50 -0.53* 0.650 -0.35* 0.26* 0.77 -0.55* -0.77* Error Co rr. Co eff. i PMGE -0.00 -0.00 -0.03* -0.01* -0.02* -0.03* -0.05* 0.03 0.01 -0.02* -0.06* -0.00 -0 .00 -0.00 -0.01 -0.01 0.00 -0.00 0.01 MGE -0.00 0.01 -0.03* 0.01 -0.02* -0.03* -0 .05* 0.02 0.01 -0.02 -0.07* -0.00 0.03 -0.02 -0.01 0.00 -0.00 0.06* -0.06
Short Run Coefficients
uit i PMGE -0.00 0.99 0.02* 0.01* 0.01* 0.02* 0.02* -0.01 -0.00 0.01* 0.04 0.00 0.00 0.00 0.00 0.00 -0.00 0.00 -0.00 MGE 0.00 0.01 0.01 0.02 0.01* 0.00 0.01 0.02 -0.00 0.02 0.05* -0.05* 0.02* -0.02 -0 .00 0.00 0.04 0.04 -0.08 ∆ yit-1 PMGE 0.15 0.43* 0. 14 0.23 0.52* 0.49* 0.57* MGE 0.10 0.44* 0.15 0.33 0.48* 0.32 0.50* ∆ yit-2 PMGE -0.32* -0.36* 0.36 -0.25 -0.46* MGE -0.35* -0.36* 0.41 -0.35 -0.28 ∆ uit PMGE -0.05 -0.10* -0.11* -0.13* -0.09* -0.06* -0.10 -0. 19* -0.09* 0.01 -0.05* 0.08* -0.07* -0.08* -0.16* -0.06* MGE -0.08 -0.10* -0.12* -0.13* -0.09* -0.06* -0.12* -0.19* 0.09* 0.01 -0.40 0.07* -0 .07* -0.08* -0.19* -0.06* ∆ uit-1 PMGE 0.02 -0.04* -0.09* -0.04* 0.02 0.13 MGE 0.01 -0.04 -0.05* -0.05* 0.03 0.11 ∆ uit-2 P M G E -0 .0 3* -0 .1 0 M G E -0 .0 3 -0 .1 2
PMGE: Pooled Mean Group Estimation, MGE: Mean
Table 6. Panel Long And Short Run Estimation (Dependent Variable: (Δ
u
it))PMGE MGE FE DOLS FMOLS Long Run Coefficient
i -0.698* -1.214 -0.04 -0.083 -0.05*Error Corr. Coefficient
i -0.125* -0.192*Short Run Coefficients
yit
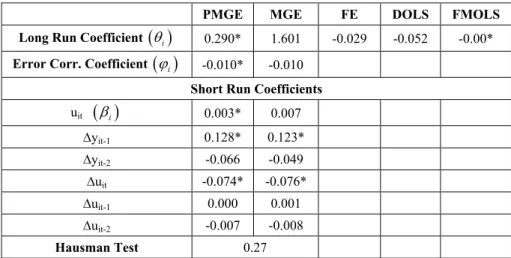
i -0.087* -0.075 ∆uit-1 0.202* 0.193* ∆uit-2 -0.037 -0.041 ∆yit -2.606* -2.506* ∆yit-1 -1.153* -1.322* ∆yit-2 -0.154 -0.325 Hausman Test 0.43Table 7. Panel Long and Short Run Estimation (Dependent Variable: (Δyit))
PMGE MGE FE DOLS FMOLS Long Run Coefficient
i 0.290* 1.601 -0.029 -0.052 -0.00*Error Corr. Coefficient
i -0.010* -0.010Short Run Coefficients
uit
i 0.003* 0.007 ∆yit-1 0.128* 0.123* ∆yit-2 -0.066 -0.049 ∆uit -0.074* -0.076* ∆uit-1 0.000 0.001 ∆uit-2 -0.007 -0.008 Hausman Test 0.27The long run coefficient is significant and its value is 0.29 for all countries according to PMGE results for model 2. The error correction coefficient is significant and negative only for Cyprus, Denmark, Finland, France, Germany, Italy and Luxembourg. We can conclude that GDP explains the unemployment rates in the long term for these countries. One lagged first difference of GDP and the first difference of unemployment rate are significant for pooled cases in the short term. In Italy, Portugal, UK and Hungary, one lagged first difference of GDP is significant and positive. Two lagged first difference of GDP is significant and negative in Cyprus, Italy and UK. In these countries today’s GDP is related to past GDP. Today’s first difference of unemployment rate also negatively affects today’s first difference of GDP in all countries but in Belgium, Greece and Malta. However, this coefficient is not estimated for Austria, Italy, and Hungary. One lagged first difference of unemployment rate has negative effect on GDP growth rate in Germany, Malta and Spain. Two lagged first difference of unemployment rate has negative effect on first differenced of GDP just in Cyprus.
In this paper, long term relationship between unemployment and growth can not be confirmed for Turkey. Yıldırım and Karaman (2003), Gürsel et al. (2002) and Demir and Bakırcı (2010) find that Okun coefficient negative but the value is small. Yerdelen Tatoglu (2010) finds no evidence for Granger causality relation in 1968-2008 for Turkey.
4. Conclusion
In this paper, we examined unemployment hysteresis and the long and short term relationships between unemployment rate and economic growth in European Countries over the period 1977-2008. Our estimation results show that there is evidence supporting the unemployment hysteresis in most of European countries. The unemployment rate series do not fluctuate around a predictable level and there is no tendency to return to stable natural rate in European Countries; cyclical fluctuations have permanent effect on the level of unemployment. Roed (1999) and Leon-Ledesma (2002) also find that unemployment hysteresis is a plausible hypothesis for European countries.
According to the results, there is long term relationship between GDP and unemployment rate, but the long run coefficients obtained from this study are lower compared to the coefficient obtained by Okun. The Hausman test indicates that the long run parameters (Okun’s coefficient) are the same for all countries. Okun’s coefficient is estimated -0.70 for European Countries.
Apart from the long term relationship, we also examined the short term relationship. According to the pooled results, the first difference of unemployment rate, the GDP growth rate and the first lag of GDP growth rate affects the first difference of the unemployment rate. Moreover, one lagged first difference of GDP and the first difference of unemployment rate have negative effect on the GDP growth rate. Individual results show that one lagged first difference of the unemployment rate positively affects the first difference of unemployment rate in 7 countries when two lagged first difference of the unemployment rate remains negative in 2 countries. The GDP growth rate negatively affects unemployment rate in 10 countries when one lagged first difference of GDP has a negative effect on the first difference of unemployment rate in 4 countries. However, two lagged first difference of GDP has a negative effect on the first difference of unemployment rate in 3 countries. Further, one lagged first difference of GDP positively affects GDP growth rate in 4 countries and two lagged first difference of GDP has a negative effect on GDP growth rate in 3 countries. The first difference of unemployment rate negatively affects GDP in 12 countries while it affects positively only one. One lagged first difference of unemployment rate has negative effects on GDP growth rate in 3 countries and two lagged first difference of unemployment rate negatively affects the first difference of GDP in 1 countries.
Finally, these results show us that although there is unemployment hysteresis in all European countries, the validity of the Okun’s coefficient and the direction of the
relationship between unemployment rate and real GDP vary between countries. Furthermore, with this study we become able to compare several estimation methods which are used in panel unit root, panel cointegration regression and panel long and short term regression.
Acknowledgements
The author would like to thank Dr. Sebastiano Manzan for his helpful comments and suggestions. The author would also like to thank the members of Editorial Office and the reviwers for their valuable contribution. However, any errors or omissions are the sole responsibility of the author.
References
ADANU, K. (2005). A Cross-Province Comparison of Okun’s Coefficient for Canada. Applied Economics, 37, pp.561-570.
ATTFIELD, C.L.F., SILVERSTONE, B. (1997). Okun’s Coefficient: A Comment. The Review of Economics and Statistics, 79 (2), pp.326-329.
ATTFIELD, C.L.F., SILVERSTONE, B. (1998). Okun’s Law, Cointegration and Gap Variables. Journal of Macroeconomics, 20 (3), pp.625-637.
ARESTIS, P., MARISCAL, I.B. (2000). OECD Unemployment: Structural Breaks and Stationary. Applied Economics, 32, pp.399-403.
BARIŞIK, S., ÇEVİK, İ.E. (2008). Yapısal Kırılma Testleri İle Türkiye’de İşsizlik Histerisinin Analizi: 1923-2006 Dönemi. KMU İİBF Dergisi, 10 (14), pp.1-36.
BLANCHARD, O.J., SUMMERS, L.H. (1986). Hysteresis and European Unemployment Problem. In S. Fischer (ed) NBER Macroeconomics Annual. Cambridge: MIT Press. CHOI, I. (2001). Unit Root Tests For Panel Data. Journal Of International Money And
Finance, 20, pp.249-272.
CHRISTOPOULOS, D.K. (2004). The Relationship between Output and Unemployment: Evidence from Greek Regions. Regional Science, 83, pp.611-620.
DEMİR, O., BAKIRCI, F. (2010). Türkiye’de İşsizlik Sorunu ve Büyüme-İşsizlik İlişkisi. [Available at]: <http://www.asagihomurlu.bel.tr/fehmbakirci/1.pdf>, [Accessed: 02.03.2010].
ENGLE, R.F., GRANGER, C.W.J. (1987). Co-integration and Error correction: Representation, Estimation and Testing. Econometrica, 55, pp.251-276.
FREEMAN, D.G. (2001). Panel Tests of Okun’s Law for Ten Industrial Countries. Economic Inquiry, 39 (4), pp.511-523.
FRIEDMAN, M. (1968). The Role of Monetary Policy. American Economic Review, 58, pp.1-17.
GABRISCH, H., BUSCHER, H. (2005). The Unemployment – Growth Relationship in Transition Countries. IWH-Discussion Papers, November 2005, 5, pp.1-26.
GUSTAVSSON, M.,ÖSTERHOLM, P. (2006). Hysteresis and Nonlinearities in Unemployment Rates. Applied Economics Letters, 13 (9), pp.545-458.
GÜRSEL, S. et al. (2002). Türkiye’de İşgücü Piyasası ve İşsizlik. TÜSİAD-T/2002/ 12-354. HADRI, K. (2000). Testing For Stationary in Heterogeneous Panel Data. Econometrics
Journal, 3 (2), pp.148-161.
HAHN, F. R. (2004). Long-run Homogenity of Labour Demand. Panel Evidence from OECD Countries. Applied Economics, 36 (11), pp.1199-1203.
HARRIS, R., SILVERSTONE, B. (2001). Testing for Asymmetry in Okun’s Law: A Cross-Country Comparison. Economics Bulletin, 5 (2), pp.1-13.
HUANG, H.R., LIN, S. (2006). A Flexible Nonlinear Inference to Okun’s Relationship. Applied Economics Letters, 13, pp.325-331.
IM, K.S., PESARAN, M.H., SHIN, Y. (2003). Testing For Unit Roots in Heterogeneous Panels, Journal of Econometrics, 115 (1), pp.53-74.
IZYUMOV, A., VAHALY, J. (2002). The Unemployment-Output Trade-off in Transition Economies: Does Okun’s Law Apply?. Economics of Planning, 35, pp.317-331. KAO, C. (1999). Spurious Regression and Residual-Based Tests for Cointegration in Panel
Data. Journal of Econometrics, 90, pp.1-44.
KIM, D. (2005). Unionization, Unemployment and Growth in Korea: A Cointegration Approach. Atlantic Economic Journal, 33, pp.225-233.
LEE, C.C., CHANG, C.P. (2008). Unemployment Hysteresis in OECD Countries: Centurical Time Series Evidence with Structural Breaks. Economic Modelling, 25 (2), pp.312-325. LEON-LEDESMA, M.A. (2002). Unemployment Hysteresis in the US and the EU: A Panel
Data Approach. Bulletin of Economic Research, 54 (2), pp.95-103.
LEVIN, A., LIN, C., CHU, C.J. (2002). Unit Root Test with Panel Data: Asymptotic and Finite-Sample, Journal of Econometrics, 108 (1), pp.1-24.
MADDALA, G.S., WU, S. (1999). A Comparative Study of Unit Roots Tests with Panel Data and A New Simple Test, Oxford Bulletin of Economics and Statistics, Special Issue, 6, pp.631-652.
MITCHELL, W.F. (1993). Testing for Unit Roots and Persistence in OECD Unemployment Rates. Applied Economics, 25, pp.1489-1501.
OKUN, A. (1962). Potential GNP: Its Measurement and Significance. American Statistical Assosiciation. Proceedings of the Business and Economic Statistics Section, pp.98-104. PEDRONI, P. (1999). Critical Values for Cointegration Tests in Heterogeneous Panels with
Multiple Repressors. Oxford Bulletin of Economics and Statistics, Special Issue, pp.653-670.
PEDRONI, P. (2000). Fully Modified OLS for Heterogeneous Cointegrated Panels. Nonstationary Panels, Panel Cointegration and Dynamic Panels, 15, pp.93-130.
PESARAN, H., SMITH R. (1995). The Natural Rate Hypothesis and Its Testable Implications. The Natural Rate of Unemployment: Reflections on 25 Years of the Hypothesis (ed.) R. Cross, Cambridge: Cambridge University Press.
PESARAN, M.N., SHIN, Y., SMITH, R.P. (1999). Pooled Mean Group Estimation of Dynamics Heterogeneous Panels. Journal of the American Statistical Association, 94 (446),pp.621-634.
PHELPS, E.S. (1967). Philips Curves, Expectations on Inflation and Optimal Unemployment Over Time. Economica, 34, pp.254-281.
PHILIPS, P., MOON, H. (1999), Linear Regression Limit Theory for Nonstationary Panel Data. Econometrica, 67 (5), pp.1057-1111.
PRACHOWNY, M.F.J. (1993). Okun’s Law: Theoretical Foundations and Revised Estimates. Review of Economics and Statistics, 75, pp.331-336.
ROED, K. (1999). A note on the Macroeconomic Modelling of Unemployment Hysteresis. Applied Economics Letters, 6, pp.255-258.
ROMERO-AVILA, D., USABIAGA, C. (2007). Unit Root Tests and Persistence of Unemployment: Spain vs. the Unted States. Applied Economics Letters, 14 (6), pp.457-461.
SILVAPULLE, P., MOOSA, I.A., SILVAPULLE, M.J. (2004). Asymmetry in Okun’s Law. Canadian Journal of Economics, 37 (2), pp.353-374.
SÖGNER, L., STIASSNY, A. (2002). An Analysis on the Structural Stability of Okun’s Law - A Cross-Country Study. Applied Economics, 14, pp.1775-1787.
STOCK, J., WATSON, M.W. (1993). A Simple Estimator of Cointegrating Vectors in Higher Order Integrated Systems. Econometrica, 61 (4), pp.738-820/
STRAZICICH, M.C., TIESLAU, M., LEE, J. (2001). Hysteresis in Unemployment? Evidence from Panel Unit Root Tests with Structural Change. University of North Texas, Department of Economics, Working Papers
VIRÉN, M. (2001). The Okun Curve is Non-linear. Economics Letters, 70, pp.253-257. WEBER, C.E., WEST, J.E. (1996). Functional Form in Regression Models of Okun’s Law.
Applied Economics Letters, 3, pp.607-609.
YERDELEN TATOĞLU, F. (2010). Türkiye ve Avrupa Birliği Üyesi Ülkelerde İşsizlik ve Büyüme. Sahhaflar Kitap Sarayı, İstanbul.
YILDIRIM, K., KARAMAN, D. (2003). Makro Ekonomi. Eğitim, Sağlık ve Bilimsel Araştırma Çalışmaları Vakfı, 145, Eskişehir.