NOTABLE INCREASE IN UNEMPLOYMENT
Seyfettin Gürsel
*Gökçe Uysal
∗∗ve Ayşenur Acar
∗∗∗Abstract
Seasonally adjusted labor market data shows that non-agricultural unemployment increased to 11.8 percent in
September 2012. The increase in the non-agricultural employment was due to the increase in service employment.
Employment in services increased by 144 thousand compared to August 2012 and 657 thousand compared to
September 2011. However, labor force grew at a faster rate, and thus non-agricultural unemployment rate
increased from 11.4 percent to 11.8 percent. We expect that increase in non-agricultural employment would
stagnate parallel to stagnating growth. The application per vacancy data released by Kariyer.net also points out
that non-agricultural unemployment will continue to increase in October 2012.
Increases in non-agricultural labor force returns to its long-term trend
According to the data released by TurkSTAT, non-agricultural labor force increased by 857 thousand (4.2 percent),
non-agricultural employment increased by 696 thousand (3.8 percent) and non-agricultural unemployment
increased by 161 thousand to 2 million 489 thousand in September 2012 on a year on year basis (Figure 1).
Increases in non-agricultural unemployment rates were curbed by slower than trend increases in labor force in the
past periods. This was reversed in September 2012. Labor force increased by 857 thousand this period on a yearly
basis (its trend is 550 - 600 thousand) whereas non-agricultural employment to increase by 696 thousand. As a
result, the number of unemployed persons increased by 161 thousand. Unemployment increased in this period for
the first time since January 2008 (Figure 1).
Figure 1 Year-on-year changes in non-agricultural labor force, employment and unemployment
Source: TurkSTAT, Betam
* Prof. Dr. Seyfettin Gürsel, Betam, Director, [email protected]
∗∗ Yrd. Doç. Dr. Gökçe Uysal, Betam, Vice Director, [email protected] ∗∗∗ Ayşenur Acar, Betam, Research Assistant, [email protected]
Labor Market Outlook:
December 2012
An increase in seasonally adjusted non-agricultural unemployment
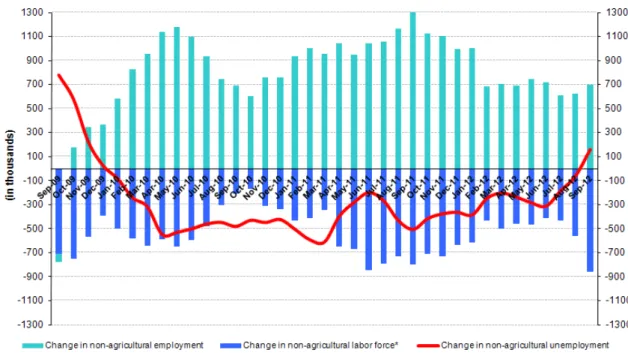
According to seasonally adjusted data, the non-agricultural labor force increased by 256 thousand to 21 million 405
thousand in September 2012 (Figure 2, Table 1). Non-agricultural employment increased by 145 thousand to 18
million 875 thousand. Consequently, the number of unemployed increased by 111 thousand, non-agricultural
unemployment rate increased from 11.4 percent to 11.8 percent. We have been expecting an increase in
non-agricultural unemployment rate since October 2012, parallel to the slowdown in growth rate (See Labor Market
Outlook: October 2012 – “TURNING POINT IN UNEMPLOYMENT”). Albeit a considerable increase in
non-agricultural employment, non-non-agricultural unemployment rate reached 11.8 percent due to a higher increase in
labor force in September 2012.
Figure 2 Seasonally adjusted non-agricultural labor force, employment and unemployment
Source: TurkStat, Betam
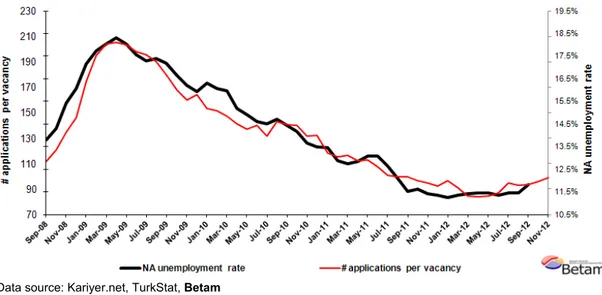
According to Kariyer.net data, the non-agricultural unemployment will increase in October 2012
Application per vacancy calculated by using series released by Kariyer.net
1indicates that non-agricultural
unemployment rate will continue to increase in the period of October 2012.
Figure 1 Seasonally adjusted non-agricultural unemployment rate and application per vacancy
Data source: Kariyer.net, TurkStat, Betam
1
Betam has been calculating application per vacancy using series released by Kariyer.net for a while. Seasonal and calendar adjustment procedure is applied to application per vacancy series. A decrease in applications per vacancy may be caused by an increase in vacancies or by a decrease in the number of applications. An increase in vacancies signals economic growth while decreasing number of applications indicates a decrease in number of people looking for a job.
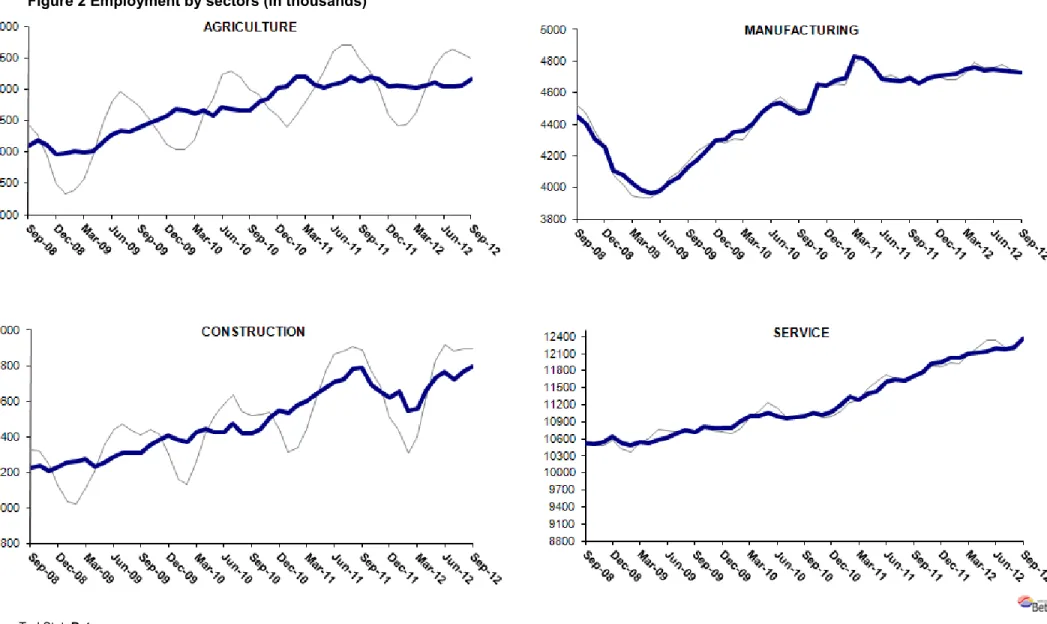
Service employment is the driving force behind the increase non-agricultural employment
Seasonally adjusted data shows that service employment increased by 144 thousand in September 2012
compared to August 2012 (Table 2, Figure 4)2. Employment fell by 9 thousand in manufacturing and 30 thousand
in construction. Summarizing the developments in the past year, manufacturing employment increased by 31
thousand, while construction employment increased slightly (8 thousand). On the other hand, increase in service
employment reached to 657 thousand on a year-on-year basis. Clearly low growth rates have taken a toll in the
labor market and employment was created mainly in services.
Table 1 Seasonally adjusted non-agricultural labor force indicators (in thousands)
Labor force Employment Unemployment Unemployment rate Monthly changes
August-09 19527 16133 3394 17.4% Labor force Employment Unemployment
September-09 19543 16186 3357 17.2% 16 53 -37 October-09 19649 16380 3270 16.6% 107 194 -87 November-09 19580 16409 3170 16.2% -70 30 -100 December-09 19629 16504 3125 15.9% 49 94 -45 January-10 19677 16469 3208 16.3% 48 -35 83 February-10 19817 16633 3184 16.1% 140 164 -23 March-10 19932 16746 3186 16.0% 115 114 2 April-10 19828 16819 3010 15.2% -104 73 -176 May-10 19889 16925 2964 14.9% 60 106 -46 June-10 19830 16934 2896 14.6% -59 10 -68 July-10 19847 16966 2881 14.5% 17 32 -15 August-10 19840 16919 2921 14.7% -8 -47 40 September-10 19767 16909 2857 14.5% -73 -10 -63 October-10 19834 17026 2808 14.2% 68 117 -49 November-10 19904 17182 2721 13.7% 69 156 -87 December-10 19982 17285 2697 13.5% 78 103 -25 January-11 20115 17409 2706 13.5% 133 123 10 February-11 20238 17635 2603 12.9% 123 227 -103 March-11 20283 17699 2585 12.7% 45 64 -18 April-11 20465 17833 2632 12.9% 181 134 47 May-11 20540 17854 2686 13.1% 75 21 54 June-11 20658 17957 2701 13.1% 118 103 15 July-11 20631 18026 2605 12.6% -26 69 -95 August-11 20578 18091 2486 12.1% -53 66 -119 September-11 20556 18190 2367 11.5% -22 98 -120 October-11 20546 18157 2389 11.6% -10 -33 23 November-11 20632 18276 2356 11.4% 86 120 -33 December-11 20622 18285 2337 11.3% -10 9 -19 January-12 20732 18400 2332 11.2% 109 115 -5 February-12 20686 18336 2350 11.4% -46 -64 18 March-12 20794 18420 2374 11.4% 109 84 24 April-12 20923 18527 2396 11.5% 129 107 22 May-12 21004 18600 2404 11.4% 81 74 8 June-12 21067 18674 2393 11.4% 63 73 -11 July-12 21070 18656 2414 11.5% 3 -17 20 August-12 21149 18730 2419 11.4% 79 74 5 September-12 21405 18875 2529 11.8% 256 145 111
Source: TurkStat, Betam
2 Seasonal adjustment procedure is applied to each sector of employment series separately. Hence the sum of these series may differ from the seasonally adjusted series of total employment. The difference stems from the non-linearity of the seasonal adjustment process.
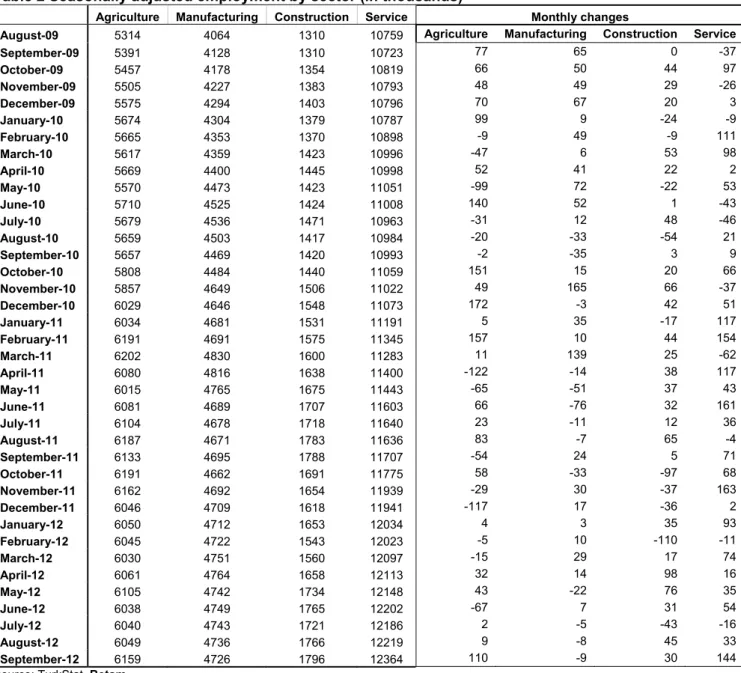
Table 2 Seasonally adjusted employment by sector (in thousands)
Agriculture Manufacturing Construction Service Monthly changes
August-09 5314 4064 1310 10759 Agriculture Manufacturing Construction Service
September-09 5391 4128 1310 10723 77 65 0 -37 October-09 5457 4178 1354 10819 66 50 44 97 November-09 5505 4227 1383 10793 48 49 29 -26 December-09 5575 4294 1403 10796 70 67 20 3 January-10 5674 4304 1379 10787 99 9 -24 -9 February-10 5665 4353 1370 10898 -9 49 -9 111 March-10 5617 4359 1423 10996 -47 6 53 98 April-10 5669 4400 1445 10998 52 41 22 2 May-10 5570 4473 1423 11051 -99 72 -22 53 June-10 5710 4525 1424 11008 140 52 1 -43 July-10 5679 4536 1471 10963 -31 12 48 -46 August-10 5659 4503 1417 10984 -20 -33 -54 21 September-10 5657 4469 1420 10993 -2 -35 3 9 October-10 5808 4484 1440 11059 151 15 20 66 November-10 5857 4649 1506 11022 49 165 66 -37 December-10 6029 4646 1548 11073 172 -3 42 51 January-11 6034 4681 1531 11191 5 35 -17 117 February-11 6191 4691 1575 11345 157 10 44 154 March-11 6202 4830 1600 11283 11 139 25 -62 April-11 6080 4816 1638 11400 -122 -14 38 117 May-11 6015 4765 1675 11443 -65 -51 37 43 June-11 6081 4689 1707 11603 66 -76 32 161 July-11 6104 4678 1718 11640 23 -11 12 36 August-11 6187 4671 1783 11636 83 -7 65 -4 September-11 6133 4695 1788 11707 -54 24 5 71 October-11 6191 4662 1691 11775 58 -33 -97 68 November-11 6162 4692 1654 11939 -29 30 -37 163 December-11 6046 4709 1618 11941 -117 17 -36 2 January-12 6050 4712 1653 12034 4 3 35 93 February-12 6045 4722 1543 12023 -5 10 -110 -11 March-12 6030 4751 1560 12097 -15 29 17 74 April-12 6061 4764 1658 12113 32 14 98 16 May-12 6105 4742 1734 12148 43 -22 76 35 June-12 6038 4749 1765 12202 -67 7 31 54 July-12 6040 4743 1721 12186 2 -5 -43 -16 August-12 6049 4736 1766 12219 9 -8 45 33 September-12 6159 4726 1796 12364 110 -9 30 144
Figure 2 Employment by sectors (in thousands)
3Source: TurkStat, Betam