T.C.
SELÇUK ÜNİVERSİTESİ FEN BİLİMLERİ ENSTİTÜSÜ
AN INTRUSION DETECTION APPROACH BASED ON BINARY PARTICLE SWARM
OPTIMIZATION AND NAIVE BAYES
Abdullahi Hussein ABDULLAHI
YÜKSEK LİSANS TEZİ Bilgisayar Mühendisliği Anabilim Dalı
Şubat-2018 KONYA Her Hakkı Saklıdır
T.C.
SELÇUK ÜNİVERSİTESİ FEN BİLİMLERİ ENSTİTÜSÜ
AN INTRUSION DETECTION APPROACH BASED ON BINARY PARTICLE SWARM
OPTIMIZATION AND NAIVE BAYES
Abdullahi Hussein ABDULLAHI
YÜKSEK LİSANS TEZİ Bilgisayar Mühendisliği Anabilim Dalı
Şubat -2018 KONYA Her Hakkı Saklıdır
TEZ KABUL VE ONAYI
Abdullahi Hussein ABDULLAHI tarafından hazırlanan “An Intrusion Detection Approach Based on Binary Particle Swarm Optimization and Naive Bayes” adlı tez çalışması …/…/… tarihinde aşağıdaki jüri tarafından oy birliği/oy çokluğu ile Selçuk Üniversitesi Fen Bilimleri Enstitüsü Bilgisayar Mühendisliği Anabilim Dalı’nda YÜKSEK LİSANS TEZİ olarak kabul edilmiştir.
Jüri Üyeleri İmza
Başkan
Doç. Dr. Mustafa Servet KIRAN ………..
Danışman
Yrd. Doç. Dr. Mesut Gündüz ………..
Üye
Yrd.Doç.Dr. Mehmet Hacıbeyoğlu ………..
Üye
Doç.Dr. İsmail Babaoğlu ………..
Üye
Yrd.Doç.Dr. Abdullah Tümer ………..
Yukarıdaki sonucu onaylarım.
Prof. Dr. ……. …….. FBE Müdürü
TEZ BİLDİRİMİ
Bu Tezdeki bütün bilgilerin etik davranış ve akademik kurallar çerçevesinde elde edildiğini ve tez yazım kurallarına uygun olarak hazırlanan bu çalışmada bana ait olmayan her türlü ifade ve bilginin kaynağına eksiksiz atıf yapıldığını bildiririm.
DECLARATION PAGE
I hereby declare that all information in this thesis document has been obtained and presented in accordance with academic rules and ethical conduct. I also declare that, as required by these rules and conduct, I had fully cited and referenced all material and results that are not original to this work.
İmza
Abdullahi Hussein ABDULLAHI
v
YÜKSEK LİSANS TEZİ
İKİlİ PARÇACIK SÜRÜSÜ OPTIMIZASYONUNA VE NAIVE BAYES'E DAYALI BIR SALDIRI TESPITİ YAKLAŞIMI
Abdullahi Hussein ABDULLAHI SELÇUK ÜNİVERSİTESİ FEN BİLİMLERİ ENSTİTÜSÜ
BİLGİSAYAR MÜHENDİSLİĞİ ANABİLİM DALI
Danışman: Yrd. Doç. Dr. Mesut GÜNDÜZ 2018, 61 Pages
Jüri
Doç. Dr. Mustafa Servet KIRAN Yrd. Doç. Dr. Mesut GÜNDÜZ Yrd. Doç. Dr. Mehmet HACIBEYOĞLU
Saldırı tespit sistemleri (IDS) yıllardır bilgisayar sistemlerine karşı problemli ya da zararlı faaliyetlerin tespitine yardımcı olmak için kullanıldı. Bu nedenle, birçok araştırmacı, saldırı tespit problemlerinin zorluklarıyla başa çıkmak için makine öğrenme yöntemleri ve doğadan esinlenilmiş algoritmalar gibi yöntemlerin bir kombinasyonuyla IDS'yi önerdi. Bu çalışmada daha iyi bir performans elde etmek ve doğruluk kazanmak için Naive Bayes ve İkili Parçacık Sürü Optimizasyonu birleştirilmiştir. Günümüzde, muazzam veri boyutlarından dolayı verilerin sınıflandırılması çok zor bir görev haline gelmiştir. Bu yüzden, özellik seçim yöntemleri bu zorlukların üstesinden gelmek, veri kümesi sınıflandırmasında daha fazla doğruluk üretmek ve büyük verilerin boyutsallığını azaltmak için kullanılmıştır. Parçacık sürüsü optimizasyonu (PSO), sezgisel bir optimizasyon tekniğidir ve optimum bir çözüm aramak için bir özellik seçimi yöntemi olarak kullanılabilen bir algoritmadır. İkili PSO, Naive Bayes sınıflandırma algoritmasının doğruluğunu geliştirmek için önemli özellikleri seçmek amacıyla kullanılmıştır. Bu çalışmanın amacı, özellik seçimi için İkili Parçacık Sürüsü Optimizasyon teknikleri ve veri sınıflandırması için Naive Bayes yöntemi uygulamaktır. Araştırma ayrıca, İkili PSO ve Naive Bayes algoritmalarının performansını ve sonuçlarını karar ağacı, rasgele orman sınıflandırıcı algoritmaları ile karşılaştırmayı ve hangi algoritmanın hem kalite hem de doğrulukta iyi performans gösterdiğini bulmayı amaçlamıştır. Bu yöntemlerin performans değerlendirmesinde NSL-KDD veri seti kullanılmıştır. Önerilen modelin sonucu diğer modellere kıyasla başarılı performans sergilemiş, daha sağlıklı bir sonuç ortaya koyacağı tespit edilmiştir.
Anahtar Kelimeler: İkili Parçacık Sürüsü Optimizasyon, Karar Ağacı, Naive Bayes, NSL-KDD, Rastgele Orman, Saldırı Tespiti.
vi
MASTER THESIS
AN INTRUSION DETECTION APPROACH BASED ON BINARY PARTICLE SWARM OPTIMIZATION AND NAIVE BAYES
Abdullahi Hussein ABDULLAHI
THE GRADUATE SCHOOL OF NATURAL AND APPLIED SCIENCE OF SELÇUK UNIVERSITY
THE DEGREE OF MASTER OF SCIENCE IN COMPUTER ENGINEERING
Advisor: Asst. Prof. Dr. Mesut GÜNDÜZ 2018, 61 Pages
Jury
Assoc. Prof. Dr. Mustafa Servet KIRAN Asst. Prof. Dr. Mesut GÜNDÜZ Asst. Prof. Dr. Mehmet HACIBEYOĞLU
Intrusion detection systems (IDS) was used to be assisting in the detection of mischievous or harmful activities against computer systems for decades. Thus, a lot of researchers have suggested the IDS with a combination of methods like machine learning methods and nature-inspired algorithms to deal with difficulties of intrusion detection problems. In this study, it is combined Binary Particle Swarm Optimization (BPSO) and Naive Bayes to achieve better performance and attain accuracy. Currently, the enormous growth of data and the classification of the data have become a very challenging task. So, the feature selection methods are used to reduce the dimensionality of the enormous data in order to produces better accuracy in the classification. Particle Swarm Optimization is one of the evolutionary algorithms and a computational technique that can be used as a feature selection method to search an optimal solution. BPSO had been used for feature selection for choosing important features to improve the accuracy of the Naive Bayes classification algorithm. The objective of this study is to apply BPSO techniques for feature selection and Naive Bayes method for data classification, the research also aimed to compare performance and the results of the algorithms of BPSO and Naive Bayes with Decision Tree and Random Forest classifications to find out which algorithm performed well both in quality and accuracy. NSL-KDD data has been used in the evaluation and assessment of the performance of these methods, and the result of the proposed model had provided better classification accuracy and better performance than the other models.
Keywords: Binary Particle Swarm Optimization, Decision Tree, Intrusion Detection, Naive Bayes, NSL-KDD, Random Forest.
vii
All praise and thanks are due to Allah. I would like to thank a number of people whom without their help, I would not have done this thesis today. I am very grateful to the members of my family. I am indebted to my supervisor, Asst. Prof. Dr. Mesut GÜNDÜZ who was giving me constructive comments and guidance throughout my research. I would also like to express my most profound gratitude to my lecturer Assoc. Prof. Dr. Mustafa Servet KIRAN and research assistant Ismail KOÇ for their constructive comments and endless help during the coding process. My thanks also go to my friends, Ismail Mohamed NUR, Shakir Mohamed ABDULLAHI, Aweis Ahmed MOHAMED, Hussein Farah YUSUF, Zakariye Ibrahim ALI, Abdishakur Abdullahi ABUKAR and Salad Mohamed SALAD for their different support during the writing of my thesis.
İmza
Abdullahi Hussein ABDULLAHI Konya -2018
viii
TEZ BİLDİRİMİ ... IV DECLARATION PAGE ... IV ÖZET ... V ABSTRACT ... VI PREFACE ... VII CONTENTS ... VIII SYMBOLS AND ABBREVIATIONS ... X
1 INTRODUCTION ... 1
1.1INTRUSION DETECTION SYSTEMS ... 1
1.2HISTORY OF INTRUSION DETECTION ... 2
1.3THE CLASSIFICATIONS OF IDS ... 2
1.3.1. Detection Approach ... 3
1.3.1.1 Anomaly based detection ... 3
1.3.1.2 Signature based detection ... 3
1.3.2. Protected Systems ... 4
1.3.2.1 Host-based intrusion detection system ... 4
1.3.2.2 Network-based intrusion detection systems ... 4
1.3.3. Hybrid IDS ... 5
1.3.3.1 Behavior after an attack of IDS... 5
1.4THE PURPOSE OF THIS STUDY ... 6
1.5THE IMPORTANCE OF THE THESIS WORK ... 6
2 LITERATURE REVIEW ... 8
3 MATERIAL AND METHODS ... 13
3.1MACHINE LEARNING AND HISTORY ... 13
3.1.1. Supervised learning ... 14
3.1.1.1 Decision trees ... 16
3.1.1.2 Naive Bayesian Method ... 17
ix
3.1.1.3 Feature Selection ... 20
3.1.1.3.1 Feature Selection Methods ... 20
3.1.1.3.2 Particle Swarm Optimization ... 21
3.1.1.3.3 Binary Particle Swarm Optimization (BPSO) ... 22
3.1.1.3.4 Implementation of PSO ... 24
3.1.1.4 Binary Particle Swarm Optimization with Naïve Bayes ... 25
3.1.1.4.1 The Proposed Methods of BPSO-NB ... 26
3.1.1.5 Random Forests ... 26
3.1.1.5.1 Overview of Random Forest Management ... 27
3.2UNSUPERVISED LEARNING ... 27 3.3EXPERIMENTAL MATERIALS ... 28 3.3.1. KDD CUP99 ... 28 3.3.2. NSL-KDD ... 31 4 EXPERIMENTAL STUDY ... 32 4.1EXPERIMENT ... 33
4.2TESTS AND EVALUATION ... 34
4.3PARAMETER SET UP ... 34 4.4ACCURACY ... 35 4.5SENSITIVITY ... 35 4.6SPECIFICITY ... 36 4.7PRECISION ... 36 4.8F-SCORE ... 36
4.9EXPERIMENT OF DECISION TREE ... 37
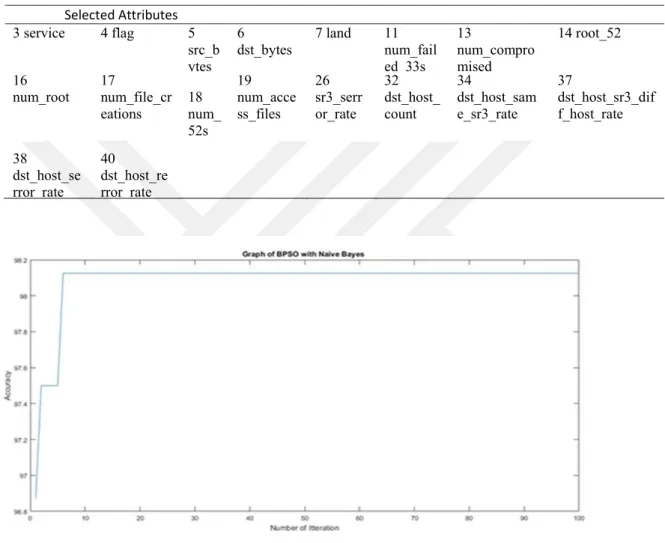
4.10EXPERIMENT OF BİNARY PSO WİTH NAİVE BAYES ... 38
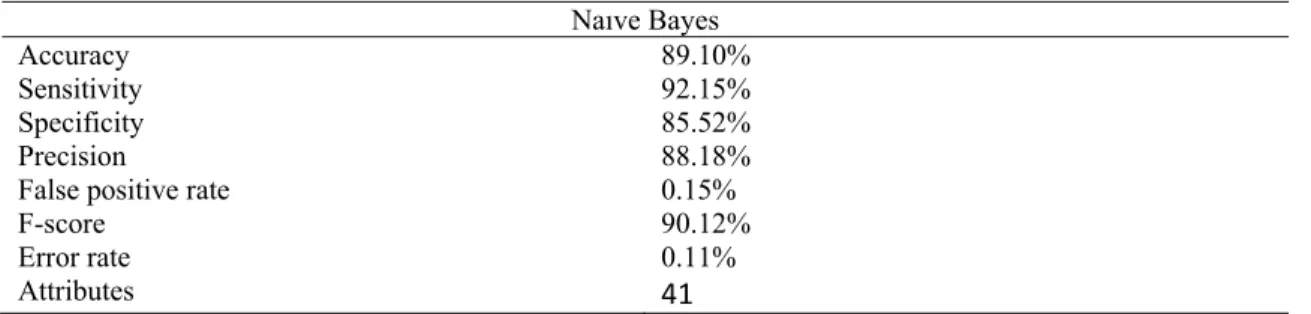
4.11EXPERIMENT OF NAİVE BAYES ... 38
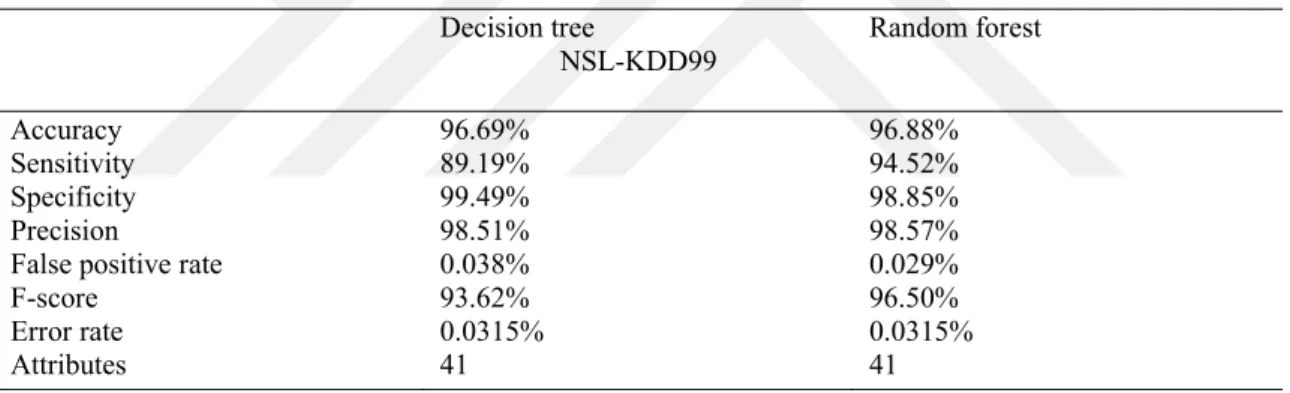
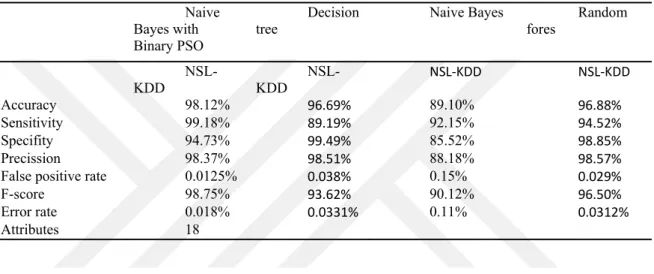
4.12COMPARISON WITH OTHER ALGORITHMS ... 38
4.13COMPARISON OF ACCURACY ... 40
5 RESULTS AND DISCUSSION ... 42
REFERENCES ... 45
x
SYMBOLS AND ABBREVIATIONS
Symbols
@: at symbol
Θ: theta
∑: The sigma sign is known by most as a symbol that indicates the sum.
Abbreviations
ABC: Artificial Bee Colony.
AC: Ant Colony.
API: Application Program Interface. BC: Bayesian Classification.
BPSO: Binary Particle Swarm Optimization. CSV: Comma Separated Values.
CV: Cross Validation.
DARPA: Defense Advanced Research Projects Agency.
DM: Data Mining.
DOS: Denial of Service.
FN: False Negative.
FP: False Positive.
FPR: False Positive Rate. GPL: General Public License. GUI: Graphic User Interface.
HIDS: Host-Based Intrusion Detection System. IDS: Intrusion Detection System.
KDD: Knowledge Discovery Database. MAP: Maximum a Posteriori.
ML: Machine Learning.
NIDS: Network Intrusion Detection System. PCA: Principal Component Analysis. R2L: Remote to Local.
R2L: Remote to Login.
SVD: Singular Value Decomposition. SVM: Support Vector Machine. TCP: Transmission Control Protocol. U2R: User to Remote.
1 INTRODUCTION
1.1 Intrusion Detection Systems
The attack on computer network infrastructures has become very dangerous
problems. Computer security is described safeguard of computer systems against attacks and threats to confidentiality and privacy. An intrusion is described as any set of activities that try to harm the computer network infrastructure through the network with malicious activity. Srinivasulu, Nagaraju, Kumar, and Rao (2009) defined intrusion as a kind of a cyber-attack that tries to avoid the security infrastructure of a computer system. That type of an attacker can emanate from the outside in an attempt to gain access to the system, or from the inside with the aim of obtaining and misusing non-authorized privileges.
Abraham, Grosan, and Chen (2005) have described intrusion detection as demand for the extra wall for shielding computer systems. Intrusion detection also provides significant information for timely respond. Intrusion detection is a substantial section of information security tools; it helps to realize, decide and recognize illegal, unauthorized actions, copying, modification and damage of information and computer information system (Mukkamala, Sung, & Abraham, 2005).
Intrusion detection system (IDS) is an application utilized for observing the network and keeping it from intruders (S.Vijayarani & Sylviaa.S, 2015). IDS, which can monitor intrusions based on their behavior from normal to attacking situation through using user or systems profiles is known as anomaly detection. Intrusion detection depends on the assumption the network and computer information system under threat and displays several models and characteristics to recognize the typical ones. There are still many drawbacks although intrusion detection technology is advancing.
Intrusion detection algorithm has an unrelated attack labeling and classification technique (Mukkamala et al., 2005). It has evolved into a regular part of security basis that plays a role by granting network administrators to identify violations of policy. Intrusion detection systems are essential components in network security infrastructure that examines the system or network activity to find possible intrusions or attacks and trigger security alerts for the malicious activities (Ghorbani, Lu, & Tavallaee, 2009).
1.2 History of Intrusion Detection
The objective of intrusion detection is to observe the network systems to identify abnormal behavior and exploitation in the network (S.Vijayarani & Sylviaa.S, 2015). The intrusion detection idea had been around for nearly two decades and became popular into the overall information security in the early 1980’s as soon as a researcher named James Anderson voiced paper “Monitoring and Surveillance Threated by Computer Security, ” and after that, the intrusion detection was accepted (Anderson, 1980). Since then, technology has brought the current status of the current IDS (Ashoor & Gore, 2011).
James Anderson’s paper that was explained the idea of the audit trails contained the necessary information, which might be important in tracking misuse and understanding of user actions, at the same time a paper titled the theory of “detecting misuse” arose. Anderson's concept discovered the basis for the future intrusion detection system design, the work he did was the initial of the host-based intrusion detection and IDS in general (Anderson, 1980). In 1983, SRI International and Dr. Dorothy Denning began to work as a state sponsor for the advancing of a new IDS. The purpose of the study was to analyze audit records on the state-owned mainframe computers and creating a user profile based on the activities of the users. After a year later, the first IDS model was developed, with the help of Dr. Denning.
1.3 The Classifications of IDS
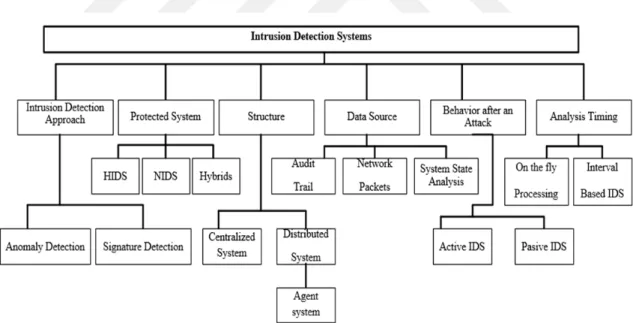
IDSs are used to find attacks on unhealthy computer systems when it is appearing or after it appeared. The attacker of computer systems might come from the internet or local area network, which can damage the computer system on the net, which consist of various data packets. IDS is a security technology aimed at responding to these attacks. Also, IDS can be also considered as a kind of alarm system (Endorf, Schultz, & Mellander, 2004). Intrusion detection can be divided as follows: Detection Approach, Protected system, Structure, Data Source, Behavior after attack, Analysis Timing.
1.3.1. Detection Approach
Detection Approach is one of the most used approach to mitigate the intrusion. It has two main detection approaches.
1.3.1.1 Anomaly based detection
The collected data is compared with the data collected from the same system before and it is determined whether the data flow is normal or attack. Performance values of system resources are also monitored. The anomaly-based IDSs compare the qualities of events in the ordinary course of life with those of remarkable events. In addition, sudden changes in values such as CPU usage, system input/output times, RAM usage rate can be defined as attack (Lee & Stolfo, 1998). It is a self-learning structure, even though new attack types can be detected, the error rate is not low. Particularly false positive and false negative values are significantly higher than signature-based IDSs. In order to detect abnormalities statistical and artificial intelligence techniques may be utilized. (Patcha & Park, 2007). Although IDSs are ideal systems for monitoring the network, they cannot react to future attacks. Intrusion Prevention System react immediately to incoming attacks, but they do not have the ability to resist attacks from within the network (Wu, Xiao, Xu, Peng, & Zhuang, 2009). In researches to find solutions to this problem, virtualization technologies have been considered as an important part of the solution.
1.3.1.2 Signature based detection
The collected data are compared according to previously known attack patterns (signature). It is the simplest way to configure attack features compared to known attack features in the database. The error rate is very low. But new forms of attack cannot be detected. For example, if a password attempts to crack a certain number of attempts within a certain period of time, it can be considered an attack (Sobh, 2006). The system is developed on the basis that new attack types can be introduced to the system.
1.3.2. Protected Systems
There are three main in the deployment host-based, network-based and combination of both named as hybrid.
1.3.2.1 Host-based intrusion detection system
The host-based intrusion detection system is one of the important kind of intrusion detection software designed to target computers to individual computers (Allen, Christie, Fithen, McHugh, & Pickel, 2000). Host-based intrusion detection system (HIDS) monitors only incoming and outgoing packets from the computer system and warns the user or administrator if suspicious activity is detected as one. It is used specially to protect confidential and critical information on important server systems. HIDS consists of sensors (from agents) placed on servers or workstations to prevent attacks that might happen to a particular machine. HIDS can decide to monitor system status by using operating system audit trails and system log records. It can receive which resources have access to which programs.
1.3.2.2 Network-based intrusion detection systems
Network-based intrusion detection systems(NIDS) focus on the network itself from a specific server, displays traffic passing through the network as a data source. NIDS can monitor network traffic affecting multiple hosts connected to this network segment by reading the network segment or switching device. In NIDS, packets are mainly concerned with packets passing through the network, over packets passing through the pack sensors located at specific points in the network. Packet analysis is performed by comparing the incoming packet to the sensor with the existing signatures in the system. The initial level filter specifies which packets are accepted and which packets are to be discarded or whether the packet is sent to the intrusion detection module, if an intruder is mitigated, the reply module triggers the alarm generation mechanism in response to the attack.
1.3.3. Hybrid IDS
Hybrid IDS is the combination of HIDS and NIDS to mitigate the system efficiently. But it has some disadvantages of high computational cost and overhead.
1.3.3.1 Behavior after an attack of IDS
Behavior after an attack can be divided into two groups active and passive. An active IDS will not only detect malicious or suspicious traffic and notify to the admin but also will take pre-defined proactive actions to respond to the threat. Basically, it means that any more network traffic from user or IP will be blocked. On the other hand, a passive IDS typically mitigates and notifies. When malicious or suspicious traffic is mitigated a notification is generated and sent to the user or admin, so they are responsible to detect/block that malice activity or respond in some way. Also, it is possible to divide into groups in many diverse forms of intrusion detection systems like Architecture: Data Source, Analysis Timing, as displayed in Figure 1.1.
Figure 1.1. Classification of Intrusion Detection Systems (Kazienko & Dorosz, 2004)
1.4 The Purpose of This Study
Recent years, one of the most demanding tasks is solution of intrusion detection problem, because of the rapid increase of the number of computer networks, this growth in connectivity allows the strangers to access the computers at the same time avoid them being recognized. So, it is necessary to obtain systems that are highly effective and efficient, at the same time keeps the network safe from the intruders. Therefore, getting those systems, many researchers have used methods like machine learning algorithms and other metaheuristic algorithms for feature selection that chooses actual features from many features since it is tough to process and lower the classification . The feature selection reduces the difficulty of the process by letting the machine learning algorithms to consider only the main features. As many researchers proposed, many kinds of model for network intrusion detection systems (NIDS) exist.
Consequently, this study uses Binary Particle Swarm Optimization (BPSO) for feature selection and Naive Bayes for classification. The result of this study is intended to compare previous work of (Elngar, Mohamed, & Ghaleb, 2013) and other algorithms such as Decision tree, Random forest. The main objective of this study is to find a predictive model system using BPSO and Naive Bayes to prevent network security connectivity from attackeers.
1.5 The Importance of the Thesis Work
Especially in the last few years, it has been observed that high-dimensional data are significantly increased. Intrusion detection had so many problems that tackled the capability of detecting intruders and malicious activities in the network system. Since we need high dimensional data to recognize an intrusion in the network high dimensionality in data may reduce accuracy of classification. In a way to solve this problem, it has been used one of the feature selection methods to select the original data of the best subsets in terms of classification accuracy. Feature selection is an operation of selecting a subgroup of related features that can reduce the dimensions, minimizing the running time and increasing the accuracy of Naive Bayes algorithm. This study will contribute to the finding of the
better subset of features to represent the data set in two different globally accessible data sets, using the BPSO with Naive Bayes algorithms.
2 LITERATURE REVIEW
Farid, Rahman, and Rahman (2011) proposed a method of intrusion detection using boosting and Naive Bayes classifier and updates the training sets weights of each round from wrongly classification error rate found from training samples, the aim was to decrease and enhance the detection rate and accuracy in acceptable level in intrusion detection respectively. The result manifest that they improve the performance and achieve high detection rate and low false positive rate of intrusion detection.
The researchers Mukherjee and Sharma (2012) proposed Naive Bayes with three normal feature selection methods to reduce data sets. The methods are Gain Ratio, information Gain and Correlation based Feature Selection and the results was good. Elngar, Mohamed, and Ghaleb (2013) proposed to combine PSO-Discretise with hidden Naive Bayes and result they found was 98.2%. Hui, Zhang, Mingjie, and Sun (2011)designed enhanced intrusion detection techniques based on improved SVM by merging Principal Component Analysis (PCA) and Particle Swarm Optimization (PSO). KDDCUP99 dataset was employed for the experiment.
Jemili, Zaghdoud, and Ahmed (2007) designed an automatic signature-based intrusion detection system using Bayesian networks. Their purpose is to compare the behaviors observed in the computer system with the signatures of known attacks and to detect the signatures of known attacks. When tested IDS with DARPA 99 data, they have achieved 99.6% success in DOS attacks, 100% in information scanning (PROBE) attacks, 98.6% in U2R attacks and 42.6% in R2L attacks.
Farid and Rahman (2010) used Bayesian networks to reduce the number of false alarms, the model that developed was Improved Self-Adaptive Bayesian Algorithm-ISABA, the improved system was tested using the KDD CUP99 dataset, the result achieved was 99.82% for normal behaviors, 99.5% for DOS attacks, 99.7% for Probe, 99.4% for U2R attacks and 99.4% for R2L attacks.
IDS was developed using support vector machine by Zhang and Zhu (2010) the IDS greedy algorithm was designed using the smallest squares and SVM. In the tests the KDD CUP99 data were used, which was correctly classified normal behaviors as 99.3%, DOS attacks as 93.8%, Probe attacks as 33.6%, U2R attacks as 39.3% and R2L attacks and as 99.4%.
Wang, Li, and Ren (2010) used the ABC algorithm to recognize the ideal values of the classification parameters of the support vector machine algorithm. The developed system was tested on KDD99 dataset, the results of the test were 100% for normal behaviors, 99.9% for DOS attacks, 100% for Probe attacks, 76% for U2R attacks and 87.9% for R2L attacks.
Lin and Yu (2011) suggested PSO with weighted Naive Bayes method that uses PSO as search function in simultaneously keeping the integrity of every attribute of datasets their objective was to reach improved classification accuracy while keeping away the loss of information as benchmark for the experiment used UCI datasets, predictable results were achieved and were 96.6%.
Naive Bayes classification is an easy and efficient classification algorithm but sometimes the independence between the attributes affects and limits the actual data. Jun Li and Bo Li presented an approach or combination of PSO-Naive Bayes for selecting the attribute to improve Naive Bayes classifier. The PSO method, in the beginning, it searches the optimal subgroup of attributes to reduce from all attributes and then to build Naive Bayes classification model the decreasing attributes they tested, their proposed algorithm nineteen data sets on UCI datasets and compared with other algorithms. Their proposed algorithm had better classification accuracy, the mean of all experiment accuracy shows that PSO-Naive Bayes has %84.63 classification accuracy. (Li, Ding, & Li, 2014).
Sengottuvelan and GopalaKrishnan (2016) researched about e-learning systems and the reason that learners disengage from an online learning education systems, to find the optimal explanation of disengaged learners in the online environment. So, they proposed Hybrid PSO with Naive Bayes and the aim was to analyze the attribute that Causes the disintegration of the online learning environment. The different variables of the class attribute that decrease the accuracy and trustworthiness of the classification model, so they had used hybrid PSO with Naive Bayes as feature selection method and avoiding reduce the accuracy of classification. The experimental result shows that hybrid PSO with Naive Bayes classifier is suitable for these data sets and performed well and the resulting average of all these data vary between 84.2% and 95.9%.
Dehuri, Roy, and Cho (2011) developed a model that help medical experts to identify the diseases prognostic model of metabolic syndrome. An adaptive binary PSO to
learnable Bayesian classification brings a sturdy structure that can be used as a guessing tool in a medical environment and they adjusted weights of learnable Bayesian classification that gives the maximum likelihood accuracy and can be capable of removing less essential attributes that can help medical specialists in identifying the disease. The result of experimental data sets that has been obtained was better than the previous research which is 76.1 to this metabolic syndrome data set.
Saxena and Richariya (2014) projected a means of detecting an intrusion, which is a blend of k-means, PSO and SVM techniques. To improve detection precision, they employed many ways to guarantee the projected approach works as needed. First, they accomplished preprocessing. The researchers trained the data by PSO and to cluster by k-means after they found the subsets of the training data according to the sequence training data they formed the classification which is SVM then PSO was used to ensure if there is detection happened.
Subaira.A.S, Anitha.P, Anjusree.S, and Vinothini.C (2014) suggested the main duty of intrusion detection problems is to classify the behavior of the network as normal or abnormal at the same time minimizing misclassification, their work presented two efficient data mining algorithms that are combined to discover the network intrusion. Combining SVM and Ant Colony (CSVMAC) that used for efficient data classification. The algorithm takes the benefit of the two algorithms simultaneously avoiding their weaknesses. This algorithm is implemented and assessed using KDDCUP99 data set. Experimental results drastically generate well superior results than the other algorithm based on accuracy rate and runtime efficiency, and this algorithm is capable of detecting the new types of attacks.
Many researchers designed enhanced intrusion detection techniques based on improved SVM by merging Principal Component Analysis (PCA) and Particle Swarm Optimization (PSO). The dataset was used for the experiment was KDDCUP99 data set. PCA is an efficient data mining method that is used to minimize dimensionality of the dataset. Then PSO was employed to assign punishment factor C and kernel parameters σ in SVM. The intrusion detection rate 97.7% of enhanced SVM by merging PCA and PSO was higher than those of PSO-SVM 95.6% and that of standard SVM 90.5% (Hui et al., 2011).
Bae, Yeh, Shukran, Chung, and Hsieh (2012) were designed a novel anomaly intrusion detection by using Artificial Bee Colony algorithm. Additionally, they had
compared the proposed anomaly based on network intrusion detection and artificial bee colony with other well-known classification algorithms. The result of the experiment shows that the offered approach of anomaly-based network intrusion detection and artificial bee colony can do better than the different standard classification algorithms. So, they pretended that intrusion detection applied to Naive Bayes algorithm accuracy was 95.5%. The proposed anomaly-based network intrusion detection and artificial bee colony outperformed by minimum 3%. As they had mentioned the proposed approach is able to adjust and detect a new a classification intrusion data.
In a different work, researchers designed intrusion detection methods used to construct an effective network IDS. They combine artificial bee colony algorithm and multi-layer perceptron for intrusion detection systems; the data were classified by normal data and attack using MLP, the model of MLP was built on conditionally to fit attributes of the data set. Moreover, Artificial Bee Colony has been using to improve for training Multiple Layer Perceptron algorithm by enhancing the weights of training data set. On the other hand, the testing and training data set had evaluated the algorithms was NSL-KDD99 which is an upgraded version of old version of KDD99 data. However the result of the proposed approach shows that they found a good result in terms accuracy and error rate which is 87.5% and 0.1% respectively. (Mahmod, Alnaish, & Al-Hadi, 2015).
As reported by Gholipour Goodarzi, Jazayeri, and Fateri (2014) a hybrid SVM and ABC algorithms have been recommended to select features to improve network intrusion detection and increase the precision of results; this study data analysis was used the KDDcup99 dataset. Such that best characteristics are chosen by Support Vector Machine, then chosen characteristics are replaced in the suitable category depending on Artificial Bee Colony algorithm to minimize the search time, increase the quantity of learning and upgrade the authenticity of intrusion detection. The results indicate that the suggested algorithm can detect interrupter of the network precisely as far as 99.7%.
A different researcher designed intrusion detection application system using in mobile ad hoc network. The designed application system is spread, cooperative intrusion detection system establishes on with Particle Swarm Optimization. The model developed incorporate five units. The local data compilation unit records audit data of user and activities of the system. Local detection and evaluation engine will classify the patterns
gained with the attack signatures existing in audit source unit. While cooperative detection and evaluation engine will examine the record and evaluate traces of network, traffic network for possible anomalies if present. The local and global optimization features can be effectively used. Particle Swarm Optimization is the bio-inspired method depend on swarm intelligence a cooperative, distributed and cheap. Intrusion detection system can be built employing PSO to restrict powerful, intrusive attacks in MANET, the application of PSO in various study areas has confirmed that results applying PSO are faster and less expensive if compared with other methods used thus far (Chaudhari & Prasad, 2015).
Looking back at studies that had achieved the highest classification success with decision trees, compared three methods based on for attribute selection of decision trees, flexible Neural Network and Particle Swarm Optimization. As a result of the comparison shows, Decision Trees were the best result among the three methods. The Decision trees classifications result were used KDD CUP99 dataset 99,9% of normal behaviors, 99,9% of DOS attacks, 99,6% of Probe attacks, 88,3% of U2R attacks and 99,0% of R2L attacks (Bahrololum, Salahi, & Khaleghi, 2009).
Al-Saedi, Manickam, Ramadass, Al-Salihy, and Almomani (2013) proposed information-based feature selection model to achieve high detection performance and low error rate in intrusion detection systems. When the proposed model was tested using the KDD CUP99 data, 98.2% of the cases were able to distinguish normal behaviors. 97.2% of DOS attacks, 99.6% Prob attacks, 92.5% of U2R attacks and 99.7% of R2L attacks.
3 MATERIAL AND METHODS
3.1 Machine Learning and History
Machine learning defined as a discipline of two inter-connected questions “how to write programs that enhance their performance automatically at some duties through experience e?”. “what are the basic theoretical rules that control every learning machine without considering whether it is applied in the organization, human or computer?” Machine learning is very crucial in today’s world (Mitchell, 2006). It focuses on both of the fundamental engineering and scientific questions. It shows concept from a heterogeneous set of disciplines such as probability and statistics, philosophy, artificial intelligence, control theory, information theory, computational complexity, neurobiology and psychology (Mitchell, 1997). It has been used many diverse of learning applications such as to learn to recognize the face in images, learning to classify emails as spam, learning to detect intrusion from attackers and so on. Every machine learning problem can be described as the problem of enhancing some performance measure P, when processing some task T, via some type of training experience (Mitchell, 1997).
Machine learning is a branch of artificial intelligence that takes advantage of statistical and computational power to determine complex patterns and making rational decisions (Hall, Dean, Kabul, & Silva, 2014). Another study says machine learning is a subdivision of artificial intelligence that uses algorithms independently to learn information about the data. Machine learning computer systems do not need to be programmed instead it can progress their algorithms, so today machine learning algorithms allow systems to get in touch with humans, self-driving cars, writing match reports and publishing, etc.
Machine learning is to program your computer using sample data or past experiences for performance optimization (Alpaydin, 2014). The machine learning field is interested in how to create computer programs that automatically evolve with experience (Mitchell, 1997). Machine learning algorithms have five application type. They are;
Learning Associations, Classification,
Regression,
Unsupervised Learning,
Reinforcement Learning (Alpaydin, 2014).
When a machine improves its performance with experience, it is assumed that the machine has learned that it requires algorithms and programs that hold the data and reveal interesting or useful patterns (Harrington, 2012). Machine learning algorithms performs predictions for future situations by examining the data from past experiences, based on a mathematical theory (Mitchell 1997) Machine learning is the simplest way to predict the future from past experiences (Daumé III, 2012; Hall et al., 2014). Machine learning is used to solve many different problems such as, optical character detection, face recognition, spam email filtering, speech language comprehension, medical diagnosis, customer segmentation, fraud detection and weather forecast (Schapire, 2008). In the literature, learning strategies used in machine learning are classified in different ways (Camastra & Vinciarelli, 2008).
3.1.1. Supervised learning
Supervised learning is a model of learning in which the learners receive a set of labeled examples of training data and predictions for points they have not seen before (Mohri, Rostamizadeh, & Talwalkar, 2012). The aim is to be able to produce a concise model expressing the distribution of class labels in the data as predictor features (Kotsiantis, Zaharakis, & Pintelas, 2006). As understood from the name of supervisor learning, the learning work is carried out with the help of a supervisor. These consultants, in machine learning definition also refers to frequently used data or past experience, each instance of the data that is included in the input-output values is recognized as labeled. Supervised machine learning steps were applied to a real-life problem can be traced (Kotsiantis et al., 2006).
Supervised learning as the name indicates the presence of supervisor as coach. Supervised learning is learning in which we teach or train the machine using data which is well labeled that means some information is already tagged with the correct answer. After that, the system is provided with the new set of examples like data, so that supervised learning algorithm studies the training data the set of training examples and produces a correct outcome from labeled data. Supervised learning problems can be further grouped into regression and classification problems. Learning method of machine learning is divided into two parts: In the supervised learning, we have an input of X and an output of Y; then we take an algorithm to study the function from input (X) to output (Y) as shown Equation 3.1.
Y = f(X) (3.1)
The aim is to estimate the corresponding function, so that when we have new input data that we can predict the output of that data. That is called as supervised learning because we can think the process of the learning algorithm from training dataset as an instructor who is supervising the learning process. So, we know the correct responses, the algorithm repeatedly predicts on the training dataset and is validated by the instructor. The learning finishes when the algorithm successes an acceptable level of performance. Supervised learning is grouped into two groups; classification and regression. Classification: the output is categorical variable like “normal” or “anomaly”. Well-known methods are Decision trees, Support vector machine (SVM), k-Nearest Neighbors, Naive Bayes and Random forest for classification. Regression: the output is a real value like “weight,” “currency” and etc. Most well-known methods are Logistic Regression, Linear regression, polynomial regression, Random forest for regression and SVM for regression (Kotsiantis, Zaharakis, & Pintelas, 2007).
3.1.1.1 Decision trees
Decision trees are an estimation technique used in the classification, clustering and prediction models, used to divide problem-related the research area into subgroups. Sample of decision trees structure as shown Figure 3.3. The root and each node are labeled with a question, branches separated from nodes indicate possible answers to the problem. Each leaf node also represents an estimate of the solution of the problem (Tan, Steinbach, & Kumar, 2006). The main algorithm for construction decision trees is named ID3 by (Quinlan, 1986) which uses a top-down, greedy search throughout the hole of possible parts without backpedaling. ID3 uses Entropy and Information Gain to build a decision tree. A decision tree is set up top-down from the base node and develops separating the information into branches that consist of for instance with same homogenous or same importance. ID3 algorithm uses entropy to accumulate the homogeneity of a sample whether the sample is definitely homogeneous the entropy is zero and if the sample is an equally separated it has entropy of one. To construct a decision tree, it is important to calculate two kinds of entropy by using frequency table.
a) Entropy using the frequency table of one attribute b) Entropy using the frequency table of two attributes
The information gain is related to reduce in entropy after a dataset is split on an attribute. Building a decision tree is about obtaining attribute that returns the highest information gain. Several statistical algorithms for constructing decision tree are obtainable including Classification and Regression Trees (CART), C4.5, Chi-Squared Automatic Interaction Detection (CHAID) and Quick, Unbiased, Efficient, Statistical Tree (QUEST). Decision tree aspects of all actions of the potential problems, the decision maker problem can be defined in an easy-to-understand format through the use of geometric symbols such as lines, squares, circles, evaluating all possible factors that may be influential to the directions of actions and each likely result based on all these factors. According to this
definition, the decision tree has various kinds of accomplishment decisions; it can be said that it includes the results of different factors and actions. In Figure 3.1 a sample decision tree structure given.
Figure 3.1 sample of Decısıon Tree structure
3.1.1.2 Naive Bayesian Method
The Bayesian theorem is an important issue that is examined in the theory of probability. This theorem shows the relationship between conditional probabilities and marginal probabilities for a random variable within a probability distribution. With this form, the Bayesian theorem explains a relationship that is accepted by all statisticians, for this concept, Bayesian rule or Bayesian law names are also used some of the statisticians. The Bayesian theory also carries a special emphasis. On the philosophical basis, Bayesian theorem is a fundamental mean for updating and changing the subjective beliefs about the value of probability in the light of new evidence, according to an objective feature but as a subjective value of the observer. Naive Bayesian is an estimator and a descriptive classification algorithm that analyzes the relationship between the target variable and the independent variables (Ceci, 2005).
conditional an event (that is, the A event when B event is known) is conditionally different from the probability value for event B (that is B event when A event is known). However, there is a particular relationship between these two different conditions, and this relationship is called the Bayesian Theorem (first explained by English statistician Thomas Bayes 1702-1761) (Stigler, 1982).
In recent years, the use of the Bayesian approach has been increasing. Because of increase in data analysis. Bayes theorem revealed by Thomas Bayes in 1763 is the basis of this method. Many researchers such as Jeffrey’s de Finette, Savage and Lindley have found to the development of Bayesian analysis. However, according to the subjectivist model, the probability is the subjective uncertainty of the observer. For this reason, the probability value is subjective and is believed that the new evidence can be changed as it arrives regarded as the cornerstone of the study (Jatana & Sharma, 2014).
Although some associations and dependencies between attributes cannot be shown, Bayesian decision making has proved to be quite satisfied in many classification problems. Naive Bayes calculates the number of times each output appears on the learning set during model learning. This value is called prior probability. For example, a bank wants to group their credit card applications into "good" and "bad" of risk classes. If the output comes in 2 times in total 5 cases, the prior probability for good in risk is 0.4. For this reason, if nothing is known about the person applying for a credit card, that person is at 0.4 probability for good in risk class, Naive Bayes at the same time each independent/dependent variable finds the frequency of the combination of the variables. These frequencies have prior used in the prediction by combining (Ceci, 2005).
3.1.1.2.1 Naive Bayes Method's Main Idea
Uncertainty has taken up a great deal of space in human life, and this ambiguity is the lack of information depending on the past or unrealized circumstances. In daily life, the use of intellectuals and intuitions can be used for scientific purposes. Scientific studies of such occurrences of Bayesian approach emerges as an alternative use of probability. The main idea of classifying Naive Bayes classification algorithm is usually a hypothesis that is used to calculate posterior probabilities and relates the conditional probabilities of two
random events. It is a theorem based on posterior probability principle (Panda & Patra, 2007). One of the most straightforward classification models to build is Naive Bayes classification algorithm which uses the independence assumption between variables, so it defines the probability of attributes does not affect the probability of another attribute. It is a theorem based on posterior probability principle. The Naive Bayes classification is one of the probability methods that predict the instances of the class that has the highest probability; there is an online learning situation in Naive Bayes called incrementally and each training example increases or decreases the likelihood that a hypothesis is correct. Preliminary information can be combined with observed data (Mukherjee & Sharma, 2012).
3.1.1.2.2 Working Structure of Naive Bayes
The Naive Bayesian approach is the conditional probabilities of two random phenomena which are used to calculate the probabilities. It is a theorem based on Maximum probability principle. In this case, the Bayesian Theorem can be used to
calculate the accuracy of the probabilities A and B to get a random event the Naive Bayes
classification is one of the probability methods that predict the instances of the class that has the highest probability and it works as flows. Let A and B be random events.
| | (3.2)
P (A) = Independence probability of event A P (B) = Independence probability of event B
P (B|A) = the probability of event B when event A is known (“Likelihood, Conditional Probability”) P (A|B) = the probability of event A when event B is known (“Posterior, Posterior Probability”). The Naive Bayes classification is one of the probability methods that predict the instances of the class that has the highest probability and it works as flows. Assume that A and B to be random events.
| | (3.3)
In the Naive Bayes formula, the data set represented as n x m vector where n is the attributes and m are the number of classes. Let’s D = , , … , is a given data that
need to classify. The method calculates that D goes to the class having the maximum posterior probability which is conditioned D. Particularly when the classification data D belongs into and P ( | D) > P ( | D) and we can use binary classification that can be the class label and we use is not equal and | determined using Bayes theorem:
| | (3.4)
It’s only to get the maximum probability of the class. To get the class most substantial, prior probability is total number of training data of class divided by the sum of total training data set. If the probability of class is mysterious or unknown it is generally taken that the probabilities of those classes are equal, generally, the training data is used to get the necessary probability.
3.1.1.3 Feature Selection
So many studies displayed that feature selection is one of the main important methods of intrusion detection because of a large number of attributes that can be found for intrusion detection. Which features are useful? Which is less important? Which feature is useless? These questions are a proper question because removing unnecessary features improve the accuracy of detection simultaneously speeds up the computations. Feature selection is an efficient way to choose best features which actually can enhance the performance and quality of identifying attacks by classification; feature selections are significant subject in intrusion detection.
3.1.1.3.1 Feature Selection Methods
There are many types of feature selection methods like wrapper and filter methods, so when someone is talking about these methods, the filter method is independent of the classification algorithms, while the wrapper method needs to use classification algorithms to assess the best features that selected during the process of feature selection. The task of feature selection is challenging because of search space is large. It can cost computationally high, the interactions of the features. Additionally, many existent feature selections
methods had problems such as high cost of computational that affects the classification accuracy, so to overcome these difficulties many researchers needed the evolutionary computational methods like Particle swarm optimization which is a nature-inspired algorithm that computationally less and has the power to converge fast comparing the other methods.
Binary PSO was applied many areas including feature selection although it had not investigated thoroughly. The overall goal of Binary PSO in this thesis is for feature selection to achieve a good classification performance. Binary PSO was used as a feature selection because of the large features of the data, to reduce those features of the data BPSO become the candidate of this situation, after the decreasing features that selected BPSO and Naive Bayes classifies. Sometimes classification models frequently have an enormous number of features. Nonetheless, all of them are not used for the classification algorithm.
3.1.1.3.2 Particle Swarm Optimization
The authors of Particle Swarm Optimization algorithm Kennedy and Eberhart considered while proposing this algorithm to combine a group of behavior such as human decision and the model.The bird's flight towards forage behavior and they also considered the manner of searching forage. In the algorithm it has what is called “Particle”, it is the operation of making each solution of the optimization problem in exploring a bird in space, all particles have a value which is measured fitness function, it also has a speed that is responsible the direction of the object flights and its distance.
Similarly, PSO uses like other evolutionary algorithms the concept of grouping and evolution. PSO works according to individual fitness value, and it is not same like the different evolutionary algorithms when it comes how to use the evolutionary operators, instead of assuming as n-dimensional search space not considering weight and volume of the particles and constant flight speed in a searching space. There are two main flight types individual and group flight experience so that the flight speed can be dynamical.
The PSO works like this first it starts with a group of the random particle, or we can call random solution, it focuses on iteration to obtain the optimal solution this solution
called individual extremum. There is another solution for the entire population; it has contact with the present this is called global extremum. In addition to this, the selection of the global as the particles neighbors in all neighbors is known as local extremum. So the PSO has the same mechanism for birds, this mechanism is complete movement from disorder to order in solving problems and to get a suitable solution and here is the equation of particle swarm optimization algorithm.
1 (3.5)
1 1 (3.6)
The above equations (3.5) and (3.6), the lowercase letter j is dimension of a particle, i represents particle i and t represents t generation, c1 is cognitive learning factor, c2 is social learning factor, both c1 and c2 starts from 0 to 2.0 we can say that c2 and c2 have the similar values the particles in the search for itself. Also, the social feature has the ratio, r1 ~ U (0, 1) and r2 ~ U (0, 1) this are two functions that are independent one another. The loop of the PSO is finished when the maximum of generation is reached, so, such this circumstance is known as continuous PSO according to this study.
3.1.1.3.3 Binary Particle Swarm Optimization (BPSO)
Kennedy and Eberhart (1995) invented BPSO (binary particle swarm optimization) algorithm the aim of the proposed algorithm is feature selection; we have some values such as is “0” or “1” this value is determined considering the sigmoid function.
1 1 1
0 (3.7)
Then = 1 else is “0” if 1, 2, . . . . n dth feature is chooses, otherwise dth feature is not chosen at Particle i, so the random values are between “0” and “1”. The aim using BPSO is to select the best feature subset. In this type of PSO, every solution that is in the population is a binary string. Every binary string belongs to dimension n which is calculated to give parameter values (Khanesar, Teshnehlab, & Shoorehdeli, 2007).
In the binary PSO, every binary string designates a particle. Strings are upgraded bit-by-bit depending on its current value, the value of that bit in the best (fitness) of that particle experienced so far and the best value of that bit to date of its neighbors. In the case of binary strings, neighbors can be picked in one of the various ways. There are some examples: for the size k binary of a neighborhood is the minimum of hamming distance. For Hamming distances that are equal, the options are arbitrary at the starting point, arbitrarily designate groups of k strings to neighborhoods. Allow the neighborhood number be the population number. PSO describes the whole thing according to the velocity.
In BPSO, how does one describe a velocity for a single bit? In most cases the velocity is defined as a probability of the bit changing, this will observe in a minute how this works, as just mentioned. In BPSO, bit-by-bit upgrades are performed as probability, in other words, for a selected bit (d) in a selected string (i), it is changed to a 1 with a probability (P), which is a function of its inclination to be a 1. The best value of itself so far, and the finest value of its neighbors. 1-P is the probability of changing to a 0 once P is determined, this produces a random number R, and if R<P, then the bit becomes a 1; otherwise, it becomes a 0. The formula for an individual bit’s upgrade is:
) , ), 1 ( ), ( ( ) 1 ) ( (xij t f xij t vij t pij pgj P (3.8)
The function P is a probability, and thus once this value is calculated for a given particle bit, we must produce a uniform random number to see whether it should be a 1 or a 0. P ( = 1 is the probability that an individual will choose 1 for the bit of the dth position in the bits, so is current situation of the bit string i at bit d also is the measurement of strings present probability to choose 1 is the best situation experienced so far for bit dth individuals example 1 or 0 is 1 or 0 which depends on the value of bit dth so far in the best neighbor. The challenge is to come up with the f (p). The value of decides a string’s inclination to select 1 or 0. Higher values of
signify that it is more likely to select a 1, similarly for lower values selecting a 0. For the functionP(xij(t)1) f(xij(t),vij(t1),pij,pgj), by stating that this probability is a function of the bit’s present value, it’s “velocity” and the values of the best to date for the bit and best to date for the neighborhood. Keep in mind, best to date for a bit is simply a 0
or a 1. Since f will be a probability value, we know it must range between 0 and 1. There are various measures or expressions employed for f, one that is usually employed is the sigmoid function. )) 1 ( )( ( )) 1 ( )( ( ) 1 ( ) ( 1 1 )) ( S(v 2 1 ) ( id t x p t x p t v t v e t id gd id id id id t vid (3.9) 1 1 1 0 (3.10) 3.1.1.3.4 Implementation of PSO
These are random numbers
1and
2designate various random numbers drawn from uniform distributions. Sometimes these parameters are selected from a uniform distribution 0 - 2, such that the addition of their two limits is 4.0. As an example, let’s say that we are handling a population of 5-bit binary particles and a population of 4 particles (Khanesar et al., 2007).a) 10101. b) 01011. c) 11100 d) 01101. By upgrading particle b (01011), bit 3 (0) also, we will presume that the present propensity (velocity) of this bit to be a one is 0.25. Also, presume that the best value of this particle (to date) was 00100 and the best value of the entire population (to date) was 01111
7 . 1 5 . 2 1 p 1 p 0 ) 1 ( x 0.25 ) 1 ( 2 1 g3 23 23 23 t t v 988 . 0 1 1 )) ( ( 45 . 4 ) 0 1 )( 7 . 1 ( ) 0 1 )( 5 . 2 ( 25 . 0 ) ( )) 1 ( )( ( )) 1 ( )( ( ) 1 ( ) ( 45 . 4 23 23 2 1 e t v f t v t x p t x p t v t vid id id id gd id (3.11)
At present, with the value of f, produces a random number, and if it is smaller than f, then bit x becomes a 1. Alternatively, it becomes a 0. At times the v value is restricted so that f does not come nearer or too close to 0.0 or 1.0. In this condition, constant parameters [Vmin, Vmax] are used. When Vij is > Vmax, Vij is set to Vmax when Vij is < Vmin, Vij is set to
Vmin. There are a few things that need to be initialized. First initial population (particle) values just randomly produce binary strings, so initial velocities can be produced as in Equation 3.12.
0 ∗ (3.12)
Where rand () is a random number chosen from a uniform distribution on [0, 1]. Major problems with binary PSO Parameters of the binary PSO the effects of these parameters are the opposite of those for the actual valued, PSO values of w < 1 hinders convergence. For values of −1<w <1, vij becomes 0 over time for w < 1 it has memory of BPSO.
3.1.1.4 Binary Particle Swarm Optimization with Naive Bayes(BPSO-NB)
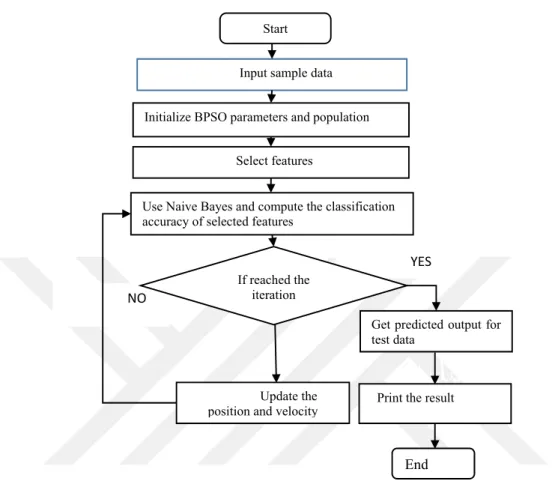
BPSO-NB, it is selected because of its search capability and also its search process there is fitness function to examine other subsets of attributes into Native Bayes classification accuracy, an individual with the highest classification accuracy was chosen. When the program starts, it firstly takes input data then initializes the BPSO parameters and population by conversion to binary. After that, it selects the features and uses Naive Bayes to compute the classification of selected features.
If iteration of the program does not exceed then update the position and velocity of BPSO and again Naive Bayes is used to computing the classification of selected attributes. It will continue until the iteration finishes. When iteration exceeds its maximum then the program takes the predicted output for test data afterward it prints the final result as shown Figure 3.2.
3.1.1.4.1 The Proposed Methods of BPSO-NB
Figure 3.2 flowchart of BPSO and Naıve Bayes
3.1.1.5 Random Forests
The Random forest method is a common learning method developed by (Breiman, 2015). Decision trees are formed during the training of the forest, and the class that takes the most votes from the individual trees is determined as the decision class. Random vectors are generated to form each tree in the community. The first example of this is the bagging method in which random selection is made from the samples in the training set to form each tree. Another example is the choice of casual splitting among the K best divisions in each node (Dietterich, 1999).
Another approach is to create a training set of random weight sets over the samples in the training set (Ho, 1998), a random subset of the random subset of attributes used to construct each tree published several articles on space selection method. In the same way
NO
YES Start
Input sample data
End Initialize BPSO parameters and population
Use Naive Bayes and compute the classification accuracy of selected features
Select features
Update the position and velocity
Get predicted output for test data
Print the result If reached the
(Amit & Geman, 1997), they have identified numerous geometric features on a set of typographical characters, and have investigated random selection to ensure the best division at each node. These studies have been influential on Breiman's discovery of the random forest method (Breiman, 2001).
3.1.1.5.1 Overview of Random Forest Management
Random forest is a classifier consisting of a collection of structured tree classifiers
in the form {h (x, θk), k = 1}. Where {θk} consists of random vectors randomly distributed. Here, the randomly generated θk for each k tree is independent of the previous θ1, ..., θk-1 random vectors, but has the same distribution. After a large number of trees have been created, each tree votes a class for any x entry. The class with the highest number of votes is the decision. In the random forest algorithm, two parameters must be specified by the user to generate the trees in the forest in the training dataset. These parameters are the number of trees to be created (n) and the number of variables (m) to be used at each node to determine the best partition.
Bradley Efron first proposed the boot method in 1979 (Singh & Xie, 2008). It is possible to substitute each time from the data in the existing data set to select different instances and create a new dataset. This is the method of booting to develop new datasets. In the random forest algorithm, pre-boot sampling is performed from the training data set up to the number of trees determined by the user. 2/3 of the generated sample is classified as in bag data to create the trees in the forest, 1/3 is classified as Out of Bag data to calculate the error rate of the installed model.
3.2 Unsupervised Learning
In unsupervised learning, there is no supervisor and there is only input data. The aim is to find the regularities in the input. (Alpaydin, 2014). Here the task of computer is to group unclassified data according to correlations, patterns and differences without any previous training of data. It is not like supervised learning; no teacher is given that means no training will be given to the computer. For this reason, the machine is assigned to find
the hidden structure in unlabeled data by itself. Unsupervised can be categorized like clustering and reduce dimension (Celebi & Aydin, 2016).
3.3 Experimental Materials
3.3.1. KDD CUP99
The most challenging step in determining the performance of intrusion detection systems is to obtain valid and appropriate data sets. The data received from the internet does not contain general information about the existence of the attack. The characteristics of attack or information for the attack can be achieved through network monitoring. In general, network monitoring can be seen as costly and unnecessary work. However, gathering data from a network or computer systems is now an inevitable process for networks or computer systems to work, because this process is somewhat costly, some network engineers want to run the network or systems smoothly using artificial data. But it is difficult to prove that artificially is like internet traffic. It is difficult to find data sets with specific types of attacks and to define and simulate network traffic, despite the challenges mentioned above, valid data sets are needed to test intrusion detection systems. In general, a network traffic can be observed using a sniffer. However, observing only network packets may not give general information about network traffic. Despite these disadvantages, there are several data sets developed for the testing of intrusion detection systems. Some of these are KDD CUP99, DARPA 1998, DARPA 1999, UNM, SSCNNJU, CUCS, windows system and network tcpdump datasets (Çetin & Yıldız, 2014).
The KDD CUP99 and DARPA datasets are the most preferred data set in intrusion detection studies (Tavallaee, Bagheri, Lu, & Ghorbani, 2009). The KDD CUP99 database consists of approximately five million records, represented by 41 qualities, containing four types of attack types under simple, content, time-based traffic and host-based traffic. KDD and DARPA data are a simulation dataset designed to have a similar structure to the US Air Force network, the attack types in the dataset are as follows.
Denial of Service Attacks (Denial of Service-DOS): is to render a server, service, or network unserviceable by exploiting the weaknesses in the operating system or application
that are caused by the structure of the TCP / IP protocol (Kendall, 1999). Information Browsing Attacks (Probe): It is an attack to learn the current IP addresses of a server or any network, the number of computers on the network, the number of users in the computer and user information, active ports or operating system (Kendall, 1999). User to Root (U2R): is an attacker that do not have administrator rights and wants to gain administrative rights of a user who has access to the system (Kendall, 1999). Remote to Local-R2L: Attacks to gain access as a guest or another user on computers in the target network, even if they do not have user rights on the system (Pathan, 2014).
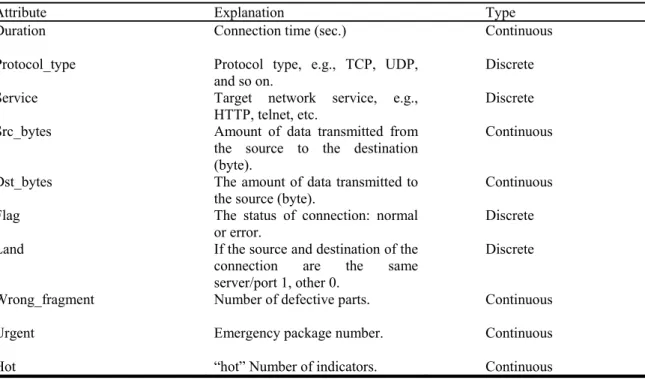
The attributes, descriptions, and type used in the KDD CUP99 dataset are as shown in Table 3.1. One or more information’s are needed for continuous type, while the discrete type attribute can be obtained from packet information in a single network. Continuous type attributes may be identified by a single session information or may require information from previous sessions. Two different memory structures are used to hold previous session information. In the initial memory structure, sessions are held in t seconds. In the second structure, the last n session information is stored. These memories enable the system to obtain more general information about computer network traffic (Can, 2007).
Table 3.1. The attributes descriptions, and type used in KDD cup99 dataset (Can, 2007)
Attribute Explanation Type
Duration Connection time (sec.) Continuous
Protocol_type Protocol type, e.g., TCP, UDP, and so on.
Discrete Service Target network service, e.g.,
HTTP, telnet, etc.
Discrete Src_bytes Amount of data transmitted from
the source to the destination (byte).
Continuous
Dst_bytes The amount of data transmitted to
the source (byte). Continuous Flag The status of connection: normal
or error.
Discrete Land If the source and destination of the
connection are the same server/port 1, other 0.
Discrete
Wrong_fragment Number of defective parts. Continuous
Urgent Emergency package number. Continuous