1
ECONOMIC GROWTH AND PUBLIC DEBT IN THE ECONOMIC GLOBALIZATION ERA:
AN EMPIRICAL INVESTIGATION OF DEVELOPING COUNTRIES
Barış KABLAMACI
11
İstanbul University, The School of Economics, Department of Economics, İstanbul
[email protected]
Abstract
This paper empirically examines the causal relationship between public debt and economic growth in a sample of the 72 countries consisting of less developed and developing, country-by-country, in the period of 1970–2015. I apply the Toda-Yamamoto augmented Granger non-causality testing procedure. I observe a significant causality from economic growth to the public debt of a country in twenty-one countries. In fifteen countries, there is a unidirectional causality running from the public debt to economic growth. I find bi-directional causality in only nine countries and no causal relation in twenty-seven economies.
Keywords: Public debt, Economic growth, Causality analysis.
KÜRESELLEŞME ÇAĞINDA EKONOMIK BÜYÜME VE KAMU BORCU:
GELIŞMEKTE OLAN ÜLKELERE DAIR BIR INCELEME
Özet
Bu çalışma, 1970-2015 yılları arasını kapsamak üzere 72 az gelişmiş ve gelişmekte olan ülkenin, kamu borcu ve ekonomik büyüme arasındaki nedensellik ilişkisini ampirik olarak incelemektedir. Toda-Yamamoto genişletilmiş Granger nedensellik analiz testi uygulanmıştır. Yapılan analize göre, 21 ülkede ekonomik büyümeden kamu borçlanmasına doğru, 15 ülkede kamu borçlanmasından ekonomik büyümeye doğru, 9 ülkede karşılıklı bir nedensellik ilişkisi tespit edilmiş ve 27 ülke ekonomisi için kamu borçlanması ile ekonomik büyüme arasında herhangi bir nedensellik ilişkisi gözlemlenmemiştir.
Anahtar Kelimeler: Kamu borcu, Ekonomik büyüme, Nedensellik analizi.
1. INTRODUCTION
In the 1980s, many developing countries experienced major macroeconomic problems regarding
increasing fiscal deficits and realized the importance of the fiscal balance in their economies. Since then,
the sustainability of public debt became an important issue in the global economy according to the
adjustment programs that profoundly affect potential interactions of monetary and fiscal policies.
Many scholars have investigated the relationship between public debt and economic growth to determine
the influence of fiscal and monetary policies on the sustainability of debt and growth in various economies
with different development levels. In a pioneering study, Barro (1979) presented the importance of fiscal
2
policies, considering taxes and government spending for achieving the debt sustainability. According to
his analysis, public debt is also vulnerable to high inflation and the structure of debt generates its effects
depending on whether the country is in war or peacetime.
The empirical analysis between public debt and economic growth has been examined with regards
to the effects of fiscal policies on macroeconomic variables in the current literature. However, these
analyses applied correlation techniques with ambiguous results and lack of evidence for various countries
related to their different economic levels. This paper empirically investigates the causal relationship
between public debt and economic growth in 72 countries given their level of economic level. This
study contributes to the existing body of literature by analyzing the causal linkage between public
debt and economic growth in less developed and developing countries for the period of 1970–2015,
country-by-country. Therefore, the econometric methodology applied in this work provides additional
empirical evidence on the causal relationship between public debt and economic growth in a global
point of view for policymakers.
I observe a significant causality from public debt to economic growth in fifteen countries. In twenty-one
economies, there is unidirectional causality from economic growth to public debt. I also find bidirectional
causality in only nine countries.
The remainder of the paper is organized as follows. Section 2 summarizes the literature on economic
growth and public debt. Section 3 describes data and presents the model and methodology of the
Toda-Yamamoto Modified Wald causality framework. Section 4 provides the empirical findings. Section
5 presents concluding remarks.
2. LITERATURE REVIEW
The existence and the direction of the causal relationship between public debt and economic growth
identify the influence of fiscal and monetary policies on the macroeconomic environment of a country.
While the causality running from public debt to economic growth presents the change of aggregate
demand, capital inflows, interest rates that could cause either a reduction or a boost in the GDP (UN, 2002;
Kim et al., 2017). On the other side, economic growth could generate public debt according to the pace
of growth rate whether it is persistent or transitory. According to Alesina and Perotti (1997) expansionary
fiscal adjustments are generally conducted with spending cuts, especially on government wages and
transfers, while contractionary fiscal adjustments are denoted by tax increases.
While expansionary fiscal policies improve the economic growth in the short run, also lead to a reduction
in the growth by increasing the level of debt in the long run. These policies could become contractionary
if they are applied in the recession period of the economy.
Public debt can restrain the growth in the long run through the weakening of the market economy by
choice of increasing taxes by the government may lead to a reduction in the disposable income and
saving. In order to compete with private financial borrowers for a fixed supply of savings in the market
the significant necessary of borrowing of the government cause crowding out of the private investment
3
that finally public debt generates spiking interest rates associated with the rising cost of capital and
reduce total investment in the economy (Egert, 2013). However, these conditions could easily evolve to
currency risk and turn into a financial crisis (Hemming et al., 2003).
The increase of the public debt generate a negative impact on capital stock, productivity and finally
reduce economic growth related to the high-interest rates (Gale and Orszag, 2003; Baldacci and Kumar,
2010; Kumar and Woo, 2010), disruptive tax policies (Barro, 1979; Dotsey, 1994), high inflation rates (Barro,
2013), uncertainty and vulnerability to economic shocks and political risks of the country. Further, the
failure in the financial markets associated with the outflow of capital from the country and the probability
of currency risk spill over into the real sector and trade markets resulting with a fall in economic growth.
Panizza and Presbitero (2014) show that while there is no causal effect of the public to economic growth in
the sample of OECD countries. The current literature provides that high debt/GDP levels, which is around
90 percent and above, implies a turning point of an economy that begins the slowdown of the economic
growth (Reinhart and Rogoff, 2010; Kumar and Woo, 2010; Cecchetti et al., 2011) for both emerging
and advanced economies. In addition, Reinhart et al. (2003) find that having much lower external debt/
GDP levels are associated with adverse outcomes for the growth of emerging countries. As economies
reach their ceilings of debt tolerance, interest rates could make a sudden increase, which may cause to
a painful adjustment.
Although the budget deficits of governments also have major fiscal consequences that could turn into a
debt crisis in order to correct macroeconomic disturbance of the economy, the change in the economic
growth either positive or negative, induce public debt through both positive and negative fiscal policies
associated with a macroeconomic imbalance. According to Easterly (2001), the permanent reduction of
economic growth has the same influence of a negative fiscal shock leading to the budget deficit and
higher public debt. On the other hand, the increase in the growth leads to a budget surplus and reduction
in the public debt.
3. DATA, MODEL AND METHODOLOGY
3.1. Data
This paper empirically examines the causal relationship between economic growth and public debt,
focusing on 72 selected less developed and developing countries from 1970-2015, individually. The
determination of countries is based on continuous data availability for the period under consideration.
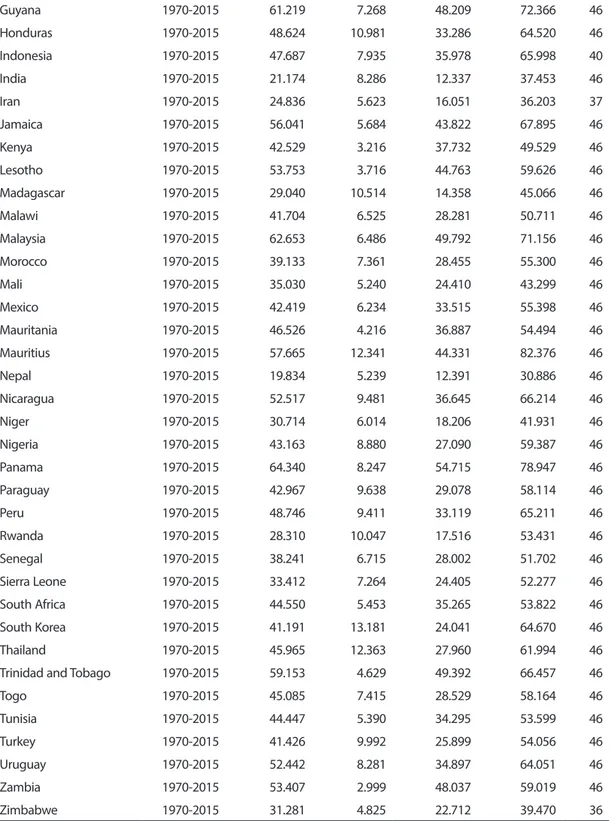
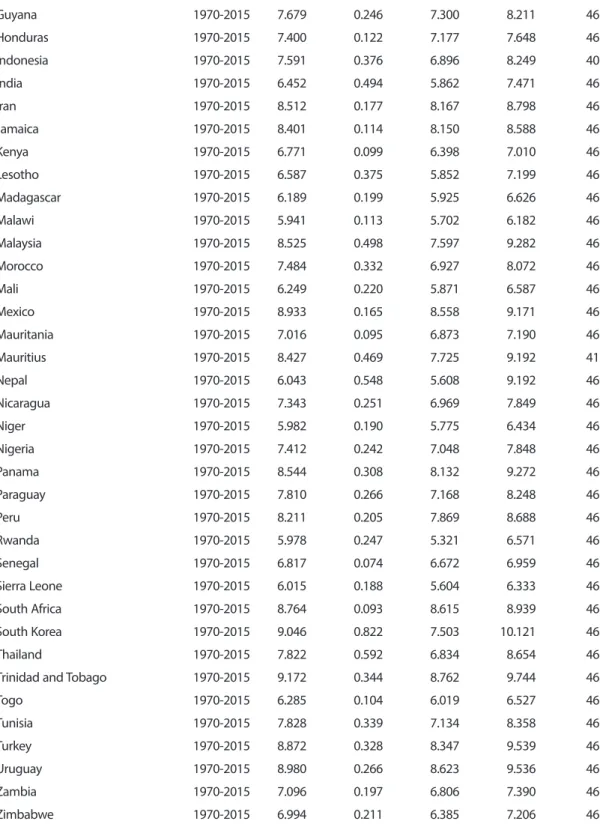
The selected countries considered in the paper are listed in Table 4 in the appendix. I employ data
on public debt, which presents the gross government debt–to–GDP ratios. Data is obtained from the
Historical Public Debt Database, IMF, 2018. Economic growth is calculated from natural logarithm of
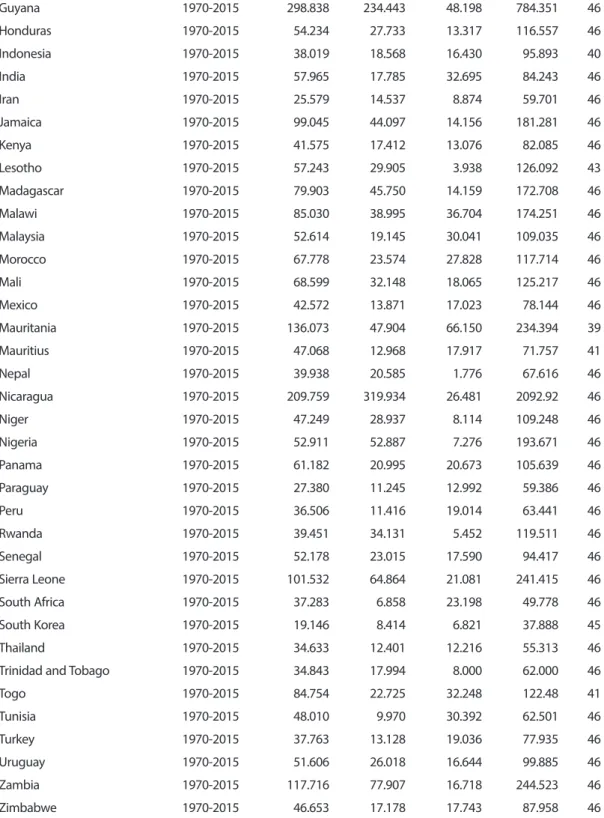
GDP per capita data and is obtained from World Bank Indicators, World Bank, 2018. Besides, I also utilize
the KOF economic globalization–an overall index that involves trade and financial globalization. Data
is obtained from the Swiss Federal Institute of Technology Zurich (Dreher, 2006; Dreher et al. 2008)
and denoted by Ecog. Tables 1 to 3 show the descriptive statistics of the series, which are employed
in the study.
4
Country Time Interval Mean Std. Dev. Minimum Maximum Obs.
Algeria 1970-2015 32.836 5.214 21.575 42.345 46 Albania 1970-2015 38.629 12.294 28.720 64.161 45 Angola 1970-2015 48.152 8.209 36.246 62.274 41 Argentina 1970-2015 39.685 7.485 27.262 53.002 46 Burundi 1970-2015 20.747 4.255 14.760 28.566 46 Benin 1970-2015 30.662 5.184 20.912 39.985 46 Burkina Faso 1970-2015 30.932 4.546 26.087 44.485 46 Bangladesh 1972-2015 18.455 5.127 10.219 26.910 44 Bolivia 1970-2015 47.460 6.978 37.570 58.804 46 Brazil 1970-2015 35.251 7.054 25.563 46.692 38 Barbados 1970-2015 51.827 1.780 47.980 56.527 46 Bhutan 1970-2015 34.182 3.387 30.360 44.364 46 Botswana 1970-2015 64.302 4.202 55.358 70.455 46 Bulgaria 1970-2015 57.898 10.035 44.529 78.057 46 Cape Verde 1970-2015 48.872 4.820 38.294 57.988 41 Cameroon 1970-2015 32.282 3.048 25.541 37.725 46
Central African Republic 1970-2015 24.291 3.285 18.791 31.561 46
Chad 1970-2015 23.865 7.288 10.488 36.560 46 Chile 1970-2015 51.498 13.693 29.229 74.766 46 China 1970-2015 32.900 8.093 18.901 44.289 32 Dem.R.Congo 1970-2015 25.280 7.075 15.115 36.811 46 Rep. of Congo 1970-2015 45.316 8.135 33.177 55.559 45 Colombia 1970-2015 34.439 6.488 25.355 46.383 44 Comoros 1970-2015 40.769 1.792 37.069 43.808 34 Costa Rica 1970-2015 55.800 9.001 44.069 72.436 46 Dominican Republic 1970-2015 40.376 11.260 24.779 59.353 46 Ecuador 1970-2015 40.540 5.933 30.580 52.777 45 Egypt 1970-2015 46.288 7.239 32.322 60.613 46 El Salvador 1970-2015 51.166 8.108 41.501 64.566 44 Ethiopia 1970-2015 21.094 4.156 15.074 29.273 35 Fiji 1970-2015 46.709 2.372 42.373 52.043 46 Gabon 1970-2015 46.420 2.589 40.058 51.545 46 Ghana 1970-2015 36.904 8.939 23.572 52.495 46 Gambia 1970-2015 48.882 5.094 39.681 57.934 42 Equatorial G. 1980-2015 59.019 3.695 51.502 66.543 36 Guatemala 1970-2015 40.883 11.068 25.127 59.783 46
5
Guyana 1970-2015 61.219 7.268 48.209 72.366 46 Honduras 1970-2015 48.624 10.981 33.286 64.520 46 Indonesia 1970-2015 47.687 7.935 35.978 65.998 40 India 1970-2015 21.174 8.286 12.337 37.453 46 Iran 1970-2015 24.836 5.623 16.051 36.203 37 Jamaica 1970-2015 56.041 5.684 43.822 67.895 46 Kenya 1970-2015 42.529 3.216 37.732 49.529 46 Lesotho 1970-2015 53.753 3.716 44.763 59.626 46 Madagascar 1970-2015 29.040 10.514 14.358 45.066 46 Malawi 1970-2015 41.704 6.525 28.281 50.711 46 Malaysia 1970-2015 62.653 6.486 49.792 71.156 46 Morocco 1970-2015 39.133 7.361 28.455 55.300 46 Mali 1970-2015 35.030 5.240 24.410 43.299 46 Mexico 1970-2015 42.419 6.234 33.515 55.398 46 Mauritania 1970-2015 46.526 4.216 36.887 54.494 46 Mauritius 1970-2015 57.665 12.341 44.331 82.376 46 Nepal 1970-2015 19.834 5.239 12.391 30.886 46 Nicaragua 1970-2015 52.517 9.481 36.645 66.214 46 Niger 1970-2015 30.714 6.014 18.206 41.931 46 Nigeria 1970-2015 43.163 8.880 27.090 59.387 46 Panama 1970-2015 64.340 8.247 54.715 78.947 46 Paraguay 1970-2015 42.967 9.638 29.078 58.114 46 Peru 1970-2015 48.746 9.411 33.119 65.211 46 Rwanda 1970-2015 28.310 10.047 17.516 53.431 46 Senegal 1970-2015 38.241 6.715 28.002 51.702 46 Sierra Leone 1970-2015 33.412 7.264 24.405 52.277 46 South Africa 1970-2015 44.550 5.453 35.265 53.822 46 South Korea 1970-2015 41.191 13.181 24.041 64.670 46 Thailand 1970-2015 45.965 12.363 27.960 61.994 46Trinidad and Tobago 1970-2015 59.153 4.629 49.392 66.457 46
Togo 1970-2015 45.085 7.415 28.529 58.164 46 Tunisia 1970-2015 44.447 5.390 34.295 53.599 46 Turkey 1970-2015 41.426 9.992 25.899 54.056 46 Uruguay 1970-2015 52.442 8.281 34.897 64.051 46 Zambia 1970-2015 53.407 2.999 48.037 59.019 46 Zimbabwe 1970-2015 31.281 4.825 22.712 39.470 36
6
Country Time Interval Mean Std. Dev. Minimum Maximum Obs.
Algeria 1970-2015 8.202 0.155 7.749 8.467 46 Albania 1970-2015 7.821 0.360 7.161 8.417 36 Angola 1970-2015 7.840 0.263 7.411 8.228 31 Argentina 1970-2015 8.979 0.153 8.689 9.285 46 Burundi 1970-2015 5.576 0.139 5.389 5.822 46 Benin 1970-2015 6.481 0.119 6.301 6.725 46 Burkina Faso 1970-2015 5.975 0.265 5.599 6.469 46 Bangladesh 1972-2015 6.163 0.320 5.761 6.878 44 Bolivia 1970-2015 7.391 0.154 7.157 7.780 46 Brazil 1970-2015 9.097 0.144 8.885 9.385 38 Barbados 1970-2015 9.600 0.093 9.429 9.724 26 Bhutan 1970-2015 6.981 0.562 6.000 7.874 36 Botswana 1970-2015 8.092 0.652 6.510 8.932 46 Bulgaria 1970-2015 8.446 0.276 8.078 8.937 36 Cape Verde 1970-2015 7.393 0.584 6.512 8.133 36 Cameroon 1970-2015 7.144 0.173 6.834 7.514 46
Central African Republic 1970-2015 6.150 0.183 5.705 6.437 46
Chad 1970-2015 6.379 0.250 6.006 6.874 46 Chile 1970-2015 8.897 0.431 8.272 9.609 46 China 1970-2015 7.476 0.804 6.176 8.779 32 Dem.R.Congo 1970-2015 6.245 0.501 5.572 6.984 46 Rep. of Congo 1970-2015 7.809 0.162 7.441 8.099 45 Colombia 1970-2015 8.423 0.243 8.006 8.915 44 Comoros 1970-2015 6.705 0.071 6.614 6.843 34 Costa Rica 1970-2015 8.636 0.259 8.218 9.149 46 Dominican Republic 1970-2015 8.071 0.361 7.400 8.787 46 Ecuador 1970-2015 8.261 0.160 7.851 8.599 45 Egypt 1970-2015 7.354 0.376 6.668 7.888 46 El Salvador 1970-2015 7.934 0.195 7.627 8.225 44 Ethiopia 1970-2015 5.465 0.289 5.097 6.188 35 Fiji 1970-2015 8.032 0.157 7.699 8.345 46 Gabon 1970-2015 9.273 0.185 8.880 9.877 46 Ghana 1970-2015 6.903 0.221 6.553 7.430 46 Gambia 1970-2015 6.262 0.038 6.154 6.332 42 Equatorial G. 1980-2015 7.989 1.537 6.188 9.920 36 Guatemala 1970-2015 7.784 0.127 7.534 8.029 46
7
Guyana 1970-2015 7.679 0.246 7.300 8.211 46 Honduras 1970-2015 7.400 0.122 7.177 7.648 46 Indonesia 1970-2015 7.591 0.376 6.896 8.249 40 India 1970-2015 6.452 0.494 5.862 7.471 46 Iran 1970-2015 8.512 0.177 8.167 8.798 46 Jamaica 1970-2015 8.401 0.114 8.150 8.588 46 Kenya 1970-2015 6.771 0.099 6.398 7.010 46 Lesotho 1970-2015 6.587 0.375 5.852 7.199 46 Madagascar 1970-2015 6.189 0.199 5.925 6.626 46 Malawi 1970-2015 5.941 0.113 5.702 6.182 46 Malaysia 1970-2015 8.525 0.498 7.597 9.282 46 Morocco 1970-2015 7.484 0.332 6.927 8.072 46 Mali 1970-2015 6.249 0.220 5.871 6.587 46 Mexico 1970-2015 8.933 0.165 8.558 9.171 46 Mauritania 1970-2015 7.016 0.095 6.873 7.190 46 Mauritius 1970-2015 8.427 0.469 7.725 9.192 41 Nepal 1970-2015 6.043 0.548 5.608 9.192 46 Nicaragua 1970-2015 7.343 0.251 6.969 7.849 46 Niger 1970-2015 5.982 0.190 5.775 6.434 46 Nigeria 1970-2015 7.412 0.242 7.048 7.848 46 Panama 1970-2015 8.544 0.308 8.132 9.272 46 Paraguay 1970-2015 7.810 0.266 7.168 8.248 46 Peru 1970-2015 8.211 0.205 7.869 8.688 46 Rwanda 1970-2015 5.978 0.247 5.321 6.571 46 Senegal 1970-2015 6.817 0.074 6.672 6.959 46 Sierra Leone 1970-2015 6.015 0.188 5.604 6.333 46 South Africa 1970-2015 8.764 0.093 8.615 8.939 46 South Korea 1970-2015 9.046 0.822 7.503 10.121 46 Thailand 1970-2015 7.822 0.592 6.834 8.654 46Trinidad and Tobago 1970-2015 9.172 0.344 8.762 9.744 46
Togo 1970-2015 6.285 0.104 6.019 6.527 46 Tunisia 1970-2015 7.828 0.339 7.134 8.358 46 Turkey 1970-2015 8.872 0.328 8.347 9.539 46 Uruguay 1970-2015 8.980 0.266 8.623 9.536 46 Zambia 1970-2015 7.096 0.197 6.806 7.390 46 Zimbabwe 1970-2015 6.994 0.211 6.385 7.206 46
8
Country Time Interval Mean Std. Dev. Minimum Maximum Obs.
Algeria 1970-2015 48.206 26.707 7.744 97.969 46 Albania 1970-2015 65.444 8.954 53.550 85.168 22 Angola 1970-2015 72.302 57.585 16.065 222.085 21 Argentina 1970-2015 43.602 29.231 9.347 152.111 46 Burundi 1970-2015 68.379 50.064 6.922 172.738 46 Benin 1970-2015 44.665 26.349 5.406 101.261 46 Burkina Faso 1970-2015 33.955 13.284 10.886 61.797 40 Bangladesh 1972-2015 36.877 10.205 16.342 55.688 42 Bolivia 1970-2015 80.632 39.803 7.157 7.780 46 Brazil 1970-2015 59.217 17.270 29.912 102.90 38 Barbados 1970-2015 53.487 18.619 28.508 105.482 39 Bhutan 1970-2015 50.194 26.916 1.722 94.800 34 Botswana 1970-2015 21.774 11.306 6.440 45.800 44 Bulgaria 1970-2015 67.232 67.890 14.275 289.554 24 Cape Verde 1970-2015 71.427 17.688 36.298 120.541 35 Cameroon 1970-2015 41.837 31.085 9.715 114.162 46
Central African Republic 1970-2015 52.343 29.266 20.267 108.770 46
Chad 1970-2015 38.839 18.855 12.809 83.651 46 Chile 1970-2015 47.373 43.291 3.889 165.546 46 China 1970-2015 20.162 12.421 0.971 42.919 32 Dem.R.Congo 1970-2015 85.511 59.820 16.802 262.843 46 Rep. of Congo 1970-2015 120.479 69.442 22.888 264.443 45 Colombia 1970-2015 30.476 10.083 12.444 50.569 44 Comoros 1970-2015 77.046 26.198 18.145 115.873 34 Costa Rica 1970-2015 47.302 25.610 19.206 110.252 46 Dominican Republic 1970-2015 31.364 12.312 17.518 60.690 46 Ecuador 1970-2015 47.546 28.326 14.623 100.815 45 Egypt 1970-2015 90.407 24.405 51.294 136.573 46 El Salvador 1970-2015 43.823 24.442 10.226 108.274 44 Ethiopia 1970-2015 79.063 31.903 31.572 150.678 35 Fiji 1970-2015 36.507 15.715 7.963 58.639 46 Gabon 1970-2015 51.157 25.602 13.601 99.703 46 Ghana 1970-2015 41.860 26.466 5.042 111.94 46 Gambia 1970-2015 89.468 41.729 8.474 156.014 42 Equatorial G. 1980-2015 107.356 109.983 0.474 325.570 36 Guatemala 1970-2015 26.689 12.832 10.137 55.649 46
9
Guyana 1970-2015 298.838 234.443 48.198 784.351 46 Honduras 1970-2015 54.234 27.733 13.317 116.557 46 Indonesia 1970-2015 38.019 18.568 16.430 95.893 40 India 1970-2015 57.965 17.785 32.695 84.243 46 Iran 1970-2015 25.579 14.537 8.874 59.701 46 Jamaica 1970-2015 99.045 44.097 14.156 181.281 46 Kenya 1970-2015 41.575 17.412 13.076 82.085 46 Lesotho 1970-2015 57.243 29.905 3.938 126.092 43 Madagascar 1970-2015 79.903 45.750 14.159 172.708 46 Malawi 1970-2015 85.030 38.995 36.704 174.251 46 Malaysia 1970-2015 52.614 19.145 30.041 109.035 46 Morocco 1970-2015 67.778 23.574 27.828 117.714 46 Mali 1970-2015 68.599 32.148 18.065 125.217 46 Mexico 1970-2015 42.572 13.871 17.023 78.144 46 Mauritania 1970-2015 136.073 47.904 66.150 234.394 39 Mauritius 1970-2015 47.068 12.968 17.917 71.757 41 Nepal 1970-2015 39.938 20.585 1.776 67.616 46 Nicaragua 1970-2015 209.759 319.934 26.481 2092.92 46 Niger 1970-2015 47.249 28.937 8.114 109.248 46 Nigeria 1970-2015 52.911 52.887 7.276 193.671 46 Panama 1970-2015 61.182 20.995 20.673 105.639 46 Paraguay 1970-2015 27.380 11.245 12.992 59.386 46 Peru 1970-2015 36.506 11.416 19.014 63.441 46 Rwanda 1970-2015 39.451 34.131 5.452 119.511 46 Senegal 1970-2015 52.178 23.015 17.590 94.417 46 Sierra Leone 1970-2015 101.532 64.864 21.081 241.415 46 South Africa 1970-2015 37.283 6.858 23.198 49.778 46 South Korea 1970-2015 19.146 8.414 6.821 37.888 45 Thailand 1970-2015 34.633 12.401 12.216 55.313 46Trinidad and Tobago 1970-2015 34.843 17.994 8.000 62.000 46
Togo 1970-2015 84.754 22.725 32.248 122.48 41 Tunisia 1970-2015 48.010 9.970 30.392 62.501 46 Turkey 1970-2015 37.763 13.128 19.036 77.935 46 Uruguay 1970-2015 51.606 26.018 16.644 99.885 46 Zambia 1970-2015 117.716 77.907 16.718 244.523 46 Zimbabwe 1970-2015 46.653 17.178 17.743 87.958 46
10
3.2. Empirical Model and Methodology
To analyze the causal linkage between economic growth and public debt for long-run causality in equations
(1) and (2), I employ the Toda and Yamamoto (1995) augmented Granger non-causality test, providing the
robustness of the cointegration properties of the process. The Toda-Yamamoto method does not require
the information on the cointegration features of the model and enables the implementation without
pre-testing for cointegration and for any level of the integration (Zapata and Rambaldi, 1997). According to this
method, I estimate an augmented vector autoregressive (VAR) model and a standard Wald test, even though
the series of the variables are non-stationary. Because this procedure ensures the asymptotic distribution
of the Wald statistic, in spite of the standard Granger causality test, which ensures a standard asymptotic
distribution, I choose to employ the Toda-Yamamoto procedure. This method primarily necessitates two steps.
The initial step is the selection of the optimal lag length (k), and the following step is the determination of
the maximum order of integration (d
max) for the variables in the model. The Toda-Yamamoto analysis also
includes a modified Wald Test for constraints on the parameters of a VAR (k) and possesses an asymptotic
χ2 distribution while a VAR (k+d
max) is estimated. This procedure is utilized in this study by estimating the
following VAR models computed with the seemingly unrelated regression (SUR) technique to increase the
efficiency of testing the Granger non-causality analysis (Rambaldi and Doran, 1996).
To determine white noise errors, I utilize the Akaike Information Criterion (AIC) to determine the optimal lag
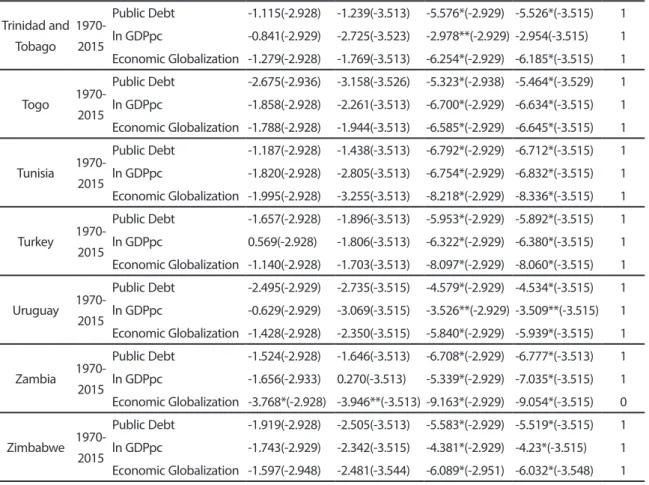
length of the VAR model. I employ the Augmented Dickey-Fuller (ADF) unit root test which is introduced
by Dickey and Fuller (1981), for the selection of the maximum order of integration. Table 4 presents the
ADF unit root test results.
ADF Test Results
Level First difference
Country Years Var. Without trend With trend Without trend With trend dmax Algeria 1970-2015 Public Debt -1.131(-2.929) -1.569(-3.515) -4.667*(-2.929) -4.869*(-3.515) 1 ln GDPpc -2.924(-2.929) -2.736(-3.515) -9.439*(-2.929) -9.607*(-3.515) 1 Economic Globalization -2.330(-2.933) -2.523(-3.520) -5.422*(-2.929) -5.380*(-3.515) 1 Albania 1971-2015 Public Debt -2.290(-3.012) -1.102(-3.644) -4.468*(-3.020) -5.185*(-3.658) 1 ln GDPpc -0.458(-2.951) -2.046(-3.548) -4.038*(-2.954) -4.358*(-3.552) 1 Economic Globalization 0.652(-2.929) -1.538(-3.515) -4.980*(-2.931) -5.150*(-3.518) 1 Angola 1970-2015 Public Debt -3.291**(-3.020) 0.295(-3.690) -4.308*(-3.029) -4.588*(-3.673) 0 ln GDPpc -1.327(-2.967) -2.085(-3.574) -2.970**(-2.967) -3.023(-3.574) 1 Economic Globalization -1.426(-2.936) -0.750(-3.526) -7.699*(-2.938) -8.054*(-3.529) 1 Argentina 1970-2015 Public Debt -2.373(-2.928) -2.572(-3.513) -6.718*(-2.929) -6.656*(-3.515) 1 ln GDPpc -0.724(-2.928) -2.186(-3.515) -5.625*(-2.929) -5.651*(-3.515) 1 Economic Globalization -0.840(-2.928) -0.314(-3.513) -5.900*(-2.929) -6.354*(-3.515) 1 Burundi 1970-2015 Public Debt -1.372(-2.928) -0.683(-3.513) -6.089*(-2.929) -6.307*(-3.515) 1 ln GDPpc -0.729(-2.928) -2.399(-3.518) -5.660*(-2.929) -5.676*(-3.515) 1 Economic Globalization -1.735(-2.928) -1.535(-3.513) -6.105*(-2.929) -6.137*(-3.515) 1
11
Benin 1970-2015 Public Debt -1.681(-2.928) -1.444(-3.513) -6.582*(-2.929) -6.748*(-3.515) 1 ln GDPpc 0.046(-2.928) -2.702(-3.513) -6.777*(-2.929) -6.758*(-3.515) 1 Economic Globalization -2.501(-2.928) -2.904(-3.513) -6.541*(-2.931) -6.538*(-3.518) 1 Burkina Faso 1970-2015 Public Debt -1.973(-2.938) -1.612(-3.529) -6.024*(-2.941) -6.170*(-3.533) 1 ln GDPpc 0.748(-2.928) -1.744(-3.513) -7.803*(-2.929) -7.954*(-3.515) 1 Economic Globalization 0.172(-2.928) -1.271(-3.513) -5.976*(-2.929) -6.130*(-3.515) 1 Bangladesh 1972-2015 Public Debt -2.181(-2.936) -1.576(-3.526) -4.003*(-2.936) -5.360*(-3.533) 1 ln GDPpc 4.298(-2.931) 0.639(-3.518) -1.329(-2.936) -9.630*(-3.520) 1 Economic Globalization -1.342(-2.931) -3.164(-3.520) -5.384*(-2.933) -5.371*(-3.520) 1 Bolivia 1970-2015 Public Debt -1.091(-2.928) -1.891(-3.513) -6.355*(-2.929) -6.433*(-3.515) 1 ln GDPpc -0.310(-2.929) -1.231(-3.515) -2.515(-2.929) -2.847(-3.515) 2 Economic Globalization -1.466(-2.928) -0.839(-3.513) -6.641*(-2.929) -6.818*(-3.515) 1 Brazil 1970-2015 Public Debt -2.629(-2.960) -3.444(-3.568) -6.607*(-2.948) -6.572*(-3.544) 1 ln GDPpc -3.386**(-2.928) -3.829**(-3.513) -4.267*(-2.929) -3.060(-3.526) 0 Economic Globalization -1.328(-2.928) -0.589(-3.513) -5.359*(-2.929) -5.456*(-3.515) 1 Barbados 1970-2015 Public Debt -0.321(-2.943) -1.254(-3.536) -3.539**(-2.943) -3.691**(-3.536) 1 ln GDPpc -0.649(-2.986) -1.804(-3.603) -3.405**(-2.991) -3.333(-3.612) 1 Economic Globalization -2.848(-2.928) -2.929(-3.513) -6.551*(-2.933) -6.561*(-3.520) 1 Bhutan 1970-2015 Public Debt -1.015(-2.954) -3.251(-3.557) -4.122*(-2.957) -4.057**(-3.557) 1 ln GDPpc -0.865(-2.948) -3.097(-3.544) -6.817*(-2.951) -6.733*(-3.548) 1 Economic Globalization 1.826(-2.931) -2.234(-3.513) -8.659*(-2.929) -6.887*(-3.518) 1 Botswana 1970-2015 Public Debt -2.295(-2.931) -2.159(-3.518) -5.052*(-2.933) -5.114*(-3.520) 1 ln GDPpc -5.718*(-2.928) -3.618**(-3.513) -4.212*(-2.929) -5.080(-3.515) 0 Economic Globalization -1.838(-2.928) -2.959(-3.513) -7.165*(-2.929) -7.091*(-3.515) 1 Bulgaria 1970-2015 Public Debt -6.710*(-3.004) -3.914**(-3.644) -8.526*(-3.004) -5.486*(-3.710) 0 ln GDPpc -0.292(-2.951) -1.925(-3.548) -3.040**(-2.951) -3.077(-3.548) 1 Economic Globalization 0.021(2.928) -1.873(-3.513) -6.864*(-2.929) -6.590*(-3.189) 1 Cape Verde 1970-2015 Public Debt -0.544(-2.951) -1.308(-3.548) -4.404*(-2.954) -4.433*(-3.552) 1 ln GDPpc -0.883(-2.951) -1.237(-3.548) -3.472**(-2.951) -3.548**(-3.548) 1 Economic Globalization -2.188(-2.936) -2.203(-3.526) -6.388*(-2.938) -6.379*(-3.529) 1 Cameroon 1970-2015 Public Debt -1.311(-2.928) -1.101(-3.513) -5.274*(-2.929) -5.304*(-3.515) 1 ln GDPpc -3.208**(-2.933) -3.160(-3.520) -1.883(-2.933) -1.848(-3.520) 0 Economic Globalization -2.398(-2.928) -2.364(-3.513) -6.866*(-2.927 -6.969*(-3.515) 1 Central African Republic 1970-2015 Public Debt -1.638(-2.928) -1.429/-3.513) -7.003*(-2.929) -7.028*(-3.515) 1 ln GDPpc -0.949(-2.928) -2.889(-3.513) -7.392*(-2.929) -7.357*(-3.515) 1 Economic Globalization -2.036(-2.928) -1.984(-3.513) -6.593*(-2.929) -6.651*(-3.515) 112
Chad 1970-2015 Public Debt -2.040(-2.929) -1.984(-3.515) -4.565*(-2.929) -4.535*(-3.515) 1 ln GDPpc -0.349(-2.928) -1.785(-3.513) -5.681*(-2.929) -5.906*(-3.515) 1 Economic Globalization -1.254(-2.928) -2.185(-3.513) -6.225*(-2.929) -6.187*(-3.515) 1 Chile 1970-2015 Public Debt -2.934**(-2.931) -2.885(-3.515) -2.843(-2.931) -2.777(-3.518) 0 ln GDPpc 0.406(-2.929) -3.744**(-3.515) -4.779*(-2.929) -4.986*(-3.515) 0 Economic Globalization -1.243(-2.928) -1.218(-3.513) -5.261*(-2.929) -5.312*(-3.515) 1 China 1970-2015 Public Debt -0.316(-2.960) -2.988(-3.562 -6.516*(-2.963) -6.447*(-3.568) 1 ln GDPpc 0.733(-2.931) -3.635**(-3.515) -3.217**(-2.931) -3.254(-3.518) 0 Economic Globalization -0.561(-2.928) -1.508(-3.513) -6.321*(-2.929) -6.204*(-3.515) 1 Democratic Rep. Congo 1970-2015 Public Debt -1.958(-2.928) -0.329(-3.518) -7.264*(-2.931) -7.733*(-3.518) 1 ln GDPpc -1.777(-2.929) -1.095(-3.515) -2.522(-2.929) -2.843(-3.515) 2 Economic Globalization -1.520(-2.928) -1.437(-3.513) -7.857*(-2.929) -8.042*(-3.515) 1 Republic of Congo 1970-2015 Public Debt -1.265(-2.929) -0.906(-3.515) -5.894*(-2.931) -6.236*(-3.518) 1 ln GDPpc -2.467(-2.929) -2.514(-3.515) -3.846*(-2.929) -3.842**(-3.515) 1 Economic Globalization -1.523(-2.928) -2.257(-3.513) -8.922*(-2.929) -8.908*(-3.515) 1 Colombia 1970-2015 Public Debt -1.056(-2.933) -2.677(-3.520) -3.874*(-2.933) -3.876**(-3.520) 1 ln GDPpc 0.180(-2.928) -1.161(-3.513) -4.658*(-2.929) -4.631*(-3.515) 1 Economic Globalization -0.459(-2.928) -3.264(-3.513) -6.510*(-2.929) -6.448*(-3.515) 1 Comoros 1970-2015 Public Debt -0.518(-2.954) -2.308(-3.552) -5.480*(-2.957) -5.717*(-3.557) 1 ln GDPpc -1.254(-2.948) -2.086(-3.544) -7.350*(-2.951) -7.237*(-3.548) 1 Economic Globalization -2.489(-2.936) -1.974(-3.526) -5.099*(-2.938) -5.267*(-3.529) 1 Costa Rica 1970-2015 Public Debt -2.528(-2.931) -2.770(-3.518) -2.453(-2.931) -2.434(-3.518) 2 ln GDPpc 0.198(-2.929) -0.938(-3.513) -4.170*(-2.929) -4.210*(-3.515) 1 Economic Globalization -1.184(-2.928) -1.895(-3.515) -4.928*(-2.929) -4.923*(-3.515) 1 Dominican Republic 1970-2015 Public Debt -1.758(-2.928) -2.351(-3.520) -8.661*(-2.929) -8.560*(-3.515) 1 ln GDPpc 0.056(-2.928) -1.226(-3.513) -4.858*(-2.929) -4.960*(-3.518) 1 Economic Globalization -0.905(-2.928) -2.963(-3.513) -8.148*(-2.929) -8.052*(-3.515) 1 Ecuador 1970-2015 Public Debt -1.325(-2.929) -1.275(-3.515) -5.237*(-2.931) -5.277*(-3.518) 1 ln GDPpc -1.822(-2.928) -2.247(-3.513) -4.375*(-2.929) -4.372*(-3.515) 1 Economic Globalization -1.724(-2.931) -0.019(-3.518) -7.122*(-2.931) -7.635*(-3.518) 1 Egypt 1970-2015 Public Debt -2.612(-2.929) -2.738(-3.515) -4.614*(-2.929) -4.624*(-3.515) 1 ln GDPpc -1.648(-2.928) -2.514(-3.518) -3.525**(-2.935) -4.496*(-3.523) 1 Economic Globalization -1.694(-2.929) 0.488(-3.513) -5.012*(-2.929) -5.740*(-3.515) 1 El Salvador 1970-2015 Public Debt -1.951(-2.933) -3.279(-3.529) -4.790*(-2.933) -4.764*(-3.520) 1 ln GDPpc -0.677(-2.931) -6.786*(-3.540) -2.517(-2.929) -2.580(-3.515) 0 Economic Globalization -0.866(-2.928) -1.443(-3.513) -5.168*(-2.929) -5.087*(-3.515) 113
Ethiopia 1970-2015 Public Debt -1.863(-2.929) -1.107(-3.513) -4.772*(-2.929) -4.844*(-3.515) 1 ln GDPpc 1.914(-2.951) -0.341(-3.548) -3.965*(-2.954) -3.722**(-3.568) 1 Economic Globalization -1.273(-2.928) -0.986(-3.513) -5.387*(-2.929) -5.408*(-3.515) 1 Fiji 1970-2015 Public Debt -1.723(-2.928) -2.020(-3.513) -7.452*(-2.929) -7.585*(-3.515) 1 ln GDPpc -0.727(-2.929) -2.776(-3.513) -8.126*(-2.929) -8.023*(-3.515) 1 Economic Globalization -2.179(-2.928) -3.447(-3.513) -6.901*(-2.931) -6.902*(-3.518) 1 Gabon 1970-2015 Public Debt -2.089(-2.928) -2.016(-3.513) -5.844*(-2.929) -5.857*(-3.515) 1 ln GDPpc -2.504(-2.928) -3.594**(-3.513) -4.770*(-2.929) -4.809*(-3.515) 0 Economic Globalization -2.629(-2.928) -3.504(-3.513) -8.422*(-2.929) -8.453*(-3.513) 1 Ghana 1970-2015 Public Debt -1.202(-2.928) -1.772(-3.523) -5.228*(-2.929) -5.167*(-3.515) 1 ln GDPpc 0.316(-2.929) -1.485(-3.515) -4.275*(-2.929) -5.766*(-3.515) 1 Economic Globalization -1.120(-2.928) -1.866(-3.513) -7.811*(-2.929) -7.719*(-3.515) 1 Gambia 1970-2015 Public Debt -2.085(-2.935) -1.707(-3.523) -6.748*(2.936) -6.953*(-3.526) 1 ln GDPpc -2.583(-2.928) -2.493(-3.513) -5.267*(-2.931) -5.486*(-3.518) 1 Economic Globalization -2.556(-2.928) -3.043(-3.513) -6.366*(-2.929) -6.302*(-3.515) 1 Equatorial Guinea 1980-2015 Public Debt -0.828(-2.948) -2.576(-3.544) -5.752*(-2.951) -5.683*(-3.548) 1 ln GDPpc -0.809(-2.951) -1.517(-3.548) -3.215**(-2.951) -3.140(-3.548) 1 Economic Globalization -2.345(-2948) -2.416(-3.544) -6.622*(-2.951) -6.558*(-3.548) 1 Guatemala 1970-2015 Public Debt -1.720(-2.929) -1.630(-3.515) -3.710*(-2.929) -3.775**(-3.515) 1 ln GDPpc -1.031(-2.929) -2.655(-3.520) -2.961**(-2.929) -3.111(-3.518) 1 Economic Globalization -0.869(-2.929) -1.753(-3.515) -4.760*(-2.929) -4.694*(-3.515) 1 Guyana 1970-2015 Public Debt -1.165(-2.929) -1.766(-3.515) -3.927*(-2.929) -4.127**(-3.515) 1 ln GDPpc 0.107(-2.929) -1.452(-3.515) -3.785*(-2.929) -4.193*(-3.515) 1 Economic Globalization -1.165(2.931) 1.017(-3.513) -2.226(-2.931) -6.239*(-3.515) 1 Honduras 1970-2015 Public Debt -1.643(-2.928) -1.399(-3.513) -6.409*(-2.929) -6.598*(-3.515) 1 ln GDPpc -0.564(-2.928) -1.678(-3.513) -5.083*(-2.929) -5.027*(-3.515) 1 Economic Globalization -1.197(-2.929) -1.605(-3.515) -4.112*(-2.929) -4.097**(-3.515) 1 Indonesia 1970-2015 Public Debt -2.823(-3.615) -2.734(-3.33) -4.501*(-2.943) -4.452*(-3.536) 1 ln GDPpc -0.811(-2.928) -2.559(-3.515) -4.957*(-2.929) -4.919*(-3.515) 1 Economic Globalization -1.970(-2.928) -1.243(-3.513) -5.585*(-2.929) -5.730*(-3.515) 1 India 1970-2015 Public Debt -1.130(-2.928) -1.361(-3.513) -5.540*(-2.929) -5.510*(-3.515) 1 ln GDPpc 4.217(-2.928) -1.387(-3.513) -5.347*(-2.929) -7.847*(-3.515) 1 Economic Globalization -0.857(-2.929) -1.720(-3.515) -4.438*(-2.929) -4.361*(-3.515) 1 Iran 1970-2015 Public Debt -2.897(-2.929) -3.018(-3.515) -5.479*(-2.929) -5.431*(-3.515) 1 ln GDPpc -2.094(-2.929) -1.940(-3.515) -4.284*(-2.931) -4.440*(-3.518) 1 Economic Globalization -1.448(-2.945) -2.163(-3.540) -4.705*(-2.948) -4.624*(-3.544) 114
Jamaica 1970-2015 Public Debt -2.361(-2.929) -2.163(-3.515) -3.883*(-2.929) -3.982**(-3.515) 1 ln GDPpc -1.445(-2.929) -1.921(-3.515) -5.215*(-2.929) -5.196*(-3.515) 1 Economic Globalization -1.782(-2.928) -2.507(-3.513) -6.123*(-2.929) -6.085*(-3.515) 1 Kenya 1970-2015 Public Debt -1.639(-2.928) -1.433(-3.513) -6.163*(-2.929) -6.198*(-3.515) 1 ln GDPpc -0.660(-2.929) -1.880(-3.515) -5.354*(-2.929) -5.112*(-3.515) 1 Economic Globalization -2.173(-2.928) -2.538(-3.513) -7.873*(-2.929) -7.832*(-3.515) 1 Lesotho 1970-2015 Public Debt -1.885(-2.933) -1.466(-3.520) -5.004*(-2.935) -5.136*(-3.523) 1 ln GDPpc -1.125(-2.928) -3.413(-3.513) -6.144*(-2.929) -6.119*(-3.515) 1 Economic Globalization -2.520(-2.928) -2.751(-3.513) -7.319*(-2.929) -7.412*(-3.515) 1 Madagascar 1970-2015 Public Debt -1.051(-2.929) -1.057(-3.515) -5.726*(-2.931) -5.976*(-3.518) 1 ln GDPpc -2.156(-2.928) -1.608(-3.513) -7.135*(-2.929) -7.640*(-3.515) 1 Economic Globalization -0.750(-2.928) -2.202(-3.513) -7.782*(-2.929) -7.685*(-3.515) 1 Malawi 1970-2015 Public Debt -2.254(-2.928) -2.133(-3.513) -6.013*(-2.929) -6.004*(-3.515) 1 ln GDPpc -1.535(-2.928) -1.829(-3.513) -7.515*(-2.929) -7.467*(-3.515) 1 Economic Globalization -1.619(-2.928) -2.668(-3.513) -7.662*(-2.929) -7.647*(-3.515) 1 Malaysia 1970-2015 Public Debt -2.675(-2.933) -2.764(-3.520) -3.428**(-2.929) -3.377(-3.515) 1 ln GDPpc -1.518(-2.928) -2.072(-3.513) -5.736*(-2.929) -5.885*(-3.515) 1 Economic Globalization -1.461(-2.928) -1.503(-3.513) -6.455*(-2.929) -6.631*(-3.515) 1 Morocco 1970-2015 Public Debt -2.161(-2.931) -2.183(-3.518) -2.820(-2.931) -3.014(-3.518) 2 ln GDPpc 0.495(-2.936) -2.887(-3.520) -3.962*(-2.936) -3.976*(-3.526) 1 Economic Globalization -0.654(-2.928) -3.174(-3.513) -7.098*(-2.929) -7.020*(-3.515) 1 Mali 1972-2015 Public Debt -0.855(-2.928) -1.229(-3.513) -6.477*(-2.929) -6.484*(-3.515) 1 ln GDPpc -0.879(-2.928) -3.180(-3.513) -7.729*(-2.929) -7.642*(-3.515) 1 Economic Globalization -1.616(-2.928) -3.162(-3.513) -7.139*(-2.931) -7.066*(-3.518) 1 Mexico 1971-2015 Public Debt -2.264(-2.928) -2.185(-3.513) -5.968*(-2.929) -5.932*(-3.515) 1 ln GDPpc -1.922(-2.928) -3.312(-3.515) -5.245*(-2.929) -5.334*(-3.515) 1 Economic Globalization -0.505(-2.928) -3.402(-3.513) -6.609*(-2.929) -6.177*(-3.518) 1 Mauritania 1970-2015 Public Debt -1.743(-2.943) -1.962(-3.536) -4.261*(-2.943) -4.298*(-3.536) 1 ln GDPpc -1.553(-2.928) -1.533(-3.513) -7.549*(-2.929) -8.277*(-3.515) 1 Economic Globalization -2.485(-2.928) -2.460(-3.513) -7.076*(-2.929) -7.005*(-3.515) 1 Mauritius 1970-2015 Public Debt -2.329(-2.929) -2.254(-3.515) -5.611*(-2.929) -5.609*(-3.515) 1 ln GDPpc 0.539(-2.936) -2.625(-3.526) -5.561*(-2.938) -5.612*(-3.529) 1 Economic Globalization 0.110(-2.928) -1.757(-3.513) -5.487*(-2.929) -5.504*(-3.515) 1 Nepal 1970-2015 Public Debt -1.751(-2.929) 0.266(-3.513) -4.514*(-2.929) -5.775*(-3.515) 1 ln GDPpc 2.191(-2.926) 1.604(-3.510) -0.438(-2.928) -1.194(-3.513) 2 Economic Globalization -1.281(-2.928) -1.697(-3.513) -6.871*(-2.929) -6.793*(-3.515) 115
Nicaragua 1970-2015 Public Debt -2.572(-2.929) -4.512*(-3.513) -12.110*(-2.929) -12.009*(-3.515) 1 ln GDPpc -1.814(-2.945) -0.223(-3.513) -4.792*(-2.929) -5.210*(-3.515) 1 Economic Globalization -1.253(-2.928) -3.144(-3.513) -6.974*(-2.929) -6.890*(-3.515) 1 Niger 1970-2015 Public Debt -1.816(-2.929) -1.225(-3.513) -4.901*(-2.929) -4.921*(-3.515) 1 ln GDPpc -2.343(-2.928) -1.502(-3.513) -6.334*(-2.929) -6.846*(-3.515) 1 Economic Globalization -1.397(-2.928) -2.066(-3.513) -5.893*(-2.931) -5.820*(-3.518) 1 Nigeria 1970-2015 Public Debt -1.877(-2.928) -1.861(-3.513) -7.972*(-2.929) -8.008*(-3.515) 1 ln GDPpc -0.088(-2.928) -0.411(-3.513) -5.718*(-2.929) -6.173*(-3.515) 1 Economic Globalization -1.921(-2.928) -1.051(-3.513) -7.935*(-2.929) 2-8.429*(-3.515) 1 Panama 1970-2015 Public Debt -2.584(-2.929) -3.224(-3.515) -3.247**(-2.929) -3.510*(-3.515) 1 ln GDPpc 0.774(-2.929) -1.403(-3.515) -4.152*(-2.931) -4.551*(-3.518) 1 Economic Globalization -0.510(-2.928) -1.420(-3.513) -6.237*(-2.929) -6.188*(-3.515) 1 Paraguay 1970-2015 Public Debt -2.274(-2.928) -2.247(-3.513) -7.706*(-2.929) -7.617*(-3.515) 1 ln GDPpc -2.180(-2.928) -2.138(-3.513) -4.691*(-2.929) -4.781*(-3.515) 1 Economic Globalization -1.194(-2.928) -1.931(-3.513) -6.070*(-2.929) -6.024*(-3.515) 1 Peru 1970-2015 Public Debt -1.252(-2.935) -2.727(-3.523) -6.623*(-2.935) -8.152*(-3.523) 1 ln GDPpc -0.476(-2.929) -1.114(-3.515) -3.950*(-2.929) -4.196*(-3.515) 1 Economic Globalization -0.813(-2.928) -2.813(-3.513) -6.751*(-2.929) -6.660*(-3.515) 1 Rwanda 1970-2015 Public Debt -2.305(-2.928) -2.321(-3.513) -8.349*(-2.929) -8.304*(-3.515) 1 ln GDPpc -0.803(-2.928) -1.699(-3.513) -8.086*(-2.929) -8.186*(-3.515) 1 Economic Globalization 0.592(-2.928) -1.250(-3.513) -6.239*(-2.929) -6.464*(-3.515) 1 Senegal 1970-2015 Public Debt -1.664(-2.928) -1.468(-3.513) -5.815*(-2.929) -5.863*(-3.515) 1 ln GDPpc -1.129(-2.928) -1.455(-3.513) -7.919*(-2.929) -8.353*(-3.515) 1 Economic Globalization -1.255(-2.928) -2.793(-3.513) -7.227*(-2.929) -7.132*(-3.515) 1 Sierra Leone 1970-2015 Public Debt -1.524(-2.928) -1.204(-3.513) -7.433*(-2.929) -7.716*(-3.515) 1 ln GDPpc -1.451(-2.928) -1.177(-3.513) -5.758*(-2.929) -5.792*(-3.515) 1 Economic Globalization -1.779(-2.928) -3.041(-3.513) -7.071*(-2.931) -7.095*(-3.518) 1 South Africa 1970-2015 Public Debt -2.409(-2.929) -2.420(-3.515) -4.594*(-2.929) -4.655*(-3.515) 1 ln GDPpc -0.695(-2.929) -1.265(-3.515) -4.210*(-2.929) -4.348*(-3.515) 1 Economic Globalization -1.449(-2.929) -2.066(-3.515) -4.781*(-2.929) -4.724*(-3.515) 1 South Korea 1970-2015 Public Debt 0.126(-2.931) -0.974(-3.518) -4.549*(-2.931) -4.952*(-3.518) 1 ln GDPpc -3.730*(-2.928) 0.151(-3.513) -4.925*(-2.929) -6.276*(-3.515) 1 Economic Globalization -0.439(-2.928) -1.733(-3.513) -6.722*(-2.929) -6.642*(-3.515) 1 Thailand 1970-2015 Public Debt -2.824(-2.929) -3.283(-3.515) -3.768*(-2.929) -3.722**(-3.515) 1 ln GDPpc -1.235(-2.929) -1.672(-3.515) -3.968*(-2.929) -4.074**(-3.515) 1 Economic Globalization -0.930(-2.928) -1.378(-3.513) -6.452*(-2.929) -6.450*(-3.515) 116
Trinidad and Tobago 1970-2015 Public Debt -1.115(-2.928) -1.239(-3.513) -5.576*(-2.929) -5.526*(-3.515) 1 ln GDPpc -0.841(-2.929) -2.725(-3.523) -2.978**(-2.929) -2.954(-3.515) 1 Economic Globalization -1.279(-2.928) -1.769(-3.513) -6.254*(-2.929) -6.185*(-3.515) 1 Togo 1970-2015 Public Debt -2.675(-2.936) -3.158(-3.526) -5.323*(-2.938) -5.464*(-3.529) 1 ln GDPpc -1.858(-2.928) -2.261(-3.513) -6.700*(-2.929) -6.634*(-3.515) 1 Economic Globalization -1.788(-2.928) -1.944(-3.513) -6.585*(-2.929) -6.645*(-3.515) 1 Tunisia 1970-2015 Public Debt -1.187(-2.928) -1.438(-3.513) -6.792*(-2.929) -6.712*(-3.515) 1 ln GDPpc -1.820(-2.928) -2.805(-3.513) -6.754*(-2.929) -6.832*(-3.515) 1 Economic Globalization -1.995(-2.928) -3.255(-3.513) -8.218*(-2.929) -8.336*(-3.515) 1 Turkey 1970-2015 Public Debt -1.657(-2.928) -1.896(-3.513) -5.953*(-2.929) -5.892*(-3.515) 1 ln GDPpc 0.569(-2.928) -1.806(-3.513) -6.322*(-2.929) -6.380*(-3.515) 1 Economic Globalization -1.140(-2.928) -1.703(-3.513) -8.097*(-2.929) -8.060*(-3.515) 1 Uruguay 1970-2015 Public Debt -2.495(-2.929) -2.735(-3.515) -4.579*(-2.929) -4.534*(-3.515) 1 ln GDPpc -0.629(-2.929) -3.069(-3.515) -3.526**(-2.929) -3.509**(-3.515) 1 Economic Globalization -1.428(-2.928) -2.350(-3.515) -5.840*(-2.929) -5.939*(-3.515) 1 Zambia 1970-2015 Public Debt -1.524(-2.928) -1.646(-3.513) -6.708*(-2.929) -6.777*(-3.513) 1 ln GDPpc -1.656(-2.933) 0.270(-3.513) -5.339*(-2.929) -7.035*(-3.515) 1 Economic Globalization -3.768*(-2.928) -3.946**(-3.513) -9.163*(-2.929) -9.054*(-3.515) 0 Zimbabwe 1970-2015 Public Debt -1.919(-2.928) -2.505(-3.513) -5.583*(-2.929) -5.519*(-3.515) 1 ln GDPpc -1.743(-2.929) -2.342(-3.515) -4.381*(-2.929) -4.23*(-3.515) 1 Economic Globalization -1.597(-2.948) -2.481(-3.544) -6.089*(-2.951) -6.032*(-3.548) 1* Indicates significance at the 5 percent level. Numbers in the Table are the pseudo t-statistics for testing the null hypothesis that the series is non-stationary. Critical values at 0.05 are in parenthesis. I(1) dmax=1.
Table 4. Unit Root Test Results.
As discussed in the first section, public debt can significantly influence economic growth, and growth
can be affected by public debt. Following the current literature, I focus on the causal linkage between
debt and growth of a country in the models to have the causal relation and the direction of causality
running among considered variables with the control variable, economic globalization. Accordingly, the
models can be specified as follows:
Public Debt equation (1):
18
As discussed in the first section, public debt can significantly influence economic growth,
and growth can be affected by public debt. Following the current literature, I focus on the
causal linkage between debt and growth of a country in the models to have the causal
relation and the direction of causality running among considered variables with the control
variable, economic globalization. Accordingly, the models can be specified as follows:
Public Debt equation (1):
𝑃𝑃𝑃𝑃𝑡𝑡= 𝛼𝛼0+ ∑ 𝛽𝛽1𝑖𝑖𝑃𝑃𝑃𝑃𝑡𝑡−𝑖𝑖+ ∑ 𝛽𝛽2𝑗𝑗𝑃𝑃𝑃𝑃𝑡𝑡−𝑗𝑗+ ∑ 𝛾𝛾1𝑗𝑗𝑙𝑙𝑙𝑙𝑙𝑙𝑃𝑃𝑃𝑃𝑡𝑡−𝑖𝑖+ 𝑘𝑘 𝑖𝑖=1 𝑑𝑑𝑚𝑚𝑚𝑚𝑚𝑚 𝑗𝑗=𝑘𝑘+1 ∑ 𝛾𝛾2𝑗𝑗𝑙𝑙𝑙𝑙𝑙𝑙𝑃𝑃𝑃𝑃𝑡𝑡−𝑗𝑗 𝑑𝑑𝑚𝑚𝑚𝑚𝑚𝑚 𝑗𝑗=𝑘𝑘+1 𝑘𝑘 𝑖𝑖=1 + ∑ 𝜃𝜃1𝑖𝑖𝐸𝐸𝐸𝐸𝐸𝐸𝐸𝐸𝑡𝑡−𝑖𝑖 𝑘𝑘 𝑖𝑖=1 + ∑ 𝜃𝜃2𝑗𝑗𝐸𝐸𝐸𝐸𝐸𝐸𝐸𝐸𝑡𝑡−𝑗𝑗 𝑑𝑑𝑚𝑚𝑚𝑚𝑚𝑚 𝑗𝑗=𝑘𝑘+1 + 𝜀𝜀1𝑡𝑡
Economic Growth equation (2):
𝑙𝑙𝑙𝑙𝑙𝑙𝑃𝑃𝑃𝑃𝑡𝑡= 𝛼𝛼̃0+ ∑ 𝛽𝛽̃1𝑖𝑖𝑃𝑃𝑃𝑃𝑡𝑡−𝑖𝑖+ ∑ 𝛽𝛽̃2𝑗𝑗𝑃𝑃𝑃𝑃𝑡𝑡−𝑗𝑗+ ∑ 𝛾𝛾̃1𝑗𝑗𝑙𝑙𝑙𝑙𝑙𝑙𝑃𝑃𝑃𝑃𝑡𝑡−𝑖𝑖+ 𝑘𝑘 𝑖𝑖=1 𝑑𝑑𝑚𝑚𝑚𝑚𝑚𝑚 𝑗𝑗=𝑘𝑘+1 ∑ 𝛾𝛾̃2𝑗𝑗𝑙𝑙𝑙𝑙𝑙𝑙𝑃𝑃𝑃𝑃𝑡𝑡−𝑗𝑗 𝑑𝑑𝑚𝑚𝑚𝑚𝑚𝑚 𝑗𝑗=𝑘𝑘+1 𝑘𝑘 𝑖𝑖=1 + ∑ 𝜃𝜃̃1𝑖𝑖𝐸𝐸𝐸𝐸𝐸𝐸𝐸𝐸𝑡𝑡−𝑖𝑖 𝑘𝑘 𝑖𝑖=1 + ∑ 𝜃𝜃̃2𝑗𝑗𝐸𝐸𝐸𝐸𝐸𝐸𝐸𝐸𝑡𝑡−𝑗𝑗 𝑑𝑑𝑚𝑚𝑚𝑚𝑚𝑚 𝑗𝑗=𝑘𝑘+1 + 𝜀𝜀2𝑡𝑡
where PD
tand lnPD
t-1are the current and lagged levels of public debt of a country at periods
t and t-1; lnGDP
t-1is the lagged natural logarithm of real per capita GDP of a country at time
t-1. k is the optimal lag order, d
maxis the maximal order of integration of the series in the
system and ε
1, ε
2are the error terms that are assumed to be white noise. Conventional Wald
tests were then applied to the first k coefficient matrices using the standard χ2- statistics. To
test the hypothesis that I have from equation (1), ‘Public Debt does not Granger cause
Economic Growth’ if H
0: 𝛾𝛾
1𝑖𝑖= 0 against H
1: 𝛾𝛾
1𝑖𝑖≠ 0, and in equation (2), ‘Economic Growth
does not Granger cause Public Debt’ if H
0: 𝛾𝛾
2𝑖𝑖= 0 against H
1: 𝛾𝛾
2𝑖𝑖≠ 0, for every i=1, 2, …,
17
SOSYAL BİLİMLER DERGİSİ
JOURNAL OF SOCIAL SCIENCES
Economic Growth equation (2):
18
As discussed in the first section, public debt can significantly influence economic growth,
and growth can be affected by public debt. Following the current literature, I focus on the
causal linkage between debt and growth of a country in the models to have the causal
relation and the direction of causality running among considered variables with the control
variable, economic globalization. Accordingly, the models can be specified as follows:
Public Debt equation (1):
𝑃𝑃𝑃𝑃𝑡𝑡= 𝛼𝛼0+ ∑ 𝛽𝛽1𝑖𝑖𝑃𝑃𝑃𝑃𝑡𝑡−𝑖𝑖+ ∑ 𝛽𝛽2𝑗𝑗𝑃𝑃𝑃𝑃𝑡𝑡−𝑗𝑗+ ∑ 𝛾𝛾1𝑗𝑗𝑙𝑙𝑙𝑙𝑙𝑙𝑃𝑃𝑃𝑃𝑡𝑡−𝑖𝑖+ 𝑘𝑘 𝑖𝑖=1 𝑑𝑑𝑚𝑚𝑚𝑚𝑚𝑚 𝑗𝑗=𝑘𝑘+1 ∑ 𝛾𝛾2𝑗𝑗𝑙𝑙𝑙𝑙𝑙𝑙𝑃𝑃𝑃𝑃𝑡𝑡−𝑗𝑗 𝑑𝑑𝑚𝑚𝑚𝑚𝑚𝑚 𝑗𝑗=𝑘𝑘+1 𝑘𝑘 𝑖𝑖=1 + ∑ 𝜃𝜃1𝑖𝑖𝐸𝐸𝐸𝐸𝐸𝐸𝐸𝐸𝑡𝑡−𝑖𝑖 𝑘𝑘 𝑖𝑖=1 + ∑ 𝜃𝜃2𝑗𝑗𝐸𝐸𝐸𝐸𝐸𝐸𝐸𝐸𝑡𝑡−𝑗𝑗 𝑑𝑑𝑚𝑚𝑚𝑚𝑚𝑚 𝑗𝑗=𝑘𝑘+1 + 𝜀𝜀1𝑡𝑡
Economic Growth equation (2):
𝑙𝑙𝑙𝑙𝑙𝑙𝑃𝑃𝑃𝑃𝑡𝑡= 𝛼𝛼̃0+ ∑ 𝛽𝛽̃1𝑖𝑖𝑃𝑃𝑃𝑃𝑡𝑡−𝑖𝑖+ ∑ 𝛽𝛽̃2𝑗𝑗𝑃𝑃𝑃𝑃𝑡𝑡−𝑗𝑗+ ∑ 𝛾𝛾̃1𝑗𝑗𝑙𝑙𝑙𝑙𝑙𝑙𝑃𝑃𝑃𝑃𝑡𝑡−𝑖𝑖+ 𝑘𝑘 𝑖𝑖=1 𝑑𝑑𝑚𝑚𝑚𝑚𝑚𝑚 𝑗𝑗=𝑘𝑘+1 ∑ 𝛾𝛾̃2𝑗𝑗𝑙𝑙𝑙𝑙𝑙𝑙𝑃𝑃𝑃𝑃𝑡𝑡−𝑗𝑗 𝑑𝑑𝑚𝑚𝑚𝑚𝑚𝑚 𝑗𝑗=𝑘𝑘+1 𝑘𝑘 𝑖𝑖=1 + ∑ 𝜃𝜃̃1𝑖𝑖𝐸𝐸𝐸𝐸𝐸𝐸𝐸𝐸𝑡𝑡−𝑖𝑖 𝑘𝑘 𝑖𝑖=1 + ∑ 𝜃𝜃̃2𝑗𝑗𝐸𝐸𝐸𝐸𝐸𝐸𝐸𝐸𝑡𝑡−𝑗𝑗 𝑑𝑑𝑚𝑚𝑚𝑚𝑚𝑚 𝑗𝑗=𝑘𝑘+1 + 𝜀𝜀2𝑡𝑡
where PD
tand lnPD
t-1are the current and lagged levels of public debt of a country at periods
t and t-1; lnGDP
t-1is the lagged natural logarithm of real per capita GDP of a country at time
t-1. k is the optimal lag order, d
maxis the maximal order of integration of the series in the
system and ε
1, ε
2are the error terms that are assumed to be white noise. Conventional Wald
tests were then applied to the first k coefficient matrices using the standard χ2- statistics. To
test the hypothesis that I have from equation (1), ‘Public Debt does not Granger cause
Economic Growth’ if H
0: 𝛾𝛾
1𝑖𝑖= 0 against H
1: 𝛾𝛾
1𝑖𝑖≠ 0, and in equation (2), ‘Economic Growth
does not Granger cause Public Debt’ if H
0: 𝛾𝛾
2𝑖𝑖= 0 against H
1: 𝛾𝛾
2𝑖𝑖≠ 0, for every i=1, 2, …,
k.
where PD
tand lnPD
t-1are the current and lagged levels of public debt of a country at periods t and t-1;
lnGDP
t-1is the lagged natural logarithm of real per capita GDP of a country at time t-1. k is the optimal lag
order, d
maxis the maximal order of integration of the series in the system and ε
1, ε
2are the error terms that
are assumed to be white noise. Conventional Wald tests were then applied to the first k coefficient matrices
using the standard χ2- statistics. To test the hypothesis that I have from equation (1), ‘Public Debt does
not Granger cause Economic Growth’ if
18
variable, economic globalization. Accordingly, the models can be specified as follows:
Public Debt equation (1):
𝑃𝑃𝑃𝑃𝑡𝑡= 𝛼𝛼0+ ∑ 𝛽𝛽1𝑖𝑖𝑃𝑃𝑃𝑃𝑡𝑡−𝑖𝑖+ ∑ 𝛽𝛽2𝑗𝑗𝑃𝑃𝑃𝑃𝑡𝑡−𝑗𝑗+ ∑ 𝛾𝛾1𝑗𝑗𝑙𝑙𝑙𝑙𝑙𝑙𝑃𝑃𝑃𝑃𝑡𝑡−𝑖𝑖+ 𝑘𝑘 𝑖𝑖=1 𝑑𝑑𝑚𝑚𝑚𝑚𝑚𝑚 𝑗𝑗=𝑘𝑘+1 ∑ 𝛾𝛾2𝑗𝑗𝑙𝑙𝑙𝑙𝑙𝑙𝑃𝑃𝑃𝑃𝑡𝑡−𝑗𝑗 𝑑𝑑𝑚𝑚𝑚𝑚𝑚𝑚 𝑗𝑗=𝑘𝑘+1 𝑘𝑘 𝑖𝑖=1 + ∑ 𝜃𝜃1𝑖𝑖𝐸𝐸𝐸𝐸𝐸𝐸𝐸𝐸𝑡𝑡−𝑖𝑖 𝑘𝑘 𝑖𝑖=1 + ∑ 𝜃𝜃2𝑗𝑗𝐸𝐸𝐸𝐸𝐸𝐸𝐸𝐸𝑡𝑡−𝑗𝑗 𝑑𝑑𝑚𝑚𝑚𝑚𝑚𝑚 𝑗𝑗=𝑘𝑘+1 + 𝜀𝜀1𝑡𝑡
Economic Growth equation (2):
𝑙𝑙𝑙𝑙𝑙𝑙𝑃𝑃𝑃𝑃𝑡𝑡= 𝛼𝛼̃0+ ∑ 𝛽𝛽̃1𝑖𝑖𝑃𝑃𝑃𝑃𝑡𝑡−𝑖𝑖+ ∑ 𝛽𝛽̃2𝑗𝑗𝑃𝑃𝑃𝑃𝑡𝑡−𝑗𝑗+ ∑ 𝛾𝛾̃1𝑗𝑗𝑙𝑙𝑙𝑙𝑙𝑙𝑃𝑃𝑃𝑃𝑡𝑡−𝑖𝑖+ 𝑘𝑘 𝑖𝑖=1 𝑑𝑑𝑚𝑚𝑚𝑚𝑚𝑚 𝑗𝑗=𝑘𝑘+1 ∑ 𝛾𝛾̃2𝑗𝑗𝑙𝑙𝑙𝑙𝑙𝑙𝑃𝑃𝑃𝑃𝑡𝑡−𝑗𝑗 𝑑𝑑𝑚𝑚𝑚𝑚𝑚𝑚 𝑗𝑗=𝑘𝑘+1 𝑘𝑘 𝑖𝑖=1 + ∑ 𝜃𝜃̃1𝑖𝑖𝐸𝐸𝐸𝐸𝐸𝐸𝐸𝐸𝑡𝑡−𝑖𝑖 𝑘𝑘 𝑖𝑖=1 + ∑ 𝜃𝜃̃2𝑗𝑗𝐸𝐸𝐸𝐸𝐸𝐸𝐸𝐸𝑡𝑡−𝑗𝑗 𝑑𝑑𝑚𝑚𝑚𝑚𝑚𝑚 𝑗𝑗=𝑘𝑘+1 + 𝜀𝜀2𝑡𝑡
where PD
tand lnPD
t-1are the current and lagged levels of public debt of a country at periods
t and t-1; lnGDP
t-1is the lagged natural logarithm of real per capita GDP of a country at time
t-1. k is the optimal lag order, d
maxis the maximal order of integration of the series in the
system and ε
1, ε
2are the error terms that are assumed to be white noise. Conventional Wald
tests were then applied to the first k coefficient matrices using the standard χ2- statistics. To
test the hypothesis that I have from equation (1), ‘Public Debt does not Granger cause
Economic Growth’ if H
0: 𝛾𝛾
1𝑖𝑖= 0 against H
1: 𝛾𝛾
1𝑖𝑖≠ 0, and in equation (2), ‘Economic Growth
does not Granger cause Public Debt’ if H
0: 𝛾𝛾
2𝑖𝑖= 0 against H
1: 𝛾𝛾
2𝑖𝑖≠ 0, for every i=1, 2, …,
k.
against
18
variable, economic globalization. Accordingly, the models can be specified as follows:
Public Debt equation (1):
𝑃𝑃𝑃𝑃𝑡𝑡= 𝛼𝛼0+ ∑ 𝛽𝛽1𝑖𝑖𝑃𝑃𝑃𝑃𝑡𝑡−𝑖𝑖+ ∑ 𝛽𝛽2𝑗𝑗𝑃𝑃𝑃𝑃𝑡𝑡−𝑗𝑗+ ∑ 𝛾𝛾1𝑗𝑗𝑙𝑙𝑙𝑙𝑙𝑙𝑃𝑃𝑃𝑃𝑡𝑡−𝑖𝑖+ 𝑘𝑘 𝑖𝑖=1 𝑑𝑑𝑚𝑚𝑚𝑚𝑚𝑚 𝑗𝑗=𝑘𝑘+1 ∑ 𝛾𝛾2𝑗𝑗𝑙𝑙𝑙𝑙𝑙𝑙𝑃𝑃𝑃𝑃𝑡𝑡−𝑗𝑗 𝑑𝑑𝑚𝑚𝑚𝑚𝑚𝑚 𝑗𝑗=𝑘𝑘+1 𝑘𝑘 𝑖𝑖=1 + ∑ 𝜃𝜃1𝑖𝑖𝐸𝐸𝐸𝐸𝐸𝐸𝐸𝐸𝑡𝑡−𝑖𝑖 𝑘𝑘 𝑖𝑖=1 + ∑ 𝜃𝜃2𝑗𝑗𝐸𝐸𝐸𝐸𝐸𝐸𝐸𝐸𝑡𝑡−𝑗𝑗 𝑑𝑑𝑚𝑚𝑚𝑚𝑚𝑚 𝑗𝑗=𝑘𝑘+1 + 𝜀𝜀1𝑡𝑡
Economic Growth equation (2):
𝑙𝑙𝑙𝑙𝑙𝑙𝑃𝑃𝑃𝑃𝑡𝑡= 𝛼𝛼̃0+ ∑ 𝛽𝛽̃1𝑖𝑖𝑃𝑃𝑃𝑃𝑡𝑡−𝑖𝑖+ ∑ 𝛽𝛽̃2𝑗𝑗𝑃𝑃𝑃𝑃𝑡𝑡−𝑗𝑗+ ∑ 𝛾𝛾̃1𝑗𝑗𝑙𝑙𝑙𝑙𝑙𝑙𝑃𝑃𝑃𝑃𝑡𝑡−𝑖𝑖+ 𝑘𝑘 𝑖𝑖=1 𝑑𝑑𝑚𝑚𝑚𝑚𝑚𝑚 𝑗𝑗=𝑘𝑘+1 ∑ 𝛾𝛾̃2𝑗𝑗𝑙𝑙𝑙𝑙𝑙𝑙𝑃𝑃𝑃𝑃𝑡𝑡−𝑗𝑗 𝑑𝑑𝑚𝑚𝑚𝑚𝑚𝑚 𝑗𝑗=𝑘𝑘+1 𝑘𝑘 𝑖𝑖=1 + ∑ 𝜃𝜃̃1𝑖𝑖𝐸𝐸𝐸𝐸𝐸𝐸𝐸𝐸𝑡𝑡−𝑖𝑖 𝑘𝑘 𝑖𝑖=1 + ∑ 𝜃𝜃̃2𝑗𝑗𝐸𝐸𝐸𝐸𝐸𝐸𝐸𝐸𝑡𝑡−𝑗𝑗 𝑑𝑑𝑚𝑚𝑚𝑚𝑚𝑚 𝑗𝑗=𝑘𝑘+1 + 𝜀𝜀2𝑡𝑡
where PD
tand lnPD
t-1are the current and lagged levels of public debt of a country at periods
t and t-1; lnGDP
t-1is the lagged natural logarithm of real per capita GDP of a country at time
t-1. k is the optimal lag order, d
maxis the maximal order of integration of the series in the
system and ε
1, ε
2are the error terms that are assumed to be white noise. Conventional Wald
tests were then applied to the first k coefficient matrices using the standard χ2- statistics. To
test the hypothesis that I have from equation (1), ‘Public Debt does not Granger cause
Economic Growth’ if H
0: 𝛾𝛾
1𝑖𝑖= 0 against H
1: 𝛾𝛾
1𝑖𝑖≠ 0, and in equation (2), ‘Economic Growth
does not Granger cause Public Debt’ if H
0: 𝛾𝛾
2𝑖𝑖= 0 against H
1: 𝛾𝛾
2𝑖𝑖≠ 0, for every i=1, 2, …,
k.
, and in equation (2), ‘Economic
Growth does not Granger cause Public Debt’ if
18
Public Debt equation (1):
𝑃𝑃𝑃𝑃𝑡𝑡= 𝛼𝛼0+ ∑ 𝛽𝛽1𝑖𝑖𝑃𝑃𝑃𝑃𝑡𝑡−𝑖𝑖+ ∑ 𝛽𝛽2𝑗𝑗𝑃𝑃𝑃𝑃𝑡𝑡−𝑗𝑗+ ∑ 𝛾𝛾1𝑗𝑗𝑙𝑙𝑙𝑙𝑙𝑙𝑃𝑃𝑃𝑃𝑡𝑡−𝑖𝑖+ 𝑘𝑘 𝑖𝑖=1 𝑑𝑑𝑚𝑚𝑚𝑚𝑚𝑚 𝑗𝑗=𝑘𝑘+1 ∑ 𝛾𝛾2𝑗𝑗𝑙𝑙𝑙𝑙𝑙𝑙𝑃𝑃𝑃𝑃𝑡𝑡−𝑗𝑗 𝑑𝑑𝑚𝑚𝑚𝑚𝑚𝑚 𝑗𝑗=𝑘𝑘+1 𝑘𝑘 𝑖𝑖=1 + ∑ 𝜃𝜃1𝑖𝑖𝐸𝐸𝐸𝐸𝐸𝐸𝐸𝐸𝑡𝑡−𝑖𝑖 𝑘𝑘 𝑖𝑖=1 + ∑ 𝜃𝜃2𝑗𝑗𝐸𝐸𝐸𝐸𝐸𝐸𝐸𝐸𝑡𝑡−𝑗𝑗 𝑑𝑑𝑚𝑚𝑚𝑚𝑚𝑚 𝑗𝑗=𝑘𝑘+1 + 𝜀𝜀1𝑡𝑡
Economic Growth equation (2):
𝑙𝑙𝑙𝑙𝑙𝑙𝑃𝑃𝑃𝑃𝑡𝑡= 𝛼𝛼̃0+ ∑ 𝛽𝛽̃1𝑖𝑖𝑃𝑃𝑃𝑃𝑡𝑡−𝑖𝑖+ ∑ 𝛽𝛽̃2𝑗𝑗𝑃𝑃𝑃𝑃𝑡𝑡−𝑗𝑗+ ∑ 𝛾𝛾̃1𝑗𝑗𝑙𝑙𝑙𝑙𝑙𝑙𝑃𝑃𝑃𝑃𝑡𝑡−𝑖𝑖+ 𝑘𝑘 𝑖𝑖=1 𝑑𝑑𝑚𝑚𝑚𝑚𝑚𝑚 𝑗𝑗=𝑘𝑘+1 ∑ 𝛾𝛾̃2𝑗𝑗𝑙𝑙𝑙𝑙𝑙𝑙𝑃𝑃𝑃𝑃𝑡𝑡−𝑗𝑗 𝑑𝑑𝑚𝑚𝑚𝑚𝑚𝑚 𝑗𝑗=𝑘𝑘+1 𝑘𝑘 𝑖𝑖=1 + ∑ 𝜃𝜃̃1𝑖𝑖𝐸𝐸𝐸𝐸𝐸𝐸𝐸𝐸𝑡𝑡−𝑖𝑖 𝑘𝑘 𝑖𝑖=1 + ∑ 𝜃𝜃̃2𝑗𝑗𝐸𝐸𝐸𝐸𝐸𝐸𝐸𝐸𝑡𝑡−𝑗𝑗 𝑑𝑑𝑚𝑚𝑚𝑚𝑚𝑚 𝑗𝑗=𝑘𝑘+1 + 𝜀𝜀2𝑡𝑡
where PD
tand lnPD
t-1are the current and lagged levels of public debt of a country at periods
t and t-1; lnGDP
t-1is the lagged natural logarithm of real per capita GDP of a country at time
t-1. k is the optimal lag order, d
maxis the maximal order of integration of the series in the
system and ε
1, ε
2are the error terms that are assumed to be white noise. Conventional Wald
tests were then applied to the first k coefficient matrices using the standard χ2- statistics. To
test the hypothesis that I have from equation (1), ‘Public Debt does not Granger cause
Economic Growth’ if H
0: 𝛾𝛾
1𝑖𝑖= 0 against H
1: 𝛾𝛾
1𝑖𝑖≠ 0, and in equation (2), ‘Economic Growth
does not Granger cause Public Debt’ if H
0: 𝛾𝛾
2𝑖𝑖= 0 against H
1: 𝛾𝛾
2𝑖𝑖≠ 0, for every i=1, 2, …,
k.
against
18
Public Debt equation (1):
𝑃𝑃𝑃𝑃𝑡𝑡= 𝛼𝛼0+ ∑ 𝛽𝛽1𝑖𝑖𝑃𝑃𝑃𝑃𝑡𝑡−𝑖𝑖+ ∑ 𝛽𝛽2𝑗𝑗𝑃𝑃𝑃𝑃𝑡𝑡−𝑗𝑗+ ∑ 𝛾𝛾1𝑗𝑗𝑙𝑙𝑙𝑙𝑙𝑙𝑃𝑃𝑃𝑃𝑡𝑡−𝑖𝑖+ 𝑘𝑘 𝑖𝑖=1 𝑑𝑑𝑚𝑚𝑚𝑚𝑚𝑚 𝑗𝑗=𝑘𝑘+1 ∑ 𝛾𝛾2𝑗𝑗𝑙𝑙𝑙𝑙𝑙𝑙𝑃𝑃𝑃𝑃𝑡𝑡−𝑗𝑗 𝑑𝑑𝑚𝑚𝑚𝑚𝑚𝑚 𝑗𝑗=𝑘𝑘+1 𝑘𝑘 𝑖𝑖=1 + ∑ 𝜃𝜃1𝑖𝑖𝐸𝐸𝐸𝐸𝐸𝐸𝐸𝐸𝑡𝑡−𝑖𝑖 𝑘𝑘 𝑖𝑖=1 + ∑ 𝜃𝜃2𝑗𝑗𝐸𝐸𝐸𝐸𝐸𝐸𝐸𝐸𝑡𝑡−𝑗𝑗 𝑑𝑑𝑚𝑚𝑚𝑚𝑚𝑚 𝑗𝑗=𝑘𝑘+1 + 𝜀𝜀1𝑡𝑡
Economic Growth equation (2):
𝑙𝑙𝑙𝑙𝑙𝑙𝑃𝑃𝑃𝑃𝑡𝑡= 𝛼𝛼̃0+ ∑ 𝛽𝛽̃1𝑖𝑖𝑃𝑃𝑃𝑃𝑡𝑡−𝑖𝑖+ ∑ 𝛽𝛽̃2𝑗𝑗𝑃𝑃𝑃𝑃𝑡𝑡−𝑗𝑗+ ∑ 𝛾𝛾̃1𝑗𝑗𝑙𝑙𝑙𝑙𝑙𝑙𝑃𝑃𝑃𝑃𝑡𝑡−𝑖𝑖+ 𝑘𝑘 𝑖𝑖=1 𝑑𝑑𝑚𝑚𝑚𝑚𝑚𝑚 𝑗𝑗=𝑘𝑘+1 ∑ 𝛾𝛾̃2𝑗𝑗𝑙𝑙𝑙𝑙𝑙𝑙𝑃𝑃𝑃𝑃𝑡𝑡−𝑗𝑗 𝑑𝑑𝑚𝑚𝑚𝑚𝑚𝑚 𝑗𝑗=𝑘𝑘+1 𝑘𝑘 𝑖𝑖=1 + ∑ 𝜃𝜃̃1𝑖𝑖𝐸𝐸𝐸𝐸𝐸𝐸𝐸𝐸𝑡𝑡−𝑖𝑖 𝑘𝑘 𝑖𝑖=1 + ∑ 𝜃𝜃̃2𝑗𝑗𝐸𝐸𝐸𝐸𝐸𝐸𝐸𝐸𝑡𝑡−𝑗𝑗 𝑑𝑑𝑚𝑚𝑚𝑚𝑚𝑚 𝑗𝑗=𝑘𝑘+1 + 𝜀𝜀2𝑡𝑡
where PD
tand lnPD
t-1are the current and lagged levels of public debt of a country at periods
t and t-1; lnGDP
t-1is the lagged natural logarithm of real per capita GDP of a country at time
t-1. k is the optimal lag order, d
maxis the maximal order of integration of the series in the
system and ε
1, ε
2are the error terms that are assumed to be white noise. Conventional Wald
tests were then applied to the first k coefficient matrices using the standard χ2- statistics. To
test the hypothesis that I have from equation (1), ‘Public Debt does not Granger cause
Economic Growth’ if H
0: 𝛾𝛾
1𝑖𝑖= 0 against H
1: 𝛾𝛾
1𝑖𝑖≠ 0, and in equation (2), ‘Economic Growth
does not Granger cause Public Debt’ if H
0: 𝛾𝛾
2𝑖𝑖= 0 against H
1: 𝛾𝛾
2𝑖𝑖≠ 0, for every i=1, 2, …,
k.
, for every i=1, 2, …, k.
4. EMPIRICAL RESULTS
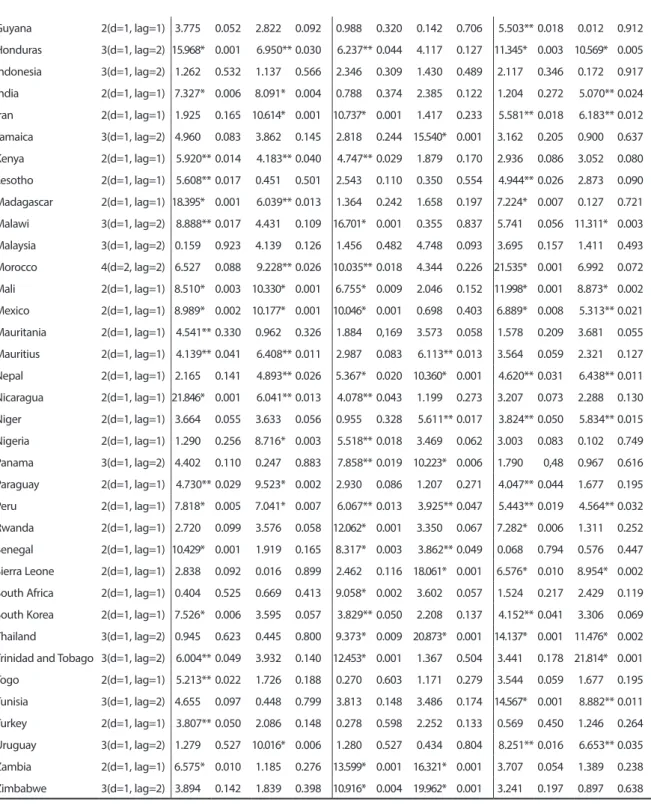
In this section, I report the results of unit root tests in Table 4 and Toda-Yamamoto (1995) augmented
Granger non-causality tests for the VAR models (1) and (2) for each country in Table 5. I also present
summarized results in Table 6.
To provide the order of integration, I use the Augmented Dickey-Fuller (ADF) unit root test frequently used
in the literature, to determine the stationarity of the series. The test is performed on a country-by-country
basis. The results of the unit root test for the variables in their levels and first differences are reported in
Table 4. The results show that the first differences of the economic growth, public debt, and economic
globalization series are stationary, implying that these variables are integrated of order one, I(1) at the 5
% significance level for all countries, except Bolivia, Democratic Republic of Congo, Costa Rica, Morocco
and Nepal in which the variables are integrated of order two.
Furthermore, the Akaike information criterion (AIC) is applied for the selection of the optimal order of the
lag length of the VAR model for each country. The results of the determination of the optimal lag length
of each VAR models, out of a maximum of 4 lengths, are determined by AIC. Besides, the χ2 (1) statistics
indicate that there is no serial correlation against order 1 for these lag lengths determined by AIC.
As suggested above, a Granger causality procedure developed by Toda and Yamamoto is employed to
determine the direction of causality. Unit root test results and Table 4 report the optimal lag length (k),
VAR order (k+d
max), MWald statistics, p–values and direction of causality in the VAR model for each country.
The results in Table 5 show that both the null hypothesizes of Granger non-causal relationship among
Economic Globalization, Public Debt, and Economic Growth.
18
Country Lags
Ecog>PD GDPpc >PD Ecog>GDPpc PD>GDPpc GDPpc>Ecog PD>Ecog Wald
statisticp-valuestatisticWald p-valuestatisticWald p-valuestatisticWald p-valuestatisticWald p-valuestatisticWald p-value
Algeria 2(d=1, lag=1) 7.703* 0.005 1.328 0.249 12.900* 0.001 7.993* 0.004 2.685 0.101 1.690 0.193 Albania 2(d=1, lag=1) 4.096** 0.042 8.117* 0.004 2.368 0.123 8.473* 0.003 9.656* 0.001 2.298 0.129 Angola 2(d=1, lag=1) 2.656 0.103 0.030 0.862 7.068* 0.007 7.140* 0.007 0.887 0.346 2.576 0.108 Argentina 2(d=1, lag=1) 11.518* 0,001 2.927 0,087 0.947 0.330 5.216** 0,022 4.562** 0.032 1.260 0.261 Burundi 2(d=1, lag=1) 1.404 0.236 2.876 0.089 7.079* 0.007 1.417 0.233 5.630** 0.017 5.803** 0.015 Benin 2(d=1, lag=1) 1.816 0.177 9.024* 0.002 1.576 0.209 1.259 0.261 2.150 0.142 2.772 0.095
Burkina Faso 2(d=1, lag=1) 2.016 0.155 2.863 0.090 1.743 0,186 0.053 0.817 5.670** 0.017 2.125 0.144
Bangladesh 2(d=1, lag=1) 5.501** 0.019 3.170 0.075 8.849* 0.002 3.152 0.075 1.232 0.267 4.473** 0.034 Bolivia 5(d=2, lag=1) 15.518* 0.001 29.253* 0.001 4.801 0.090 15.828* 0.001 8.902** 0.011 15.518* 0.001 Brazil 2(d=1, lag=1) 0.504 0.477 3.667 0.055 11.670* 0.001 0.102 0.749 6.934* 0.008 1.281 0.257 Barbados 2(d=1, lag=1) 1.687 0.193 7.252* 0.007 0.676 0.410 1.655 0.198 7.045* 0.007 7.139* 0.007 Bhutan 2(d=1, lag=1) 1.160 0.281 5.582** 0.018 0.503 0.478 0.997 0.318 4.883** 0.027 2.086 0.148 Botswana 2(d=1, lag=1) 2.898 0.088 5.836** 0.015 0.079 0.778 0.345 0.556 3.636 0.056 0.962 0.326 Bulgaria 2(d=1, lag=1) 2.381 0.122 1.355 0.244 2.618 0.105 1.630 0.201 16.929* 0.001 9.072* 0.002
Cape Verde 2(d=1, lag=1) 4.566** 0.032 8.926* 0.002 4.782** 0.028 1.115 0.290 0.596 0.440 0.413 0.520
Camerron 2(d=1, lag=1) 1.654 0.198 2.607 0.106 6.244** 0.012 4.263** 0.038 2.136 0.143 5.189** 0.022
Central Af. R. 2(d=1, lag=1) 2.126 0.144 2.737 0.098 0.079 0.778 0.720 0.396 4.379** 0.036 2.596 0.107
Chad 2(d=1, lag=1) 0.392 0.531 1.235 0.266 11.600* 0.001 7.536* 0.006 1.969 0.160 2.414 0.120
Chile 3(d=1, lag=2) 9.817* 0.007 10.363* 0.005 2.521 0.283 11.642* 0.002 2.454 0.293 0.845 0.655
China 2(d=1, lag=1) 3.477 0.062 6.249** 0.012 4.177** 0.040 1.451 0.228 3.634 0.056 4.309** 0.037
Dem.R.Congo 4(d=2, lag=2) 5.199 0.157 1.379 0.710 8.411** 0.038 16.986* 0.001 10.246** 0.016 1.791 0.616
Rep. of Congo 2(d=1, lag=1) 3.899** 0.048 2.153 0.142 2.668 0.102 2.531 0.111 0.587 0.443 2.636 0.104
Colombia 2(d=1, lag=1) 1.067 0.301 7.801* 0.005 1.799 0.179 0.313 0.575 8.117* 0.004 12.166* 0.001
Comoros 2(d=1, lag=1) 2.388 0.122 2.080 0.149 2.431 0.118 0.263 0.608 6.945* 0.008 0.168 0.681
Costa Rica 3(d=2, lag=1) 4.058 0.131 5.733 0.056 0.548 0.760 25.755* 0.001 0.928 0.628 1.069 0.585
Dominican R. 2(d=1, lag=1) 7.921* 0.004 7.478* 0.001 3.953** 0.046 1.579 0.208 6.557* 0.010 4.493** 0.034 Ecuador 2(d=1, lag=1) 7.542* 0.006 5.734** 0.016 3.230 0.072 7.960* 0.004 2.060 0.151 0.498 0.480 Egypt 2(d=1, lag=1) 2.388 0.122 2.272 0.131 3.262 0.070 2.468 0.116 1.497 0.221 3.004 0.083 El Salvador 3(d=1, lag=2) 9.491* 0.008 15.972* 0.001 3.386 0.183 2.023 0.363 2.843 0.241 1.160 0.559 Ethiopia 2(d=1, lag=1) 1.094 0.295 6.607* 0.010 7.396* 0.006 1.480 0.223 1.525 0.216 2.614 0.105 Fiji 2(d=1, lag=1) 3.326 0.068 1.420 0.233 8.778* 0.003 5.696** 0.017 0.389 0.532 4.816** 0.028 Gabon 2(d=1, lag=1) 0.039 0.843 2.940 0.086 6.266** 0.012 0.057 0.811 1.428 0.232 1.941 0.163 Ghana 2(d=1, lag=1) 0.333 0.563 2.122 0.145 4.693** 0.030 1.449 0.228 1.152 0.283 12.840* 0.001 Gambia 2(d=1, lag=1) 7.695* 0.005 7.897* 0.004 8.421* 0.003 12.915* 0.001 0.965 0.325 2.008 0.156 Equatorial G. 2(d=1, lag=1) 5.445** 0.019 4.191** 0.040 16.530* 0.001 2.426 0.119 6.276** 0.012 8.462* 0.003 Guatemala 3(d=1, lag=2) 5.330 0.069 5.691 0.058 18.165* 0.001 2.454 0.293 3.400 0.182 9.060 0.107
19
Guyana 2(d=1, lag=1) 3.775 0.052 2.822 0.092 0.988 0.320 0.142 0.706 5.503** 0.018 0.012 0.912 Honduras 3(d=1, lag=2) 15.968* 0.001 6.950** 0.030 6.237** 0.044 4.117 0.127 11.345* 0.003 10.569* 0.005 Indonesia 3(d=1, lag=2) 1.262 0.532 1.137 0.566 2.346 0.309 1.430 0.489 2.117 0.346 0.172 0.917 India 2(d=1, lag=1) 7.327* 0.006 8.091* 0.004 0.788 0.374 2.385 0.122 1.204 0.272 5.070** 0.024 Iran 2(d=1, lag=1) 1.925 0.165 10.614* 0.001 10.737* 0.001 1.417 0.233 5.581** 0.018 6.183** 0.012 Jamaica 3(d=1, lag=2) 4.960 0.083 3.862 0.145 2.818 0.244 15.540* 0.001 3.162 0.205 0.900 0.637 Kenya 2(d=1, lag=1) 5.920** 0.014 4.183** 0.040 4.747** 0.029 1.879 0.170 2.936 0.086 3.052 0.080 Lesotho 2(d=1, lag=1) 5.608** 0.017 0.451 0.501 2.543 0.110 0.350 0.554 4.944** 0.026 2.873 0.090 Madagascar 2(d=1, lag=1) 18.395* 0.001 6.039** 0.013 1.364 0.242 1.658 0.197 7.224* 0.007 0.127 0.721 Malawi 3(d=1, lag=2) 8.888** 0.017 4.431 0.109 16.701* 0.001 0.355 0.837 5.741 0.056 11.311* 0.003 Malaysia 3(d=1, lag=2) 0.159 0.923 4.139 0.126 1.456 0.482 4.748 0.093 3.695 0.157 1.411 0.493 Morocco 4(d=2, lag=2) 6.527 0.088 9.228** 0.026 10.035** 0.018 4.344 0.226 21.535* 0.001 6.992 0.072 Mali 2(d=1, lag=1) 8.510* 0.003 10.330* 0.001 6.755* 0.009 2.046 0.152 11.998* 0.001 8.873* 0.002 Mexico 2(d=1, lag=1) 8.989* 0.002 10.177* 0.001 10.046* 0.001 0.698 0.403 6.889* 0.008 5.313** 0.021 Mauritania 2(d=1, lag=1) 4.541** 0.330 0.962 0.326 1.884 0,169 3.573 0.058 1.578 0.209 3.681 0.055 Mauritius 2(d=1, lag=1) 4.139** 0.041 6.408** 0.011 2.987 0.083 6.113** 0.013 3.564 0.059 2.321 0.127 Nepal 2(d=1, lag=1) 2.165 0.141 4.893** 0.026 5.367* 0.020 10.360* 0.001 4.620** 0.031 6.438** 0.011 Nicaragua 2(d=1, lag=1) 21.846* 0.001 6.041** 0.013 4.078** 0.043 1.199 0.273 3.207 0.073 2.288 0.130 Niger 2(d=1, lag=1) 3.664 0.055 3.633 0.056 0.955 0.328 5.611** 0.017 3.824** 0.050 5.834** 0.015 Nigeria 2(d=1, lag=1) 1.290 0.256 8.716* 0.003 5.518** 0.018 3.469 0.062 3.003 0.083 0.102 0.749 Panama 3(d=1, lag=2) 4.402 0.110 0.247 0.883 7.858** 0.019 10.223* 0.006 1.790 0,48 0.967 0.616 Paraguay 2(d=1, lag=1) 4.730** 0.029 9.523* 0.002 2.930 0.086 1.207 0.271 4.047** 0.044 1.677 0.195 Peru 2(d=1, lag=1) 7.818* 0.005 7.041* 0.007 6.067** 0.013 3.925** 0.047 5.443** 0.019 4.564** 0.032 Rwanda 2(d=1, lag=1) 2.720 0.099 3.576 0.058 12.062* 0.001 3.350 0.067 7.282* 0.006 1.311 0.252 Senegal 2(d=1, lag=1) 10.429* 0.001 1.919 0.165 8.317* 0.003 3.862** 0.049 0.068 0.794 0.576 0.447Sierra Leone 2(d=1, lag=1) 2.838 0.092 0.016 0.899 2.462 0.116 18.061* 0.001 6.576* 0.010 8.954* 0.002
South Africa 2(d=1, lag=1) 0.404 0.525 0.669 0.413 9.058* 0.002 3.602 0.057 1.524 0.217 2.429 0.119
South Korea 2(d=1, lag=1) 7.526* 0.006 3.595 0.057 3.829** 0.050 2.208 0.137 4.152** 0.041 3.306 0.069
Thailand 3(d=1, lag=2) 0.945 0.623 0.445 0.800 9.373* 0.009 20.873* 0.001 14.137* 0.001 11.476* 0.002
Trinidad and Tobago 3(d=1, lag=2) 6.004** 0.049 3.932 0.140 12.453* 0.001 1.367 0.504 3.441 0.178 21.814* 0.001
Togo 2(d=1, lag=1) 5.213** 0.022 1.726 0.188 0.270 0.603 1.171 0.279 3.544 0.059 1.677 0.195 Tunisia 3(d=1, lag=2) 4.655 0.097 0.448 0.799 3.813 0.148 3.486 0.174 14.567* 0.001 8.882** 0.011 Turkey 2(d=1, lag=1) 3.807** 0.050 2.086 0.148 0.278 0.598 2.252 0.133 0.569 0.450 1.246 0.264 Uruguay 3(d=1, lag=2) 1.279 0.527 10.016* 0.006 1.280 0.527 0.434 0.804 8.251** 0.016 6.653** 0.035 Zambia 2(d=1, lag=1) 6.575* 0.010 1.185 0.276 13.599* 0.001 16.321* 0.001 3.707 0.054 1.389 0.238 Zimbabwe 3(d=1, lag=2) 3.894 0.142 1.839 0.398 10.916* 0.004 19.962* 0.001 3.241 0.197 0.897 0.638
* Indicates rejection of the null at the 1 percent. ** Indicates rejection of the null at the 5 percent.
20
The results in Table 4 shows that the Toda-Yamamoto augmented Granger causality is statistically
significant in 45 countries. While there is unidirectional causality from economic growth to public debt
in 21 countries, in 15 countries the causality is in the opposite direction. Only in 9 countries, there is the
validity of feedback causality.
The causality is running from economic growth to public debt in 21 economies, which consist of 4 less
developed (Ethiopia, Mali, Bhutan and Madagascar), 17 developing ( Barbados, Cape Verde, Colombia,
Dominican Republic, El Salvador, India, Mexico, Nigeria, Paraguay, Uruguay, Botswana, China, Equatorial
Guinea, Honduras, Kenya, Morocco, Nicaragua). The empirical results provide evidence that either effective
or ineffective economic policies, that influence economic growth in these economies lead to a change
in government debt ratios in these economies.
Furthermore, the causality in opposite direction suggesting that public debt causes economic growth
is valid in 15 countries, including 7 less developed (Angola, Chad, Democratic Republic of Congo, Niger,
Senegal, Sierra Leone, and Zambia), 8 developing (Algeria, Argentina, Cameroon, Costa Rica, Fiji, Panama,
Thailand, and Zimbabwe). These results reflect that these countries could apply fiscal policies, such as
expansionary or contractionary, to change either the structure of aggregate demand or the long term
interest rates in these economies. The change in the public debt ratio leads to a favorable or an adverse
effect on capital inflows in these countries that could result in low or high economic growth rates.
In addition, I find feedback causality in 2 less developed countries (Gambia and Nepal) and 7 developing
(Albania, Bolivia, Chile, Iran, Peru, Ecuador, Mauritius). There is no empirical evidence on the mutual relation
between fiscal policies and growth in less developed countries.
The above results provide that in the major part of the statistically significant cases, every country in
different economic development levels could confront problems with the public debt which could rely
on unsustainable fiscal deficits leads to high real interest rates. According to Elmendof and Mankiw (1998),
the fiscal deficits make a reduction in the national savings and a rise in the aggregate demand in the
economy. In addition, public debt may cause an adverse effect on labor supply and economic growth
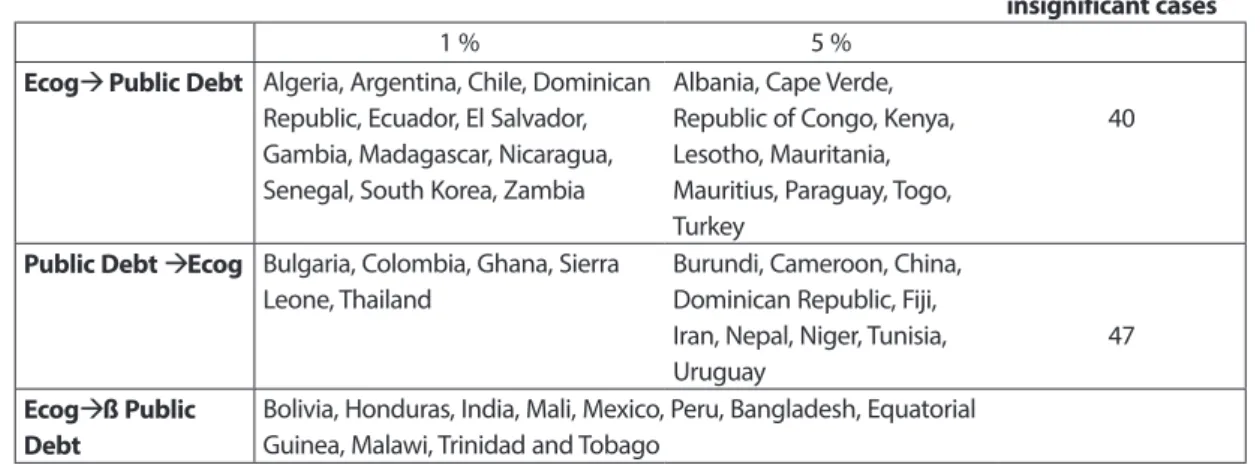
through lower investment levels. The results are summarized in Tables 6a and 6b.
Statistically significant cases Statistically insignificant cases
1 % 5 %
Economic growth à Public Debt
Barbados, Cape Verde, Colombia, Dominican Republic, El Salvador, Ethiopia, India, Mali, Mexico, Nigeria, Paraguay, Uruguay
Bhutan, Botswana, China, Equatorial Guinea, Honduras, Kenya, Madagascar, Morocco, Nicaragua
42
Public Debt àEconomic Growth
Algeria, Angola, Chad, Democratic Republic of Congo, Costa Rica, Panama, Sierra Leone, Thailand, Zambia, Zimbabwe
Argentina, Cameroon, Fiji, Niger, Senegal
48 Economic Growth
àß Public Debt
Albania, Bolivia, Chile, Gambia, Iran, Peru, Ecuador, Mauritius, Nepal Table 6a. Summary of the Toda-Yamamoto augmented Granger Causality Test Results.