Arch Neuropsychiatry 2018;55:84−90 https://doi.org/10.29399/npa.23018 RESEARCH ARTICLE
Cognitive Dysfunction in Relation to Topography and Burden of Cerebral
Microbleeds
Gülseren BÜYÜKŞERBETÇİ
1,2, Esen SAKA
2, Kader KARLI OĞUZ
3, Rahşan GÖÇMEN
3, Ethem Murat ARSAVA
2,
Mehmet Akif TOPÇUOĞLU
21Department of Neurology, Balıkesir University Hospital, Balıkesir, Turkey
2Department of Neurology, Hacettepe University Medical School Hospital, Ankara, Turkey 3Department of Radiology, Hacettepe University Medical School Hospital, Ankara, Turkey
Introduction: Contribution of cerebral microbleeds (CMBs) on cognitive dysfunctions in elderly patients with otherwise asymptomatic white matter lesions (WMLs) is not well-documented.
Methods: MRI parameters of cerebral atrophy, CMBs and WMLs were herein analyzed in relation to global and main domains (attention, executive, memory, visuospatial, language) of cognitive function. Eighty-five patients older than 50, without neurodegenerative/cerebrovascular disease, but had CMBs were recruited from 2562 with T2*-gradient-echo MR imaging during one-year period.
Results: Global cognition, evaluated by mini-mental status examination (MMSE), was impaired (score ≤24) in 42%. In contrast to CMBs load,
WML burden and temporal atrophy were significantly higher in cases with MMSE≤24. Cholinergic Pathways HyperIntensities Scale (CHIPS) was positively correlated with global cognitive dysfunction but its CMB counterpart, Cholinergic Pathways Bleeding Scale described herein, was not. However, burden of CMBs in thalamic/cortical regions predicted language dysfunction.
Conclusion: Cognitive dysfunction associated with CMBs may be dependent on their distribution rather than their absolute number. Keywords: Cholinergic, dementia, microbleed, lacune, white matter, cortex, cortical, magnetic resonance imaging, gradient echo
ABSTRACT
Cite this article as: Büyükşerbetçi G, Saka E, Oğuz Karlı K, Göçmen R, Arsava EM, Topçuoğlu MA. Cognitive Dysfunction in Relation to Topography and Burden of Cerebral Microbleeds. Arch Neuropsychiatry 2018;55:84-90. https://doi.org/10.29399/npa.23018
Correspondence Address: Esen Saka, Hacettepe Üniversitesi Tıp Fakültesi Hastanesi, Nöroloji Bölümü, Ankara, Türkiye • E-mail: [email protected] Received: 24.11.2017, Accepted: 03.12.2017, Available Online Date: 19.03.2018
©Copyright 2018 by Turkish Association of Neuropsychiatry - Available online at www.noropskiyatriarsivi.com
Cerebral microbleeds (CMBs) represent perivascular collections of hemosiderin deposits, and they appear as dot-like hypointense lesions on T2*-weighted gradient-recalled echo (GRE) and susceptibility-weighted magnetic resonance imaging (MRI) (1). In parallel to expanded usage of these iron sensitive MRI techniques in clinical and research arena, the need for understanding clinical implication of CMBs has become an active area of research. Pathologically, CMBs are linked to cerebral amyloid angiopathy and/or hypertensive vasculopathy; and recognized as MRI indices of small vessel disease along with white matter hyperintensities and lacunes (2–4). CMBs are not uncommon in healthy adults with a prevalence of around 5% (5). An increased prevalence has been reported in normal ageing, and individuals with cerebrovascular disorders and dementia (3, 4). In stroke patients, the presence, distribution and burden of CMBs are increasingly being recognized as valuable marker of etiology, stratification of future vascular risk including mortality along with modification, and monitoring of treatment (6). There has been also growing evidence for cumulative and/or strategic effect of otherwise silent CMBs on chronic neurological disability such as gait dysfunction (7), or cognitive decline (4, 8). However, these evidences
are not as consistent as WMLs (9). Observational cross-sectional nature of the published studies (10–18); inclusion of the subjects with various neurological illnesses already associated with cognitive decline, e.g. Alzheimer’s disease (11, 16, 19, 20), subcortical vascular dementia (14), cerebral autosomal dominant arteriopathy with subcortical infarcts and leukoencephalopathy (17, 21, 22), and stroke (23), as well as insufficient adjustment for other neuroimaging markers of small-vessel disease including white matter lesions (WML), or lacunar infarctions (11, 13); and absence of detailed cognitive profiling may be among the reasons for observed heterogeneity of these studies. Moreover, site of sampling of subjects –e.g. memory/cognitive neurology clinics (12, 13, 24), neurovascular units (15, 23)– may also be a factor. In population based cross sectional studies that compared the cognitive profiles of neurological disease-free subjects with and without CMBs, CMBs burden of subjects are usually low (15, 18, 25–27). On the other hand, in subjects recruited from memory clinics or neurovascular units CMB burden is usually higher. As a result, while no association of CMBs and cognitive dysfunction was observed in some studies (11, 13, 16), others documented a connection with either global (17, 18, 26) or
domain-INTRODUCTION
specific (12, 14, 15, 24–27) cognitive decline. Executive dysfunction was a frequent finding in subjects with CMBs (12, 26, 27), and it was related to frontal and temporal lobar predilection of CMBs (26).
In this study, we assess the relationship between CMBs/WML and cognitive function in patients with apparently-asymptomatic small vessel disease. Our specific interest is the definition of the effect of topographic distribution of CMBs, particularly involvement of cholinergic pathways, on cognition in addition to their number.
METHODS
Subjects
A total of 2562 subjects older than 50 years of age who underwent GRE imaging as part of brain MRI study at Hacettepe University Department of Radiology during a one-year-period (from December 1, 2009 to November 31, 2010) were screened for the presence of CMBs. In our institution, T2* GRE sequences are routinely obtained in diagnostic MRI studies for patients older than 50 years. We observed at least one CMB in 300 (11.7%) subjects. patients with a known diagnosis of neurodegenerative diseases or symptomatic cerebrovascular disorders (n=209) were excluded to restrict the study population to subjects with asymptomatic small vessel disease. The remaining 91 subjects were contacted via telephone, and were invited for neuropsychological assessment. Six patients died during the interval between the MRI study and our phone call. The remaining 85 subjects comprised the study population. Informed consent was obtained from all subjects. Hacettepe University Ethical Committee approved the study protocol. As a global measure of cognition, Mini-Mental State Examination (MMSE) was applied to all patients, and those with MMSE score below 24 are classified as cognitively impaired. Linear measures of cerebral atrophy, the number and topography of CMBs, WMLs and lacunes were comparatively analyzed in patients with and without cognitive impairment.
Cognitive Profiling
A neuropsychological test battery measuring attention (digit span forward, trail making (TMT) A test), executive functions (TMT B, five-point test, and phonemic fluency tests), memory (Rey’s auditory verbal learning test (AVLT), enhanced cued recall (ECR), category (semantic) fluency, visual reproduction subtest of Wecshler’s memory scale (immediate memory: WMS-VRI and delayed memory: VRII), visuospatial abilities (clock drawing test, line orientation test and Benton’s face recognition tests (FRT), language (30-item versions of the Boston naming test (BNT), phonemic fluency), and geriatric depression scale was administered. Scoring and administration of these tests have been described previously (28–37).
Neuroimaging Studies
MRI Parameters
MRI was performed using a 1.5-T scanner (Magnetom TIM, Siemens, Erlangen, Germany). Imaging included sagittal and axial T1-weighted (W) (time of repetition (TR)/time of echo (TE); 515/15 ms, matrix (mtx): 192 x 256) spin echo (SE), coronal and axial T2-W turbo SE (TR/TE; 4000/100 ms, mtx: 256 x 448), axial fluid-attenuated inversion-recovery (FLAIR) (TR/TE/TI; 8100/100/2100 ms, mtx: 224 x 256), and T2* gradient-echo (TR/TE; 860/26 ms, flip angle: 20°, mtx: 192 x 256) sequences all with a slice thickness of 5 mm, a 10% inter-slice distance and 220–240 mm field of view (FOV).
Lesion Interpretation and Analyses
Linear measures of atrophy, ratings of WMLs and CMBs were assessed blindly and independently by a study neurologist [MAT], and a study neuroradiologist [RG]. In case of discrepancy, scans were re-evaluated by the senior neuroradiologist [KKO] and another study neurologist [EMA];
and consensus scores were used in multivariate analyses.
White matter lesions: WMLs were evaluated on FLAIR and T2-weighted
images. Three semi-quantitative rating scales were used to analyze the extent and location of WMLs: Fazekas’ scale (38), Shelten’s or Age-Related White Matter Changes (ARWMC) scale (39), and Cholinergic Pathways HyperIntensities Scale (CHIPS) (40). The intra-class correlation coefficients were excellent for Fazekas’ subcortical and periventricular scores (0.971 and 0.952, respectively), and for ARWMC scale (0.963). The intra-class correlation coefficient for CHIPS scale was good (0.897). FLAIR images were also used for analysis of lacunes. They were defined as small (3 mm < diameter < 15 mm) hypointense lesions with a peripheral hyperintense rim located within the territory of a single perforating artery. Lacunes located within the cerebellum were excluded from the analyses. The intra-class correlation coefficient for lacune number was moderate (0.704 if total number <5; 0.697 if total number ≥5).
Cerebral microbleeds: CMBs were evaluated on GRE MRI. Round signal
void areas with a diameter smaller than 10 mm were assigned as CMBs in concordance with the recent guide on detection and interpretation by the Microbleed Study Group (1). The intra-class correlation coefficient for CMB number was good (r=0.968 in all; r=0.699 if CMB number ≤5; r=0.950 if CMB number between 6 and 19; r=0.710 if total number ≥20). The topographic distribution of CMBs was determined according to the areas included in both BOMBS (Brain Observer MicroBleed Scale) (41), and MARS (The Microbleed Anatomical Rating Scale) (42). Accordingly, CMB location was recorded as lobar (frontal, temporal, parietal, insular and occipital), deep (basal ganglia, external capsule, internal capsule, thalamus, corpus callosum, and deep and periventricular white matter), and infratentorial (medulla oblongata, cerebellum, pons, and mesencephalon) separately on both sides of the brain. Additionally, Cholinergic Pathways Bleeding (Microhemorrhage) Scale (CHBS), which is analogous to CHIPS (40), was described and used to evaluate the effects of CMBs on cholinergic pathways. The intra-class correlation coefficient for CHBS was good (r=0.810).
Linear measures of atrophy: Inter-uncal distance (IUD: linear distance
between the unci of temporal lobes), bitemporal distance (BTD: distance between outer margins of temporal lobes), and intracranial temporal width (ICTW: distance between the inner cranium) were measured at the level of suprasellar cistern on T1-weighted images (36, 43). IUD was normalized against ICTW (normalized (n) IUD = IUD/ICTW * 100) to exclude the effect of individual head size. We further calculated uncotemporal index (UTI = IUD/BTD * 100) (43). Intercaudate distance (ICD: linear distance between the medial borders of caudate nuclei) and intracranial caudate level width (ICCW: distance between table of the skull) were measured on the caudal-most axial slice where caudate nuclei and lateral ventricles could be visualized independent of image acquisition technique or slice thickness again on T1-weighted images. Further, intercaudate ratio (ICR: ICD/ICCW * 100) was provided to normalize ICD values (44). Intra-class correlation coefficients for all of the atrophy indices ranged from good to excellent: r=0.820 for IUD; r=0.763 for BTD; r=0.803 for ICTW; r=0.722 for nIUD; r=0.751 for UTI; r=0.882 for ICD; r=0.825 for ICCW and r=0.851 for nICD. Four cases with cavum septi pellucidi et vargae were excluded from caudate level measurements. Statistical Analysis
Comparison of demographic features, MRI findings (WML scores, CMBs, lacune numbers, linear measures of atrophy), and neuropsychological test scores between cognitively impaired and cognitively unimpaired groups were carried out by Student’s t-test, Mann-Whitney’s U test, and chi-square as appropriate. The effect of MRI on cognition was first evaluated with correlation analysis. Then, using MRI variables with p<0.10
in univariate analysis, in addition to age and school years, were entered into logistic regression analysis in order to determine the significance and independent role played by these factors in subjects’ performance on neuropsychological tests, which were further categorized into several aforementioned domains as attention, executive, memory, visuo-spatial, and language, in addition to global view assessed with total MMSE score. Statistical analyses were performed using the SPSS® (Statistical Package for the Social Sciences, version 21). All values were displayed as “mean ± standard deviation of the mean”, “median” or “percentage” where applicable. A gray-scale coding of p-values of correlation and regression analyses was displayed in Figure 1A and 1B for summary. Statistical significance level was set at p<0.05 in all analyses despite the presence of multiple comparisons due to the exploratory nature of the study.
RESULTS
Global cognition, evaluated by MMSE, was normal in 58% of subjects; and impaired in 42%. Demographics and results of neuropsychological tests are summarized in Table 1. Compared to subjects with normal global cognition, those with impaired cognition had significantly higher WML burden and more significant temporal atrophy. However, these two groups were not statistically different in terms of CMB number and location (Table 2).
We next sought relation of imaging findings with various cognitive functions in the whole study population. First of all, MMSE scores showed significant and inverse correlation with white matter disease measures and linear temporal volume measures but not with CMB number and distribution (Figure 1A). The most significant correlation was with the CHIPS (r=-0.484). Regression analysis revealed CHIPS (p=0.01) and nIUD
(p=0.029) along with education year (p=0.001) as significant independent predictors of MMSE (Figure 1B). Of note, the relationship between MMSE, and left hemispheric cortical CMB burden and UTI reached borderline significance in this model.
Attention was assessed by digits span forward and TMT-A tests. Digit span forward scores showed marginal but significant correlation with the CHIPS (r=-0.322, p=0.003), ARWMC (r=-0.252, p=0.022), lacune number (r=-0.237, p=0.032), Fazekas’ subcortical score (r=-0.261, p=0.016) and nIUD (r=-0.231, p=0.038). CHIPS were also correlated with TMT-A scores (r=-. 291, p=0.027). However, none of these imaging features showed a significant association with measures of attention in regression analyses (Figure 1A and B).
Executive function was evaluated with three tests. A significant correlation was found between TMT B scores and Fazekas’ subcortical score (r=0.295; p=0.029) as well as CHIPS (r=0.346; p=0.01). CHIPS was also significantly correlated with the phonemic fluency (r=-0.242, p=0.033), but not with 5-point test (r=-0.189; p=0.083). Furthermore, regression analysis showed a modest but significant effect of CHIPS on executive function when tested by TMT-B (p=0.045). Fazekas’ periventricular score (p=0.046), together with nIUD (p=0.016) and UTI (p=0.042) were significantly associated with the results of 5-point test in regression analysis.
Memory function was assessed by 5 neuropsychological tests. There were significant correlations between CHIPS and all of the tests: r=-0.265, p=0.018 for AVLT, r=-0.320, p=0.004 for ECR; r=-0.346, p=0.001 for semantic fluency; r=-0.274, p=0.021 for VRI and r=-0.298, p=0.006 for WMS-VRII. AVLT was not significantly correlated with other WML scores albeit
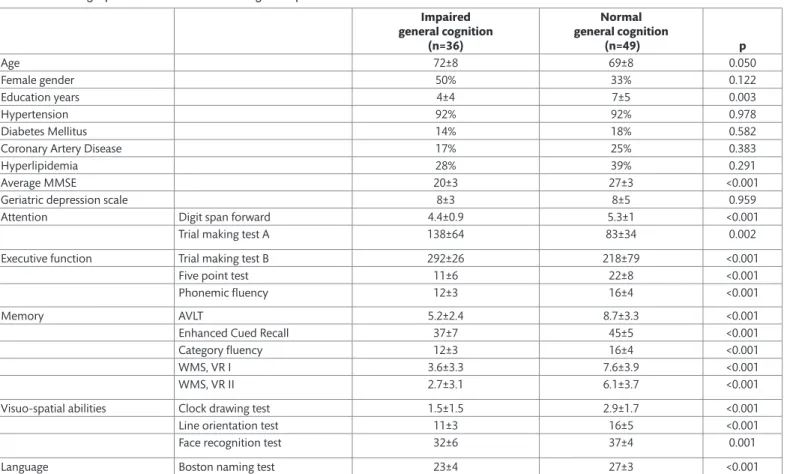
Table 1. Demographic characteristics and cognitive profile
Impaired general cognition (n=36) Normal general cognition (n=49) p Age 72±8 69±8 0.050 Female gender 50% 33% 0.122 Education years 4±4 7±5 0.003 Hypertension 92% 92% 0.978 Diabetes Mellitus 14% 18% 0.582
Coronary Artery Disease 17% 25% 0.383
Hyperlipidemia 28% 39% 0.291
Average MMSE 20±3 27±3 <0.001
Geriatric depression scale 8±3 8±5 0.959
Attention Digit span forward 4.4±0.9 5.3±1 <0.001
Trial making test A 138±64 83±34 0.002
Executive function Trial making test B 292±26 218±79 <0.001
Five point test 11±6 22±8 <0.001
Phonemic fluency 12±3 16±4 <0.001
Memory AVLT 5.2±2.4 8.7±3.3 <0.001
Enhanced Cued Recall 37±7 45±5 <0.001
Category fluency 12±3 16±4 <0.001
WMS, VR I 3.6±3.3 7.6±3.9 <0.001
WMS, VR II 2.7±3.1 6.1±3.7 <0.001
Visuo-spatial abilities Clock drawing test 1.5±1.5 2.9±1.7 <0.001
Line orientation test 11±3 16±5 <0.001
Face recognition test 32±6 37±4 0.001
Language Boston naming test 23±4 27±3 <0.001
MMSE, Mini-Mental State Examination; AVLT, Rey’s auditory verbal learning test; WMS-VR I & II: Visual reproduction subtest of Wecshler’s memory scale (immediate memory: WMS-VRI and delayed memory: VRII).
Figure 1. A, B. Summary of relationship between MRI parameters and cognitive domains.
MMSE, Mini-Mental State Examination; AVLT, Rey’s auditory verbal learning test; ECR, enhanced cued recall test; Wecshler MS-R1, Visual reproduction subtest of Wecshler’s memory scale (immediate memory); Wecshler MS R2, Visual reproduction subtest of Wecshler’s memory scale (delayed memory); ARWMC, Shelten’s or Age-Related White Matter Changes scale; CHIPS, Cholinergic Pathways HyperIntensities Scale; nIUD, normalized Inter-uncal distance; UTI, uncotemporal index; nICD: normalized Intercaudate distance; CMB, Cerebral microbleed; CHBS, Cholinergic Pathways Bleeding (Microhemorrhage) Scale.
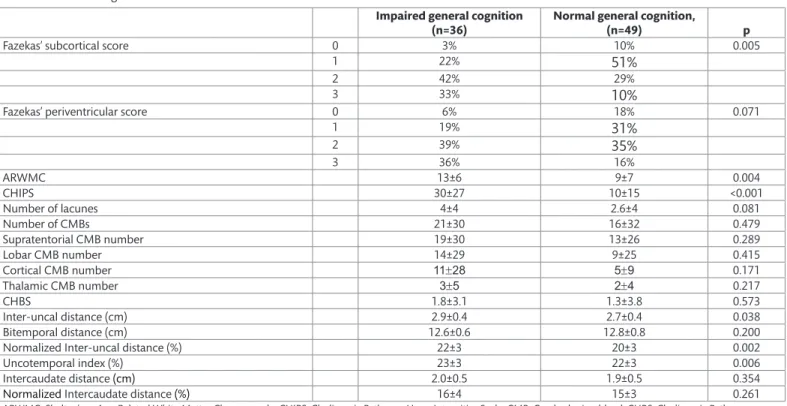
Table 2. MRI Findings
Impaired general cognition
(n=36) Normal general cognition, (n=49) p
Fazekas’ subcortical score 0 3% 10% 0.005
1 22%
51%
2 42% 29%
3 33%
10%
Fazekas’ periventricular score 0 6% 18% 0.071
1 19%
31%
2 39%35%
3 36% 16% ARWMC 13±6 9±7 0.004 CHIPS 30±27 10±15 <0.001 Number of lacunes 4±4 2.6±4 0.081 Number of CMBs 21±30 16±32 0.479 Supratentorial CMB number 19±30 13±26 0.289 Lobar CMB number 14±29 9±25 0.415 Cortical CMB number 11±28 5±9 0.171 Thalamic CMB number 3±5 2±4 0.217 CHBS 1.8±3.1 1.3±3.8 0.573 Inter-uncal distance (cm) 2.9±0.4 2.7±0.4 0.038 Bitemporal distance (cm) 12.6±0.6 12.8±0.8 0.200Normalized Inter-uncal distance (%) 22±3 20±3 0.002
Uncotemporal index (%) 23±3 22±3 0.006
Intercaudate distance (cm) 2.0±0.5 1.9±0.5 0.354
Normalized Intercaudate distance (%) 16±4 15±3 0.261
ARWMC, Shelten’s or Age-Related White Matter Changes scale; CHIPS, Cholinergic Pathways HyperIntensities Scale; CMB, Cerebral microbleed; CHBS, Cholinergic Pathways Bleeding (Microhemorrhage) Scale
a tendency was notable for lacune number (r=-0.211, p=0.06). ECR scores were correlated with Fazekas’ subcortical and periventricular scales (r=-0.221, p=0.047 and r=-0.274, p=0.013, respectively), and lacune number (r=-0.305, p=0.006). A significant correlation existed between ECR and atrophy indices (nIUD: r=-0.289, p=0.009 and UTI: r=-0.227, p=0.043). WML (r=-0.357, p=0.001 for Fazekas’ subcortical score; r=-0.292, p=0.007 for Fazekas’ periventricular score; r=-0.220, p=0.043 for lacune number) and atrophy indices (r=-0.372, p=0.001 for nIUD; r=-0.336, p=0.002 for UTI) were also correlated with semantic fluency. Semantic fluency was the only test showing a correlation with CMB number in various locations (r=-0.245, p=0.024 for total CMBs; r=-0.246, p=0.023 for supratentorial CMBs; r=-0.202, p=0.064 for lobar CMBs; r=-0.230, p=0.037 for cortical CMBs; r=-0.290, p=0.007 for thalamic CMBs). While WMS-VRI did not show any correlation with MRI parameters except for CHIPS score, WMS-VRII was correlated with both atrophy indices (r=-0.258, p=0.018 for nIUD and r=-0.251, p=0.021 for UTI) and several WML parameters (r=-0.250, p=0.021 for Fazekas’ subcortical score; r=-0.219, p=0.045 for lacune number). Regression analysis showed nIUD as an independent predictor of AVLT and ECR abnormalities (p=0.044 and p=0.031, respectively) in addition to education years. In addition to nIUD, Fazekas’ subcortical score (p=0.013) and CHIPS (p=0.044) were significantly associated with ECR. Fazekas’ periventricular score was significantly associated with poor performance on semantic fluency test in multivariate analysis (p=0.028). Of note, no significant association between CMBs and memory function was observed in regression analyses although a trend for association was noted between ECR and left cortical CMB number (p=0.060), and between WMS-VRII and cortical CMB number (p=0.053).
Visuospatial abilities were studied with 3 tests. A significant correlation was noted between clock drawing test and Fazekas’ subcortical score (r=-0.227, p=0.037), Fazekas’ periventricular score (r=-0.228, p=0.028), CHIPS (r=-0.285, p=0.008), nIUD (r=-0.261, p=0.017) and UTI (r=-0.240, p=0.028). ARWMC was the only imaging measure significantly correlated with line orientation test (r=-0.345, p=0.019), while CHIPS was the only measure significantly associated with Benton face recognition tests (r=-0.304, p=0.005). Correlation analyses did not show any significant relationship between CMB parameters and visuospatial tests. Regression analysis documented that nIUD was an independent predictor for abnormal clock drawing (p=0.029), line orientation (p=0.024), and Benton’s face recognition tests (p=0.020). UTI (p=0.040), CHIPS (p=0.025), ARWMC (p=0.038), and thalamic CMB number (p=0.006) were the other independent variables that showed a significant association with abnormal clock drawing test results.
Language was assessed with 30-item versions of the Boston naming test. BNT showed weak but significant correlation with WML (Fazekas’ subcortical score: 0.258, p=0.017; Fazekas’ periventricular score: r=-0.245, p=0.024; ARWMC: r=-0.226, p=0.037; CHIPS: r=-0.316; p=0.003; lacune number. 0.252, p=0.020), and atrophy indices (nIUD: r=-0.253, p=0.020; UTI: r=-0.201, p=0.066). Furthermore, BNT scores were correlated with thalamic 0.301, p=0.005) and cortical CMBs (r=-0.285, p=0.009), especially with the ones located in the left-hemisphere (r=-0.291, p=0.007). Regression analysis showed nIUD (p=0.011), CHIPS (p=0.044), ARWMC (p=0.022), lacune number (p=0.050), together with CMB burden (p=0.003 for cortical, p=0.001 for left-sided cortical, p=0.002 for lobar, and p=0.037 for total CMB number) as independent predictors of abnormal BNT performance.
DISCUSSION
This study showed that in an older adult population recruited from imaging center regardless of primary illness or complaint leading to hospital admission and MR acquisition but had imaging evidence of small vessel disease, MR measures of white matter hyperintensity and cortical
atrophy are more prominent in patients with objective measures of cognitive impairment. In contrary, number and location of CMB did not differ between cognitively impaired and unimpaired subjects. General cognition and individual cognitive domains including attention, executive function, memory, and visuo-spatial abilities were related to WML burden, involvement of cholinergic tracts by WMLs, and temporal lobe atrophy. This relation showed that cognitive functions are poorer in patients with higher WML burden and cortical atrophy. On the other hand, there was no association between CMB burden and global cognitive ability assessed by MMSE. We also could not find any significant association between MMSE and spatial distribution of CMBs, which was not only analyzed according to anatomic localization (such as thalamic, cortical or lobar, and right or left), but also at the network-level via CHBS, which quantifies subcortical cholinergic network involvement. Our analyses took into account potential confounders that might affect global cognitive ability including age and education level along with detailed MRI measures such as cerebral atrophy, number of lacunes, and WML burden. Similarly, no significant relationship between CMB burden and topography was observed with performances of subjects in tests assessing attention, executive function, and memory, while there was a significant association in scores of BNT, a language test which measures confrontational word retrieval, and scores of clock drawing test which measures both construction and planning abilities of visuo-spatial function and language.
A large number of studies demonstrated that WMLs are associated with mild cognitive impairment and dementia (45, 46). Some of those and other studies also showed that higher WML burden is related to cognitive decline or worse cognitive status in elderly patients regardless of diagnosis (45–47). Volumetric studies and also less sophisticated linear cerebral atrophy measures consistently revealed that cerebral and most specifically hippocampal atrophy is an independent predictor of cognitive decline in neurodegenerative diseases (36, 45). Our findings are in agreement with these studies, and further confirm it in an older adult population with asymptomatic small vessel disease.
The relation of CMBs on cognitive impairment is more inconsistent in the literature. Some studies reported a connection with global cognitive decline (17, 18, 26) or domain-specific cognitive functions such as executive function (12, 14, 15, 24–27); but the others reported lack of association of CMBs and cognitive dysfunction (11, 13, 16). A novel finding of the present study was a significant and independent association between number of cortical CMBs on the left hemisphere and BNT performance. In addition, thalamic CMB burden was related to lower semantic fluency scores in correlation analysis, but this relationship did not persist on regression analysis. On the other hand, we could not find a similar relation with phonemic fluency ability, another language related test, albeit a trend was notable for lobar and thalamic CMB burden. This discrepancy may be explained by a regional difference where those functions depend on. Semantic fluency and BNT assess semantic processing and word production, and are considered as a function of the dominant temporal lobe, while phonemic fluency is considered as a function of the frontal lobe of the dominant hemisphere (48). Considering a temporo-occipital dominant distribution of CMBs, it is plausible to expect impairment in the former 2 tests in patients with high CMB burden.
We also found a weak but significant relation between CMB burden in thalamus and clock drawing test performance. Clock drawing test is traditionally considered as a measure of visuo-spatial function, and is used to test parietal lobe function. However, other elements of mental function including planning, mental rotation, understanding, and carrying out numeric and linguistic information are required during this task. Therefore, success in this test is dependent on an intact network that spans more than one anatomic location. Indeed, previous studies have pointed out a relationship between right parietal, left frontal and
basal ganglia lesions, and impairment in this test (49). Further studies are necessary to confirm a potential role of thalamus in clock drawing test, as suggested by our findings.
The major strength of our study is the prospective and consecutive enrollment of all eligible subjects from an imaging center of a university hospital that serves patients with diverse medical illnesses, preventing the sampling bias. On the other hand, the limitation of our study is the absence of a control group that does not have CBMs. With these reservations in hand, our study showed that the relationship between CMB and cognition is topography dependent. In other words, according to our observation, cognitive effect of CMBs seems to be related to their strategic location rather than their absolute number. This observation might also explain the heterogeneity in reports focusing on the relationship between CMBs and cognition to some extent. It is clear that further studies are required to clarify the potential relevance of CMBs in cognitive function of otherwise neurologically healthy individuals. In addition, longitudinal population based studies exploring effect of CMBs on cognitive change over time would also help us understand whether CMBs have additive or synergistic effect in lowering the threshold for dementia in subjects with vascular and degenerative disorders.
Ethics Committee Approval: Hacettepe University Ethical Committee approved the study protocol.
Informed Consent: Informed consent was obtained from all subjects. Peer-review: Externally peer-reviewed.
Author Contributions: Concept - ES, MAT; Design - GB, ES, KKO, RG, EMA, MAT; Supervision - ES, KKO, MAT; Resource - GB, ES, KKO, RG, EMA, MAT; Materials - GB, ES, KKO, RG, EMA, MAT; Data Collection and/ or Processing - GB, ES, KKO, RG, EMA, MAT; Analysis and/or Interpretation - GB, ES, KKO, RG, EMA, MAT; Literature Search - GB, ES, MAT; Writing - ES, MAT; Critical Reviews - GB, ES, KKO, RG, EMA, MAT.
Conflict of Interest: No conflict of interest was declared by the authors.
Financial Disclosure: The authors declared that this study has received no financial support.
REFERENCES
1. Greenberg SM, Vernooij MW, Cordonnier C, Viswanathan A, Al-Shahi Salman R, Warach S, Launer LJ, Van Buchem MA, Breteler MM; Microbleed Study Group. Cerebral microbleeds: a guide to detection and interpretation. Lancet Neurol 2009;8:165–174. [CrossRef]
2. Fazekas F, Kleinert R, Roob G, Kleinert G, Kapeller P, Schmidt R, Hartung HP. Histopathologic analysis of foci of signal loss on gradient-echo T2*-weighted MR images in patients with spontaneous intracerebral hemorrhage: evidence of microangiopathy-related microbleeds. AJNR Am J Neuroradiol 1999;20:637–642.
3. Cordonnier C, van der Flier WM. Brain microbleeds and Alzheimer’s disease: innocent observation or key player? Brain 2011;134:335–344. [CrossRef]
4. Charidimou A, Jager HR, Werring DJ. Cerebral microbleed detection and mapping: principles, methodological aspects and rationale in vascular dementia. Exp Gerontol 2012;47:843–852. [CrossRef]
5. Cordonnier C, Al-Shahi Salman R, Wardlaw J. Spontaneous brain microbleeds: systematic review, subgroup analyses and standards for study design and reporting. Brain 2007;130:1988–2003. [CrossRef]
6. Kim BJ, Lee SH. Prognostic Impact of Cerebral Small Vessel Disease on Stroke Outcome. J Stroke 2015;17:101–110. [CrossRef]
7. de Laat KF, van den Berg HA, van Norden AG, Gons RA, Olde Rikkert MG, de Leeuw FE. Microbleeds are independently related to gait disturbances in elderly individuals with cerebral small vessel disease. Stroke 2011;42:494– 497. [CrossRef]
8. Werring DJ, Gregoire SM, Cipolotti L. Cerebral microbleeds and vascular cognitive impairment. J Neurol Sci 2010;299:131–135. [CrossRef]
9. Kim YJ, Kwon HK, Lee JM, Cho H, Kim HJ, Park HK, Jung NY, San Lee J, Lee J, Jang YK, Kim ST, Lee KH, Choe YS, Kim YJ, Na DL, Seo SW. Gray and white matter changes linking cerebral small vessel disease to gait disturbances. Neurology 2016;86:1199–1207. [CrossRef]
10. Hanyu H, Tanaka Y, Shimizu S, Takasaki M, Fujita H, Kaneko N, Yamamoto Y, Harada M. Cerebral microbleeds in Binswanger’s disease: a gradient-echo T2*-weighted magnetic resonance imaging study. Neurosci Lett 2003;340:213–216.
11. Hanyu H, Tanaka Y, Shimizu S, Takasaki M, Abe K. Cerebral microbleeds in Alzheimer’s disease. J Neurol 2003;250:1496–1497. [CrossRef]
12. Werring DJ, Frazer DW, Coward LJ, Losseff NA, Watt H, Cipolotti L, Brown MM, Jäger HR. Cognitive dysfunction in patients with cerebral microbleeds on T2*-weighted gradient-echo MRI. Brain 2004;127:2265–2275. [CrossRef]
13. Cordonnier C, van der Flier WM, Sluimer JD, Leys D, Barkhof F, Scheltens P. Prevalence and severity of microbleeds in a memory clinic setting. Neurology 2006;66:1356–1360. [CrossRef]
14. Seo SW, Hwa Lee B, Kim EJ, Chin J, Sun Cho Y, Yoon U, Na DL. Clinical significance of microbleeds in subcortical vascular dementia. Stroke 2007;38:1949–1951. [CrossRef]
15. Yakushiji Y, Nishiyama M, Yakushiji S, Hirotsu T, Uchino A, Nakajima J, Eriguchi M, Nanri Y, Hara M, Horikawa E, Kuroda Y. Brain microbleeds and global cognitive function in adults without neurological disorder. Stroke 2008;39:3323–3328. [CrossRef]
16. Pettersen JA, Sathiyamoorthy G, Gao FQ, Szilagyi G, Nadkarni NK, St George-Hyslop P, Rogaeva E, Black SE. Microbleed topography, leukoaraiosis, and cognition in probable Alzheimer disease from the Sunnybrook dementia study. Arch Neurol 2008;65:790–795. [CrossRef]
17. Viswanathan A, Gschwendtner A, Guichard JP, Buffon F, Cumurciuc R, O’Sullivan M, Holtmannspötter M, Pachai C, Bousser MG, Dichgans M, Chabriat H. Lacunar lesions are independently associated with disability and cognitive impairment in CADASIL. Neurology 2007;69:172–179. [CrossRef]
18. Takashima Y, Mori T, Hashimoto M, Kinukawa N, Uchino A, Yuzuriha T, Yao H. Clinical correlating factors and cognitive function in community-dwelling healthy subjects with cerebral microbleeds. J Stroke Cerebrovasc Dis 2011;20:105–110. [CrossRef]
19. Cordonnier C, van der Flier CM. Cerebral microbleeds and Alzheimer’s disease. In: Werring DJ, ed. Cerebral Microbleeds Pathophysiology to Clinical Practice. Cambridge: Cambridge University Press; 2011. pp. 117–124. [CrossRef]
20. Nakata Y, Shiga K, Yoshikawa K, Mizuno T, Mori S, Yamada K, Nakajima K. Subclinical brain hemorrhages in Alzheimer’s disease: evaluation by magnetic resonance T2*-weighted images. Ann N Y Acad Sci 2002;977:169– 172.
21. Lesnik Oberstein SA, van den Boom R, van Buchem MA, van Houwelingen HC, Bakker E, Vollebregt E, Ferrari MD, Breuning MH, Haan J; Dutch CADASIL Research Group. Cerebral microbleeds in CADASIL. Neurology 2001;57:1066–1070.
22. Liem MK, Lesnik Oberstein SA, Haan J, van der Neut IL, Ferrari MD, van Buchem MA, Middelkoop HA, van der Grond J. MRI correlates of cognitive decline in CADASIL: a 7-year follow-up study. Neurology 2009;72:143–148.
[CrossRef]
23. Tang WK, Chen YK, Lu JY, Wong A, Mok V, Chu WC, Ungvari GS, Wong KS. Absence of cerebral microbleeds predicts reversion of vascular ‘cognitive impairment no dementia’ in stroke. Int J Stroke 2011;6:498–505. [CrossRef]
24. Goos JD, Henneman WJ, Sluimer JD, Vrenken H, Sluimer IC, Barkhof F, Blankenstein MA, Scheltens PH, van der Flier WM. Incidence of cerebral microbleeds: a longitudinal study in a memory clinic population. Neurology 2010;74:1954–1960. [CrossRef]
25. van Es AC, van der Grond J, de Craen AJ, Westendorp RG, Bollen EL, Blauw GJ, Greenberg SM, van Buchem MA; PROSPER Study Group. Cerebral microbleeds and cognitive functioning in the PROSPER study. Neurology 2011;77:1446–1452. [CrossRef]
26. van Norden AG, van den Berg HA, de Laat KF, Gons RA, van Dijk EJ, de Leeuw FE. Frontal and temporal microbleeds are related to cognitive function: the Radboud University Nijmegen Diffusion Tensor and Magnetic Resonance Cohort (RUN DMC) Study. Stroke 2011;42:3382–3386. [CrossRef]
27. Qiu C, Cotch MF, Sigurdsson S, Jonsson PV, Jonsdottir MK, Sveinbjrnsdottir S, Eiriksdottir G, Klein R, Harris TB, van Buchem MA, Gudnason V, Launer LJ. Cerebral microbleeds, retinopathy, and dementia: the AGES-Reykjavik Study. Neurology 2010;75:2221–2228. [CrossRef]
28. Cangöz B, Karakoç E, Selekler K. İz Sürme Testi’nin 50 yaş üzeri Türk yetişkin ve yaşlı örneklemi için standardizasyon çalışması. Turkish J Geriatrics 2007;10:73–82.
29. Cangöz B, Karakoç E, Selekler K. Saat Çizme Testinin 50 yaş ve üzeri Türk yetişkin ve yaşlı örneklemi üzerinde norm belirleme ve geçerlik-güvenirlik çalışmaları. Turkish J Geriatrics 2006;9:136–142.
30. Ertan T, Eker E. Reliability, validity, and factor structure of the geriatric depression scale in Turkish elderly: are there different factor structures for different cultures? Int Psychogeriatr 2000;12:163–172.
31. Genç Açıkgöz D, Karakaş S. AVLT’nin Türk diline uyarlanmasına ilişkin bir çalışma. IX. Ulusal Psikoloji Kongresi. Ankara: Türk Psikologlar Derneği; 1996a. ss.591–596.
32. Güngen C, Ertan T, Eker E, Yaşar R, Engin F. Standardize Mini Mental Test’in Türk toplumunda hafif demans tanısında geçerlik ve güvenilirliği. Türk Psikiyatri Dergisi 2002;13:273–281.
33. Karakaş S, Eski R, Öktem-Tanör O, Bekçi B, Irak M, Kafadar H. Çizgi yönü belirleme testi (Line orientation test). In: Karakaş S, ed. Bilnot Bataryası El Kitabı: Nöropsikolojik Testler İçin Araştırma ve Geliştirme Çalışmaları. Ankara: Dizayn Ofset; 2004. ss. 269–273.
34. Keskinkılıç C. Benton yüz tanıma testinin Türkiye toplumu normal yetişkin denekler üzerindeki standardizasyonu. Turk J Neurol 2008;14:179–190. 35. Saka E, Mihci E, Topcuoglu MA, Balkan S. Enhanced cued recall has a
high utility as a screening test in the diagnosis of Alzheimer’s disease and mild cognitive impairment in Turkish people. Arch Clin Neuropsychol 2006;21:745–751. [CrossRef]
36. Saka E, Dogan EA, Topcuoglu MA, Senol U, Balkan S. Linear measures of temporal lobe atrophy on brain magnetic resonance imaging (MRI) but not visual rating of white matter changes can help discrimination of mild cognitive impairment (MCI) and Alzheimer’s disease (AD). Arch Gerontol Geriatr 2007;44:141–151. [CrossRef]
37. Saka E, Elibol B. Enhanced cued recall and clock drawing test performances differ in Parkinson’s and Alzheimer’s disease-related cognitive dysfunction. Parkinsonism Relat Disord 2009;15:688–691. [CrossRef]
38. Fazekas F, Barkhof F, Wahlund LO, Pantoni L, Erkinjuntti T, Scheltens P, Schmidt R. CT and MRI rating of white matter lesions. Cerebrovasc Dis 2002;13:31–36. [CrossRef]
39. Wahlund LO, Barkhof F, Fazekas F, Bronge L, Augustin M, Sjögren M, Wallin A, Ader H, Leys D, Pantoni L, Pasquier F, Erkinjuntti T, Scheltens P; European Task Force on Age-Related White Matter Changes. A new rating scale for age-related white matter changes applicable to MRI and CT. Stroke 2001;32:1318–1322.
40. Bocti C, Swartz RH, Gao FQ, Sahlas DJ, Behl P, Black SE. A new visual rating scale to assess strategic white matter hyperintensities within cholinergic pathways in dementia. Stroke 2005;36:2126–2131. [CrossRef]
41. Cordonnier C, Potter GM, Jackson CA, Doubal F, Keir S, Sudlow CL, Wardlaw JM, Al-Shahi Salman R. Improving interrater agreement about brain microbleeds: development of the Brain Observer MicroBleed Scale (BOMBS). Stroke 2009;40:94–99. [CrossRef]
42. Gregoire SM, Chaudhary UJ, Brown MM, Yousry TA, Kallis C, Jäger HR, Werring DJ. The Microbleed Anatomical Rating Scale (MARS): reliability of a tool to map brain microbleeds. Neurology 2009;73:1759–1766. [CrossRef]
43. Frisoni GB, Beltramello A, Weiss C, Geroldi C, Bianchetti A, Trabucchi M. Linear measures of atrophy in mild Alzheimer disease. AJNR Am J Neuroradiol 1996;17:913–923.
44. Caon C, Zvartau-Hind M, Ching W, Lisak RP, Tselis AC, Khan OA. Intercaudate nucleus ratio as a linear measure of brain atrophy in multiple sclerosis. Neurology 2003;60:323–325.
45. Bilello M, Doshi J, Nabavizadeh SA, Toledo JB, Erus G, Xie SX, Trojanowski JQ, Han X, Davatzikos C. Correlating Cognitive Decline with White Matter Lesion and Brain Atrophy Magnetic Resonance Imaging Measurements in Alzheimer’s Disease. J Alzheimers Dis 2015;48:987–994. [CrossRef]
46. Debette S, Bombois S, Bruandet A, Delbeuck X, Lepoittevin S, Delmaire C, Leys D, Pasquier F. Subcortical hyperintensities are associated with cognitive decline in patients with mild cognitive impairment. Stroke 2007;38:2924– 2930. [CrossRef]
47. Verdelho A, Madureira S, Moleiro C, Ferro JM, Santos CO, Erkinjuntti T, Pantoni L, Fazekas F, Visser M, Waldemar G, Wallin A, Hennerici M, Inzitari D; LADIS Study. White matter changes and diabetes predict cognitive decline in the elderly: the LADIS study. Neurology 2010;75:160–167. [CrossRef]
48. Price CJ. The anatomy of language: contributions from functional neuroimaging. J Anat 2000;197:335–359.
49. Tranel D, Rudrauf D, Vianna EP, Damasio H. Does the Clock Drawing Test have focal neuroanatomical correlates? Neuropsychology 2008;22:553–562.