Fe Promoted NO
xStorage Materials: Structural Properties and NO
xUptake
Emine Kayhan,†,‡Stanislava M. Andonova,†,‡Go¨ksu S. S¸entu¨rk,† Charles C. Chusuei,§and Emrah Ozensoy*,†,|
Chemistry Department, Bilkent UniVersity, 06800 Bilkent, Ankara, Turkey, Chemistry Department, Missouri UniVersity of Science & Technology, 400 West 11th Street, Rolla, Missouri 65409-0010, and Institute of Material Science and Nanotechnology, 06800, Bilkent, Ankara, Turkey
ReceiVed: August 18, 2009; ReVised Manuscript ReceiVed: NoVember 8, 2009
Fe promoted NOx storage materials were synthesized in the form of FeOx/BaO/Al2O3ternary oxides with
varying BaO (8 and 20 wt %) and Fe (5 and 10 wt %) contents. Synthesized NOx storage materials were investigated via TEM, EELS, BET, FTIR, TPD, XRD, XPS, and Raman spectroscopy, and the results were compared with the conventional BaO/Al2O3NOxstorage system. Our results suggest that the introduction of Fe in the BaO/Al2O3system leads to the formation of additional NOxstorage sites which store NOxmostly in the form of bidentate nitrates. NO2adsorption experiments at 323 K via FTIR indicate that, particularly in
the early stages of the NOxuptake, the NOxstorage mechanism is significantly altered in the presence of Fe sites where a set of new surface nitrosyl and nitrite groups were detected on the Fe sites and the surface oxidation of nitrites to nitrates is significantly hindered with respect to the BaO/Al2O3system. Evidence for
the existence of both Fe3+as well as reduced Fe2+/(3-x)+sites on the freshly pretreated materials was detected
via EELS, FTIR, Raman, and XRD experiments. The influence of the Fe sites on the structural properties of the synthesized materials was also studied by performing ex situ annealing protocols within 323-1273 K followed by XRD and Raman experiments where the temperature dependent changes in the morphology and the composition of the surface domains were analyzed in detail. On the basis of the TPD data, it was found that the relative stability of the stored NOxspecies is influenced by the morphology of the Ba and Fe containing NOx-storage domains. The relative stabilities of the investigated NOxspecies were found to increase in the following order: N2O3/NO
+< nitrates on γ-Al
2O3< surface nitrates on BaO < bidentate nitrates on FeOx sites < bulk nitrates on BaO.
1. Introduction
Over the past several years, the global environmental protec-tion efforts resulted in a stringent emission legislaprotec-tion regarding NOx, CO, and hydrocarbon emissions originating from stationary
as well as mobile sources.1In recent years, the transportation sector and in particular the diesel-equipped vehicles have become one of the primary sources for NOx emissions.
Therefore, regulations limiting NOxemissions in industrialized
countries have become very stringent. According to the Euro-pean Union regulations (EURO VI),2by the end of 2014, diesel passenger cars will be subject to a 3-fold decrease in NOx
emissions from 0.25 to 0.08 g km-1.
In the early 1990s, NOxstorage-reduction (NSR) technology,
was developed by the Toyota Motor Corporation3,4 for NO
x
removal from lean-burn gasoline engines. The operational principle is based on the alternating cycles of lean (abundant in oxygen) and rich (abundant in reductants such as unburned hydrocarbons, H2 and CO) regimes.5,6 Numerous detailed experimental and theoretical studies4,7-10investigated some of the fundamental chemical aspects related to the NOx
storage-reduction mechanism occurring on the surface of Pt/BaO/γ-Al2O3NSR catalysts. Recently, detailed surface science studies on the NOx storage capacity and the thermal aging of model
NOxstorage materials in the form of BaO/θ-Al2O3/NiAl(100)11-13
have also been reported. The spectroscopic characterization of the alumina support14 and its interactions with H2O,14NO2,15 and H2O + NO216in the absence of the active Ba-containing phase were studied as well. More recently, a similar surface science approach was also extended to the BaO/θ-Al2O3/ NiAl(110) model system.17,18
Numerous studies19-21 were directed toward the design of NSR catalysts with long-term durability, high activity, and improved sulfur tolerance by incorporation of additional oxides such as TiO2or Fe2O3to the catalytic Pt/BaO/γ-Al2O3system. For instance, in one of our recent reports,22the nature of the Ti-Ba interactions on the Ba/Ti/Al NOxstorage systems has
been thoroughly investigated where it was found that the presence of TiO2 has a considerable effect on the surface distribution of the NOxstorage domains and the thermal stability
of the stored nitrates on the surface. These results22indicated that TiO2domains present a significant affinity toward BaO and/ or Ba(NO3)2, resulting in a strong Ti-Ba interaction and the formation of overlapping surface domains.
Several studies23-25were performed in the literature in order to understand the influence of iron or iron oxides on the sulfur tolerance of NSR catalysts. It was reported that the addition of Fe improves the long-term stability of the catalysts by assisting the formation of sulfur resistant nitrate species in the Ba/Fe/γ-Al2O3system. In separate studies,26,27it was pointed out that the Fe component on the aged Pt/Ba/Fe/γ-Al2O3catalyst played two important roles: (i) suppressing the growth of sulfate deposit on the catalyst and, thereby, (ii) lowering the desorption temperature of the sulfate domains by inhibiting the BaSO4
* Corresponding author. E-mail: [email protected].
†Bilkent University.
‡These authors contributed equally to this work. §Missouri University of Science & Technology. |Institute of Material Science and Nanotechnology.
10.1021/jp907982q 2010 American Chemical Society Published on Web 12/11/2009
particle size growth. However, in these studies, minor attention has been devoted to the questions regarding the influence of Fe domains on the NOxstorage behavior, structure, and morphology
of the NOxadsorption sites on the Fe/BaO/γ-Al2O3systems.
Thus, a fundamental insight regarding the NOx storage
properties can be obtained by systematically investigating the nature of the NOxspecies formed on the surface of the Fe/BaO/ γ-Al2O3mixed oxide system as a function of the Fe and Ba loadings. In order to achieve this goal, in the current study, we provide a detailed spectroscopic and microscopic account of the structure of the Fe/BaO/γ-Al2O3system and focus on the NOx uptake mechanism at low temperature (323 K) in
com-parison with the conventional BaO/γ-Al2O3system. Besides, the thermal behavior of the adsorbed NOxspecies on the Fe/
BaO/γ-Al2O3system along with the surface morphologies of the Fe and Ba surface domains were also investigated via the temperature programmed desorption (TPD) technique.
2. Experimental Section
2.1. Sample Preparation. A series of BaO/γ-Al2O3and BaO/ FeOx/γ-Al2O3samples with different Ba (8 and 20 wt % BaO)
and Fe (5 and 10 wt % Fe) loadings were synthesized by conventional incipient wetness impregnation of γ-Al2O3 (PURAL-OX, 206 m2/g, SASOL GmbH, Germany). In this synthetic protocol, the support material was impregnated with aqueous solutions of barium nitrate (ACS Reagent, g99%, Riedel - de Ha¨en, Germany) (for BaO/γ-Al2O3samples). The mixed FeOx/
BaO/γ-Al2O3(8 or 20 wt % BaO and 5 or 10 wt % Fe) samples were prepared by simultaneous impregnation of γ-Al2O3with the aqueous solutions of barium and ferric nitrates (Fe(NO3)3· 9H2O, g98%, Sigma Aldrich). Then, the synthesized materials were dried at 353 K and calcined in Ar atmosphere for 2 h at various temperatures, ranging from 423 to 1273 K. Hence, after each temperature treatment, representative samples from the treated batches were collected for ex situ analysis. For the FTIR and TPD studies, samples synthesized via impregna-tion were directly annealed in Ar at 873 K for 2 h before their introduction to the catalytic reactor for the NO2(g) adsorption experiments.
Compositions of the NOxstorage materials and their acronyms
used in the current text are as follows: 8Ba/Al and 20Ba/Al samples contained 8 and 20 wt % BaO, respectively (with balancing amounts of Al2O3). FeOx/BaO/Al2O3samples were
synthesized in such a manner that they have BaO to Al2O3mass ratios that are identical to the BaO/Al2O3samples. Thus, 5Fe/ 8(20)Ba/Al samples contained 5 wt % Fe, 7.6 wt % (19 wt %) BaO, and balancing amounts of Al2O3, while 10Fe/8(20)Ba/Al samples contained 10 wt % Fe, 7.2 wt % (18 wt %) BaO, and balancing amounts of Al2O3. Fe/Al samples were also prepared for supporting experiments, in which γ-Al2O3was impregnated with Fe(NO3)3· 9H2O where the Fe content was 5 and 10 wt % for the 5Fe/Al and 10Fe/Al samples, respectively.
2.2. Experimental Methods. BET specific surface area
measurements were performed using a Micromeritics Tristar 3000 surface area and pore size analyzer by low-temperature isothermal adsorption-desorption of N2. Before the surface area measurements, the samples were outgassed at 623 K for 2 h in a vacuum. The transmission electron microscopy (TEM) specimens were prepared by suspending the finely ground sample particles in ethanol and dispersing this suspension on a lacey-type carbon film coated copper TEM grid. TEM measure-ments were carried out in bright field mode using an FEI Tecnai G2 F30 microscope with a specified point resolution of 0.17 nm, a Gatan slow-scan CCD camera, and a Gatan serial
energy-loss spectrometer. The operating voltage of the microscope was 300 keV during the TEM imaging. Elemental analysis of the imaged samples was performed by acquiring the electron energy loss spectra (EELS) with an incident electron energy of 100 kV. The typical duration of the EELS spectral acquisition was 15-20 s.
The powder X-ray diffraction (XRD) patterns were recorded using a Rigaku diffractometer, equipped with a Miniflex goniometer and an X-ray source with Cu KR radiation, at λ ) 1.5418 A, 30 kV, and 15 mA. The powder samples were scanned in the 10-80° 2θ range with a scan rate of 0.01° s-1. Diffraction patterns were assigned using Joint Committee on Powder Diffraction Standards (JCPDS) cards supplied by the International Centre for Diffraction Database (ICDD). X-ray photoelectron spectroscopy (XPS) was acquired using a Perkin-Elmer PHI560 ESCA equipped with a Mg KR anode operated at 250 W and 15 kV. Binding energies were charge referenced at C 1s ) 284.7 eV to denote adventitious carbon.
Raman spectra were recorded on a HORIBA Jobin Yvon LabRam HR 800 instrument, equipped with a confocal Raman BX41 microscope, a spectrograph with an 800 mm focal length, and a CCD detector. The Raman spectrometer was equipped with a Nd:YAG laser (λ ) 532.1 nm). During the Raman experiments, the laser power was tuned to 20 mW, in order to minimize the sample heating effects. Before the Raman measurements, the powder samples were mechanically dispersed onto a single-crystal Si holder. The spectrometer was regularly calibrated by adjusting the zero-order position of the grating and comparing the measured Si Raman band frequency with the typical reference value of 520.7 cm-1. All Raman spectra were acquired within 100-4000 cm-1with an acquisition time of 213 s and a spectral resolution of 4 cm-1. Bulk Ba(NO3)2, Fe(NO3)3· 9H2O, and Fe2O3nanopowder (Sigma-Aldrich, part no. 544884-5G) samples were used for the reference Raman spectra.
Fourier transform infrared (FTIR) spectroscopic measure-ments were carried out in transmission mode in a batch-type catalytic reactor coupled to an FTIR spectrometer (Bruker Tensor 27) and a quadruple mass spectrometer (QMS) (Stanford Research Systems, RGA 200) for temperature programmed desorption (TPD) and residual gas analysis (RGA). FTIR spectra were recorded using a Hg-Cd-Te (MCT) detector, where each spectrum was acquired by averaging 128 scans with a spectral resolution of 4 cm-1. The samples were mounted into the IR cell28consisting of a five-way stainless steel chamber equipped with optically polished KBr windows. This IR cell was connected to a gas manifold (including a dual-stage rotary vane pump and two turbomolecular pumps) so that the pressure in the cell could be varied within 1000-10-6Torr. About 20 mg of finely ground powder sample was pressed onto a high-transmittance, lithographically etched fine-tungsten grid which was mounted on a copper sample holder assembly, attached to a ceramic vacuum feedthrough. A K-type thermocouple was spot-welded to the surface of a thin tantalum plate attached on the W-grid to monitor the sample temperature. The sample temperature was controlled within 298-1100 K via a computer-controlled DC resistive heating system using the voltage feedback from the thermocouple. After having mounted the sample in the IR cell, the sample was gradually heated to 373 K in vacuum and kept at that temperature for at least 12 h before the experiments in order to ensure the removal of water from the surface. In an attempt to minimize the effect of background water (i.e., readsorption of water on the sample from the reactor walls and the gas manifold), the system was frequently baked.
Prior to each NOx adsorption experiment, the walls of the
vacuum system were passivated by flushing 2 Torr of NO2(g) for an extended period of time (20 min) followed by evacuation at the same temperature. Next, in order to obtain a surface that is free of adsorbed NOxand other adsorbates, the sample was
annealed in vacuum by increasing the temperature to 1023 K in a linear fashion at a constant rate of 12 K min-1. After this annealing protocol, the sample was cooled down to 323 K. Before acquisition of each spectral series, a background spectrum of the clean, adsorbate-free sample was obtained in a vacuum at 323 K (with a residual reactor pressure of ∼1 × 10⁻⁵Torr).
NO2(g) (prepared by reacting NO(g), Air Products, Purity >99.9% and O2(g) Ersoy Gas, Purity >99.9%) used in the adsorption experiments was further purified Via several freeze-thaw-pump cycles before the experiments. NO2(g) adsorption experiments were performed Via two subsequent NOx
uptake protocols. In the first protocol, precisely controlled doses of 0.6 Torr of NO2(g) (measured by a 1000 Torr MKS Baratron absolute pressure transducer) were introduced in a stepwise fashion onto the NOx-free sample surface at 323 K. After having
the acquired sample spectrum of each dose at 323 K, the system was evacuated to∼1 × 10⁻³Torr before the next dosage. This protocol allowed us to follow the FTIR spectral changes during the gradual NO2(g) adsorption on the samples at 323 K. In the second NOxuptake protocol, subsequent to the gradual
(step-wise) NO2doses, the sample was exposed to 8 Torr of NO2(g) for 20 min at 323 K in order to ensure the complete saturation of the sample surface with NOx and the FTIR spectra were
acquired after having evacuated the reactor to∼1 × 10⁻³Torr at 323 K.
TPD experiments were performed by using a QMS that is directly connected to the vacuum chamber through a pneumatic gate valve. Before the TPD experiments, the sample powder (mass ) ca. 20 mg) pressed onto a tungsten grid was mounted in the IR/TPD cell and pretreated using the identical procedure
described above. After cooling to 323 K, the sample was exposed to 8 Torr of NO2for 20 min until the equilibrium was reached. Next, the system was outgassed to∼1 × 10⁻⁶Torr in order to remove weakly physisorbed molecules. Subsequently, TPD experiments were carried out. Evolved NOxspecies during
the desorption process were monitored by recording the QMS signals with mass to charge ratios (m/z) equal to 18, 28, 30, 32, 44, and 46 in pressure vs time mode. A linear temperature ramp within 323-1023 K was used during the TPD experiments where the ramp rate was 12 K/min. In order to ensure the reproducibility of the results, TPD experiments were performed multiple times for each sample.
3. Results and Discussion
3.1. BET Surface Area Measurements. BET surface area
measurements of the synthesized materials are given in Table 1. All of these samples were initially annealed in Ar(g) for 2 h at 873 K before the measurements. BET results suggest that the specific surface area values monotonically decrease with the increasing Ba and Fe loadings. This expected decrease in surface area values with respect to the bare γ-Al2O3support material is due to the blocking of the porous alumina surface with low-surface-area Fe and/or Ba oxide domains as well as due to the solid state reactions described in sections 3.3 and 3.4.
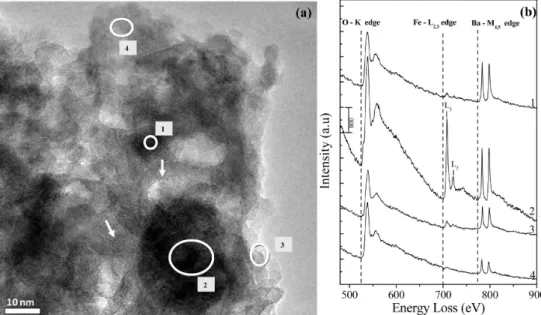
3.2. TEM and EELS Measurements. Parts a and b of
Figure 1 present TEM and EELS data for a 10Fe/20Ba/Al sample that is initially annealed in Ar(g) for 2 h at 873 K, respectively. The morphology of the 10Fe/20Ba/Al system presents complex and poorly defined features that are similar to the γ-Al2O3(data not shown) and BaO/γ-Al2O3systems.29 In addition to these, more ordered domains with well-defined orientations (indicated by the arrows in Figure 1a) are also clearly discernible which can be attributed to the presence of Fe and/or Ba-containing oxide domains exhibiting larger crys-tallites with a more ordered character than that of γ-Al2O3. Figure 1. Representative TEM image (a) of a 10Fe/20Ba/Al sample that is initially thermally treated at 873 K for 2 h in Ar(g). EELS data (b) for
a set of randomly selected points on the image are also given. Arrows emphasize the relatively ordered domains on the surface.
TABLE 1: BET Specific Surface Area Measurement Results for the Investigated Materials
samplea,b γ-Al
2O3 8Ba/Al 20Ba/Al 5Fe/8Ba/Al 10Fe/8Ba/Al 5Fe/20Ba/Al 10Fe/20Ba/Al
205 185 126 163 160 125 109
aAll of the samples were initially annealed at 873 K in Ar(g) for 2 h before the BET measurements.bSurface area values are given in m2/g.
Elemental analysis of the imaged samples was also performed via EELS measurements. EELS spectra obtained from different locations of the image presented in Figure 1b reveal that the surface concentrations of the Fe and Ba containing domains are not homogeneous. Further information regarding the d-electron occupancy of the Fe sites can also be obtained by analyzing the relative integrated peak areas of the FeL3and FeL2 white line peaks in the EELS data. It is well-known in the literature that the FeL3/FeL2integrated area ratio can provide insight regarding the oxidation state of the Fe centers.30FeL3/ FeL2integrated area ratio values obtained from the EELS data presented in Figure 1b vary between 3.9 and 6.5 that is consisted with the presence of Fe2O3, Fe3O4, and possibly FeOxdomains.
In other words, the oxidation states of the Fe centers on the surface of the 10Fe/20Ba/Al sample can exist in a variety of values such as Fe3+, Fe2+, and Fe(3-x)+.
3.3. XRD Experiments. Ex situ X-ray diffraction studies
were also performed after thermally treating the synthesized
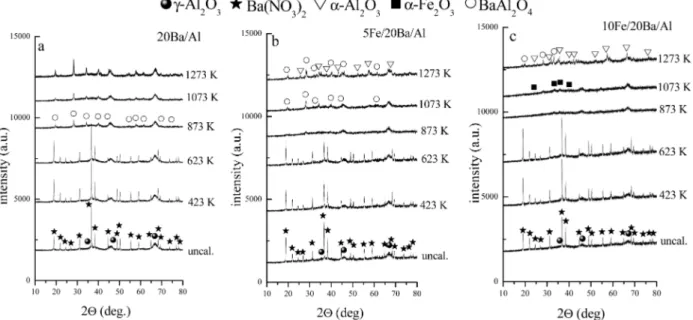
materials at various temperatures ranging from 323 to 1273 K. Figure 2 presents XRD results corresponding to 8Ba/Al, 5Fe/ 8Ba/Al, and 10Fe/8Ba/Al samples with lower Ba content, whereas Figure 3 presents XRD data for the 20Ba/Al, 5Fe/20Ba/ Al, and 10Fe/20Ba/Al samples with a higher Ba loading.
XRD patterns of all of the uncalcined samples in Figure 2 present diffraction maxima that can be assigned to γ-Al2O3 (JCPDS 29-0063, marked with filled circles) and crystalline Ba(NO3)2(JCPDS 24-0053, marked with stars). It should be pointed out that the Ba(NO3)2-related reflections in the XRD profiles of the 5Fe/8Ba/Al and 10Fe/8Ba/Al samples are characterized with relatively sharper features with higher intensities in comparison with that of the 8Ba/Al sample. This observation is also consistent with our TEM results given in section 3.2, indicating the presence of crystallographically ordered domains on the surface. Heat treatment at 423 and 623 K does not result in any significant changes in the XRD profiles. A further increase in the annealing temperature to 873 K, leads Figure 2. XRD profiles corresponding to the as-prepared and thermally treated (423-1273 K) (a) 8Ba/Al, (b) 5Fe/8Ba/Al, and (c) 10Fe/8Ba/Al
samples (see text for details).
Figure 3. XRD profiles corresponding to the as-prepared and thermally treated (423-1273 K) (a) 20Ba/Al, (b) 5Fe/20Ba/Al, and (c) 10Fe/20Ba/
to the complete disappearance of the diffraction maxima due to the Ba(NO3)2 for all samples. It can be seen in Figure 2a that only very broad diffraction features associated with the
γ-alumina support are visible in the XRD profiles of the 8Ba/
Al sample calcined in the range 873-1273 K. However, at higher calcination temperatures such as 1273 K, both in the 5Fe/8Ba/Al and 10Fe/8Ba/Al samples, γ-Al2O3support material starts to undergo a phase transformation toward the R-Al2O3 (corundum) phase (marked with open triangles in Figure 2b and c) (similarly, such a phase transition was observed for the 5Fe/ Al and 10Fe/Al samples that do not contain any Ba domains, as shown in Figure 1 of the Supporting Information). It should be noted that such a phase transformation takes place at T> 1273 K on the pure alumina surface. Former studies in the literature suggest that the presence of small R-Fe2O3(hematite) particles leads to a decrease in the γ-Al2O3f R-Al2O3phase transformation temperature.31It is also noteworthy to mention that diffraction features belonging to R-Fe2O3(hematite) (JCPDS 72-0469) become visible at T> 1073 K for the 10Fe/8Ba/Al sample, indicating the formation of larger hematite crystallites with increasing Fe loading. In addition to these, very minor features associated with the BaAl2O4phase (JCPDS 17-0306) (marked with open circles) are also visible in Figure 2b for the 5Fe/8Ba/Al sample at 1273 K. These results regarding the BaAl2O4formation at elevated temperatures are also in good agreement with our XPS results that are provided in the Supporting Information (Figure 2).
In accordance with the higher Ba loading, XRD patterns given in Figure 3 have sharper and more intense Ba(NO3)2features within 323-873 K where the Ba(NO3)2decomposes into BaO at 873 K for all samples. Another common characteristic of the XRD patterns in Figure 3 is the more visible BaAl2O4features appearing at temperatures as low as 873 K (e.g., 20Ba/Al case in Figure 3a) that are consistent with the higher Ba loading.7,10 In addition, comparison of Figure 3c to Figure 3a and b reveals that increasing Fe content in the Fe/Ba/Al system suppresses the BaAl2O4 formation at higher temperatures, suggesting a stronger interaction between the Fe domains and the underlying Al2O3 support material for the higher Fe loadings. These complex thermal changes occurring on the Ba/Al and Fe/Ba/ Al systems particularly at T g 873 K leading to the formation of BaAl2O4, Fe2O3, and R-Al2O3are consistent with the smaller specific surface areas of the Ba/Al and Fe/Ba/Al systems in comparison with the γ-Al2O3support material (section 3.1).
3.4. Raman Spectroscopy Experiments. In order to obtain
further structural information regarding the synthesized materi-als, Raman spectroscopic experiments were performed after thermally treating the samples at various temperatures within 323-1273 K. The spectra (i-iii) in Figure 4a also present reference Raman data for unsupported (pure) Ba(NO3)2, Fe(NO3)3· 9H2O, and R-Fe2O3(hematite), respectively. Similarly, Figure 4b and c shows Raman spectroscopic results for the 5Fe/ 8Ba/al and 10Fe/8Ba/Al samples, while Figure 5 shows corre-sponding results for the 5Fe/20Ba/Al and 10Fe/20Ba/Al samples with a higher Ba loading.
The Raman spectra given in Figures 4 and 5 reveal similar dominant features at T e 623 K. These dominant Raman features can be assigned to the relevant surface species with the help of the former reports in the literature32-34as well as the supporting experiments given in Figures 3 and 4 of the Supporting Information. The spectra in Figures 4 and 5 at T e 623 K are dominated by the strong Raman bands associated with the symmetric (1052 cm-1), antisymmetric stretching (∼1357 and 1406 cm-1,) and bending modes (740 cm-1) of the
NO3-ions which bear significant resemblance to the reference Ba nitrate and Fe nitrate spectra given in Figure 4a (spectra i and ii). Furthermore, the lattice phonon band at 143 cm-1which clearly indicates the presence of crystalline Ba(NO3)2is also present in all of the samples in Figures 4 and 5 at T e 623 K. Furthermore, the weak band at ∼1640 cm-1 can be readily assigned to the longitudinal optical (LO) mode and the group of weak bands at about 1360 and 1410 cm-1to the transverse optical (TO) modes of the antisymmetric nitrate stretch, respectively.32-34In addition, a low frequency band at 552 and a weak shoulder at∼433 cm-1corresponding to the symmetric A1g(Fe-OH)2stretching mode of Fe(H2O)63+ion can also be observed34in Figures 4 and 5 which reveal the coordination of the Fe centers to the surface hydroxyls or water molecules after the impregnation procedure. Observations given above point to Figure 4. Ex situ Raman spectra corresponding to pure reference
materials (a) i, Ba(NO3)2; ii, Fe(NO3)3· 9H2O; iii, R-Fe2O3and to the
as-prepared and thermally treated (423-1273 K) (b) 5Fe/8Ba/Al and (c) 10Fe/8Ba/Al samples.
the fact that Fe(NO3)3and Ba(NO3)2domains coexist on the Fe/Ba/Al samples at low temperatures which yield similar nitrate-related overlapping bands in the Raman spectra.
The samples analyzed after calcining at 623 K in Figures 4 and 5 are still dominated by the strong nitrate features; however, they also unveil an important aspect, the R-Fe2O3 (hematite) formation. Hematite formation at 623 K is evident in the 5Fe/ 8Ba/Al and 5Fe/20Ba/Al samples (Figures 4b and 5a) as weak shoulders at ca. 300 and 1320 cm-1. They are more clearly discernible in the samples with higher Fe content such as the 10Fe/8Ba/Al and 10Fe/20Ba/Al samples (Figures 4c and 5b), as a result of the stronger bands at∼225, 295, 411, 618, and 1328 cm-1. Thus, it is apparent that the decomposition of the deposited ferric nitrates on the surface results in the formation of R-Fe2O3in the Fe/Ba/Al system. Ba(NO3)2decomposition also occurs in a similar thermal window (i.e., 623-873 K) where Ba(NO3)2decomposes to form (BaO)x. Barium oxide crystallizes
in the rock salt structure, and the first order Raman scattering is symmetry forbidden32,33 However, broad and weak bands within 350-500 cm-1due to the lattice modes of the defective BaO domains can still be visible via Raman spectroscopy (see for instance, Figure 3 in the Supporting Information). However, due to the stronger and complex Fe2O3-related features in this spectral window, these weaker BaO lattice features are signifi-cantly obscured in Figures 4 and 5.
Raman spectra of the Fe/Ba/Al systems annealed at T g 1073 K in Figures 4 and 5 are almost exclusively dominated by the Fe2O3features regardless of the relative composition of the Fe/ Ba/Al structure. The crystalline R-Fe2O3(hematite) belongs to the D6
3d crystal space group, which exhibits the following Raman features:35,36seven phonon lines (two A1gmodes at 232 and 506 cm-1 and five Egmodes at 252, 293, 299, 417, and 618 cm-1) and a magnon scattering feature at ∼1323 cm-1. Furthermore, a number of additional minor bands at 820, 952, 1060, and 1111 cm-1 which are also characteristic of the hematite structure36 can also be seen in the spectra. The increased band intensities corresponding to the hematite domains at higher temperatures may suggest enrichment in the surface concentration of R-Fe2O3 species, ordering of the hematite crystal structure, as well as an increase in the R-Fe2O3particle size (i.e., sintering). Raman spectra of all Fe containing oxide materials corresponding to 1273 K also reveal a readily distinguishable band at 663 cm-1. According to the former Raman spectroscopy studies in the literature on various iron oxides,35,36 the Raman spectrum of Fe3O4 (magnetite) is characterized by strongly expressed bands located at 663 cm-1 and weaker bands at 302, 514, and 534 cm-1. Thus, it is apparent that, within 623-1273 K, the Raman spectra of the Fe/Ba/Al samples given in Figures 4 and 5 consist of combinations of bands related to the simultaneous presence of R-Fe2O3(hematite) and Fe3O4(magnetite). It should also be noted that the presence of minority iron oxide domains with dissimilar stoichiometries to the ones discussed above cannot be ruled out, as these structures may be elusive to detect via ex situ Raman spectros-copy and XRD techniques.
3.5. Low-Temperature NOxUptake of the Fe/Ba/Al
Sys-tem: FTIR Spectroscopy Experiments. After having acquired
a detailed understanding of the structural properties of the Fe/ Ba/Al NOxstorage systems, the low-temperature NOxstorage
behavior of these materials was analyzed via FTIR spectroscopy. NO2adsorption experiments were performed on the Fe/Ba/A1 systems, as described in the Experimental Section. NOxuptake
results of the Fe/Ba/Al systems with a lower (8 wt %) Ba loading are presented in section 3.5.1, while the results for the samples with a higher Ba loading (20 wt % Ba) are given in section 3.5.2.
3.5.1. Stepwise NO2(g) Adsorption on 8Ba/Al, 5Fe/8Ba/Al,
and 10Fe/8Ba/Al at 323 K. Figure 6 presents FTIR data for
NO2(g) adsorption on 8Ba/Al, 5Fe/8Ba/Al, and 10Fe/8Ba/10Al samples. NO2adsorption on the BaO/γ-Al2O3system has been thoroughly studied in the literature via FTIR spectroscopy37-40 where the nature of the adsorbed NOx species was mostly
interpreted by considering the BaO adsorption sites that belong to different morphologies on the support (γ-Al2O3) surface. Along these lines, it was suggested that there exists two major types of BaO adsorption sites relevant to NO2adsorption, the so-called “surface” and “bulk” BaO sites. The surface BaO sites were suggested to exist in the form of a (BaO)xstructure where
well-dispersed BaO monomers, dimers, or other small oligomers directly interact with the underlying alumina support sites in a very strong fashion.37 It was further suggested that this well-dispersed surface (BaO)xspecies prefers to anchor particularly
on the (100) facets of the γ-Al2O3 surface which constitutes about 16% of the total surface area of the γ-Al2O3structure.42 In addition, these (100) facets showing high affinity toward BaO monomers and dimers, were proposed to expose exclusively penta-coordinated Al3+ sites on the surface.37-42The second major type of BaO adsorption sites relevant to the NO2 adsorption is the so-called “bulk” BaO sites, which were Figure 5. Ex situ Raman spectra corresponding to the as-prepared
and thermally treated (423-1273 K) (a) 5Fe/20Ba/Al and (b) 10Fe/ 20Ba/Al samples.
suggested to be in the form of three-dimensional BaO clusters on the alumina surface which are capable of not only adsorbing NOxon the BaO cluster surface but also capable of storing NOx
in the bulk of the BaO cluster.37
Along these lines, the FTIR data corresponding to the NO2 adsorption on the 8Ba/Al sample in Figure 6a can be readily analyzed in the light of the detailed former studies in the literature.37-42During the initial NO2doses (the spectra marked with red in Figure 6a), the FTIR data is mostly dominated by a feature at 1225 cm-1 which can be attributed to nitrites on the BaO sites. Concomitant with the formation of nitrites, further NO2doses lead to the oxidation of the surface nitrite species into nitrates. This is evident by the appearance of additional vibrational bands at 1585, 1565, and∼1300 cm-1that can be attributed to bidentate (surface) nitrates. Furthermore, the shoulder at 1320 cm-1and the doublet with a characteristic splitting of the asymmetric stretching vibration bands at 1442 cm-1can be assigned to the bulk nitrates. Symmetric vibrational modes (υsym) of the nitrate groups mentioned above also reveal themselves as weak features at 1030 and 1041 cm-1. In addition to these, a broad vibrational feature at∼1985 cm-1is also visible which can be attributed39to the weakly adsorbed N2O3or NO+ on the surface. Figure 6a shows that, upon increasing NO2doses at 323 K, most of the NOx species on the 8Ba/Al surface are
oxidized to form surface and bulk nitrates while some of the nitrate species are adsorbed on the exposed γ-Al2O3support material in the form of bidentate and/or bridging nitrates, indicated by the observed shoulders at 1630 and 1256 cm-1. It is well-known in the literature37,38that, at relatively low loadings of Ba such as 8 wt %, the NOxstorage component is not able
to cover the support surface completely, leaving bare support sites available for NOxadsorption.
Using the 8Ba/Al system as a benchmark, NO2adsorption experiments on the 5Fe/8Ba/Al and 10Fe/8Ba/Al systems presented in Figure 6b-e can be elucidated in detail. It is apparent that the initial NO2uptake of the 5Fe/8Ba/Al and 10Fe/ 8Ba/Al systems at 323 K shows significant discrepancies with that of the 8Ba/Al system. First of all, although surface oxidation of nitrite species to form nitrates on the 8Ba/Al system readily occurs after the first few initial NO2doses, on the 5Fe/8Ba/Al and 10Fe/8Ba/Al surfaces, nitrate formation is not visible in these initial doses and becomes visible only after dosing a large number of NO2 pulses (note that the pressures and exposure durations used in the NO2pulses were identical for all doses and for all surfaces). This suggests that the presence of Fe sites significantly alters the oxidation of NOxspecies on the surface
by hindering the transformation of nitrites into nitrates. The structures of the nitrite bands are also relatively more complex Figure 6. FTIR spectra corresponding to the stepwise NO2adsorption at 323 K on the (a) 8Ba/Al, (b, c) 5Fe/8Ba/Al, and (d, e) 10Fe/8BaAl
samples. The spectra corresponding to the fully saturated sample surfaces are marked with an “S” (see text for details). Red lines emphasize the early stages of the NOxuptake.
in the Fe-containing systems (Figure 6c and e), as an additional nitrite band exists at 1189 cm-1, signifying the existence of at least one more type of nitrite species that does not exist in the case of the 8Ba/Al (Figure 6a).
Another important difference in the initial NOx uptake
behavior of the 5Fe/8Ba/Al and 10Fe/8Ba/Al systems reveals itself in the spectral region located within 1700-2000 cm-1. It is visible in Figure 6b and d that NO2adsorption on the Fe-containing systems leads to a new feature around 1800-1860 cm-1. This additional feature is visible even after the very first NO2pulse and increases its intensity for a certain period, with a slight shift to higher frequencies. After reaching a maximum intensity at 1821-1833 cm-1, the intensity of this new band starts to attenuate with a further blue shift in frequency. Concomitant with this intensity attenuation, a significant growth in the intensity of the nitrate bands (1250-1620 cm-1) as well as the broad N2O3/NO+ band (1950 cm-1) is observed. A vibrational feature within 1800-1860 cm-1was also observed in a former study where NO adsorption was performed on both oxidized and reduced hematite particles supported on SiO2.43 On the basis of these former results, the new feature given in Figure 6b and d can be readily assigned to various types of nitrosyls on reduced Fe centers (i.e., Fe2+and/or Fe(3-x)+). It should be noted that the presence of reduced Fe centers as a result of the initial thermal activation and the cleaning protocol (described in the Experimental Section) before the introduction of NO2(g) into the FTIR cell is also supported by the ex situ characterization results given in sections 3.1-3.4. Thus, it is apparent that, immediately after the very first NO2dose, NO2 species preferentially adsorb on the highly reactive coordina-tively unsaturated (and reduced) Fe2+/Fe(3-x)+ centers,43 and decompose on these centers, leaving an oxygen atom which can further oxidize the neighboring reduced iron sites. Consequently, during the first few NO2doses at 323 K, it is likely that most of the NOxspecies are converted into nitrosyls on the Fe centers
while the remaining NOxspecies exist exclusively in the form
of nitrites that are located on both BaO and FeOxdomains. The
presence of an additional nitrite feature at 1189 cm-1(Figure 6c and e) in the Fe/Ba/Al systems is also consistent with the fact that this additional nitrite species is likely located on the Fe centers.
Therefore, the NOxcoverage-dependent changes within the
1800-1860 cm-1region can be described by considering the formation of dinitrosyl species (1810 cm-1) on the reduced Fe2+/ Fe(3-x)+centers with a lower (4-fold) coordination43 followed by a transformation into mononitrosyl (1830 cm-1) species located on the high-coordination (6-fold) Fe2+/Fe(3-x)+centers at higher NOx coverages. After the complete oxidation of the
reduced Fe sites and the healing of the oxygen defects on the surface, oxidation of the surface NOx species starts to occur
with the further NO2(g) pulses. This leads to the formation of the stable nitrates (1250-1620 cm-1) as well as the weakly bound N2O3/NO+species (1950 cm-1). It should be mentioned that the nitrosyl groups on Fe3+sites are relatively unstable at 323 K which is in very good agreement43with the attenuation of the nitrosyl intensity after the completion of the oxidation of the reduced Fe centers on the surface. It is also worth mentioning that similar low-temperature NO2adsorption experi-ments performed on the 5Fe/Al and 10Fe/Al systems (data not shown) which do not possess any Ba domains also reveal a similar initial NOxuptake behavior to the 5Fe/8Ba/Al and 10Fe/
8Ba/Al systems, while such a hindrance regarding the nitrite oxidation or the generation of the surface nitrosyls was not detected during the NO2adsorption on the pure γ-Al2O3support
material (data not shown). These control experiments also support the fact that the dissimilar initial NOx uptake of the
Fe/Ba/Al systems is directly linked to the Fe-containing domains.
Later stages of the NOxuptake of the 5Fe/8Ba/Al and 10Fe/
8Ba/Al systems (Figure 6c and e) show also significant dissimilarities with respect to the 8Ba/Al system (Figure 6a). After the saturation of the 5Fe/8Ba/Al and 10Fe/8Ba/Al surfaces with NO2(spectra labeled with the letter “S” in Figure 6c and e), the relative intensities of the nitrate bands present a different profile than the 8Ba/Al system. Overall, the presence of Fe leads to an increase in the bidentate nitrate bands that are located at 1300, 1585, and 1565 cm-1. Detailed analysis of the thermal behavior of these species followed by the TPD technique described in section 3.7 suggests that these bidentate nitrate species are associated with the Fe3+ sites on the Fe2O3 (hematite), Fe3O4(magnetite), and FeOxdomains in addition to
the regular surface nitrates on the Ba domains. Therefore, it is apparent that the promotion of the conventional Ba/Al system with Fe oxides leads to the creation of new NOxstorage sites
that can store NOxin the form of bidentate nitrates. The influence
of the Fe loading on the Fe/Ba/Al systems with relatively low Ba content (i.e., 8 wt % BaO) during the low-temperature NOx
uptake can also be investigated by comparing parts b and c of Figure 6 with parts d and e. Such a comparison clearly indicates that increasing the Fe loading to 10 wt % decreases the relative intensities of the Fe-nitrosyls (1800-1860 cm-1) during the initial uptake. In a similar fashion, the intensities of the bidentate nitrate species formed after the saturation of the surface with NO2(g) are also lower in Figure 6d and e with respect to Figure 6b and c. These observations point to the fact that the NOx
uptake capability of the Fe domains diminishes with increasing Fe loading. This can be attributed to the slightly lower specific surface area of the 10Fe/8Ba/Al sample (section 3.1), as well as the increase in the crystallite size of the Fe domains with increasing Fe content (sections 3.3-3.4) and the Fe-induced structural changes in the BaO units and the γ-Al2O3support material (section 3.3).
3.5.2. Stepwise NO2(g) Adsorption on 20Ba/Al, 5Fe/20Ba/
Al, and 10Fe/20Ba/Al at 323 K. Figure 7 shows the stepwise
NO2adsorption on 20Ba/Al, 5Fe/20Ba/Al, and 10Fe/20Ba/Al samples at 323 K. Comparison of the low-temperature NO2(g) uptake of the 20Ba/Al sample with the 8Ba/Al sample reveals that the IR intensity ratio of the bulk nitrates to surface nitrates is greater for the 20Ba/Al case, suggesting that Ba domains in the 20Ba/Al case contain larger 3D clusters that prefer to store NO2as bulk nitrates.37-42The presence of more significantly expressed bulk nitrates is also apparent in the 5Fe/20Ba/Al and 10Fe/20Ba/Al systems (Figure 7c and e) especially when compared to the 5Fe/8Ba/Al and 10Fe/8Ba/Al cases (Figure 6c and e). Initial NOx uptake characteristics of the 5Fe/20Ba/Al
system show significant resemblance to the 5Fe/8Ba/Al and 10Fe/8Ba/Al cases, suggesting that the initial oxidation of the reduced Fe centers and the nitrite formation are followed by the oxidation of the surface NOxspecies to nitrates. The
Fe-induced hindrance of the nitrite f nitrate transformation is slightly less visible in the 5Fe/20Ba/Al case with respect to the 5Fe/8Ba/Al case, which may be attributed to the partial covering of the Fe sites by Ba in the 5Fe/20Ba/Al system.
A significant deviation in the NOx uptake behavior as well
as in the nature of the adsorbed nitrate species is observed particularly in the case of the 10Fe/20Ba/Al system. It is clearly seen in Figure 7d and e that, during the initial NO2doses on the 10Fe/20Ba/Al surface, oxidation of the nitrites to form
nitrates starts almost simultaneously with the formation of the nitrite species. Furthermore, nitrosyl, nitrite, and bidentate nitrate formation on the Fe domains are significantly suppressed on the 10Fe/20Ba/Al surface, whereas the formation of bulk nitrates on the Ba domains is greatly enhanced. In a parallel fashion, increasing abundances of Fe and Ba in the composition of the Fe/Ba/Al systems also decrease the fraction of the exposed
γ-Al2O3 support material evident by the attenuation of the shoulders at 1630 and 1256 cm-1 in Figure 7e. All of these indicators point to the fact that the morphology of the NOx
storage domains is profoundly altered in the case of the 10Fe/ 20Ba/Al system where Fe domains agglomerate to form large crystallites with a lower surface area that are less accessible to NO2adsorption (consistent with our BET measurements for this surface), possibly accompanied by covering of the Fe domains with the bulk Ba domains. A more comprehensive account of the morphological changes occurring on the different NOx
storage units will be discussed in sections 3.7 and 3.8 below.
3.6. Regeneration of the Reduced Fe Sites in the Fe/Ba/ Al NOx Storage System. An important aspect that was also investigated in our studies regarding the presence of the additional NOxstorage sites that are associated with the reduced
Fe sites was whether these reduced sites could be regenerated in a reducing environment, after an oxidative treatment. The
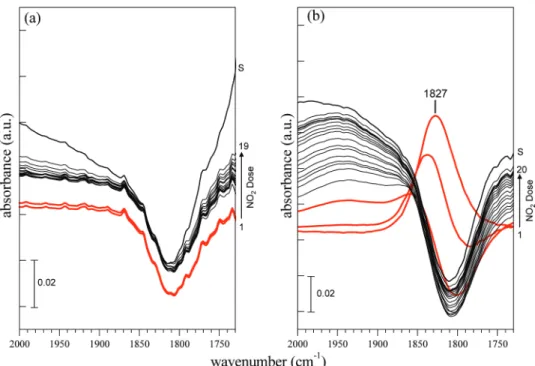
significance of this aspect can be realized particularly when the alternating oxidizing (i.e., lean)7 and reducing (i.e., rich)7 operational regimes in the NSR catalytic process are considered. Therefore, a series of simple (proof of principle) experiments were performed whose results are presented in Figure 8. In these experiments, a freshly activated 5Fe/8Ba/Al sample (preannealed in a vacuum at 1023 K) was exposed to 10 Torr of O2for 20 min at 623 K. Then, the NOxuptake of the preoxidized surface
was followed during the NO2adsorption at 323 K via FTIR (Figure 8a). It is clearly seen in Figure 8a that the nitrosyl features that are associated with the presence of the reduced Fe sites are not visible for the preoxidized surface (Figure 8a). Furthermore, as expected from the oxidized surface, the nitrate region of the spectra reveals a simultaneous increase in the nitrite and nitrate bands without a visible hindrance in the surface oxidation of the NOx species during the initial stages of the
NOxuptake. The preoxidized surface, which was saturated with
NOx, was subsequently exposed to a reducing environment. This
was achieved by annealing the sample in a vacuum first at 1023 K (for 2 min) and then at 923 K (for 30 min). After this reduction protocol, NO2adsorption on this surface was per-formed at 323 K (Figure 8b). Figure 8b reveals the reappearance of the nitrosyl features during the initial stages of the NOxuptake
(which are converted into other NOx species during the later
Figure 7. FTIR spectra corresponding to the stepwise NO2adsorption at 323 K on the (a) 20Ba/Al, (b, c) 5Fe/20Ba/Al, and (d, e) 10Fe/20BaAl
samples. The spectra corresponding to the fully saturated sample surfaces are marked with an “S” (see text for details). Red lines emphasize the early stages of the NOxuptake.
stages of the NOx adsorption, as described in the previous
sections), indicating the regeneration of the reduced Fe centers after the reduction protocol. It should be noted that the intensities of the nitrosyl features in Figure 8b are slightly less than that of the freshly activated 5Fe/8Ba/Al surface (Figure 6b), implying a partial regeneration of the reduced Fe sites. It is worth mentioning that, under the realistic operational conditions of an NSR catalyst, powerful gas phase reducers (such as hydrocarbons, CO, and hydrogen) are present in the rich regime. Furthermore, these reducing agents can be readily activated on a real NSR catalyst particularly on the surface of the precious metal (e.g., Pt) particles serving as redox centers. Thus, although the actual operational temperature of the NSR process (ca. 523-623 K) is lower than the reduction temperature used above, it is plausible that the regeneration of the Fe centers under real operational conditions could also occur during the rich cycle due to the presence of strong gas phase reducing agents as well as the Pt redox centers on the NSR catalyst surface.
3.7. Thermal Behavior of the Adsorbed NOxSpecies on
the 8Ba/Al, 5Fe/8Ba/Al, and 10Fe/8Ba/Al Systems via TPD.
In order to elucidate the thermal behavior and the relative surface stabilities of the different types of NOxspecies that are stored
on the Fe/Ba/Al systems, FTIR (Supporting Information, Figures 5 and 6) and TPD experiments were performed.
Figure 9 shows TPD data obtained from the γ-Al2O3, 8Ba/ Al, 5Fe/8Ba/Al, and 10Fe/8Ba/Al surfaces that are initially pretreated and subsequently saturated with NO2(g), as described in the Experimental Section. The bottom-most TPD profiles given in Figure 9 correspond to the γ-Al2O3support material. TPD experiments upon NO2adsorption on the γ-Al2O3system have been thoroughly discussed in various former reports.40,44 In the light of these studies, it can be readily argued that TPD profiles for the γ-Al2O3support material contain a low tem-perature feature at 389 K corresponding to the desorption of weakly bound N2O3and NO+species, that desorb in the form of NO2 and NO + O2. The main desorption feature of the
γ-Al2O3support material appears at 625 K which corresponds
to desorption/decomposition of bridging and bidentate nitrates yielding predominantly a NO2desorption signal.40,44
TPD profiles for the 8Ba/Al sample in Figure 9 indicated similar thermal decomposition of the weakly adsorbed species and the nitrates formed on the Al3+NO
xadsorption centers.38,40
The low-temperature desorption signal located at 389 K can be attributed to the N2O3and NO+species as in the case of the
γ-Al2O3 surface, although the intensity of this feature is relatively smaller for the 8Ba/Al case due to the partial blocking of the γ-Al2O3surface by the BaO domains. The shoulder at ca. 625 K can also be readily associated with desorption and decomposition of the nitrates that reside on the exposed sites of the γ-Al2O3support material. The major desorption feature for the 8Ba/Al system at 685 K can be assigned to the decomposition of the surface (bidentate) nitrates associated with the BaO monomers/dimers strongly interacting with the support material. As discussed above, surface nitrates are relatively less stable than the bulk nitrates, which appear as a shoulder within 750-900 K.38,40It is also worth mentioning that Figure 9 shows that surface nitrate decomposition yields mostly NO2species while bulk nitrate decomposition leads to mostly NO + O2.
Using the TPD data for the γ-Al2O3and the 8Ba/Al given in Figure 9 as a basis, TPD results of the 5Fe/8Ba/Al system can be analyzed in detail. TPD data for the 5Fe/8Ba/Al surface in Figure 9 is dominated by a new distinct feature that is located at 760 K. It should be noted that the thermal characteristics of this dominant feature cannot be explained by solely using the TPD results for the γ-Al2O3 and/or 8Ba/Al systems. This observation suggests that the new desorption feature at 760 K is associated with a new species that is present on the 5Fe/8Ba/ Al surface and absent on the γ-Al2O3 and 8Ba/Al surfaces. Considering the FTIR results for the 5Fe/8Ba/Al surface given in Figure 6b indicating a significant accentuation of the bidentate nitrate species, it seems plausible to assign the desorption feature at 760 K to the desorption/decomposition of the bidentate nitrates associated with the Fe-containing domains. It is worth mentioning that this feature has similar desorption characteristics Figure 8. FTIR spectra corresponding to the stepwise NO2adsorption at 323 K on the preoxidized (a) 5Fe/8Ba/Al sample surface with 10 Torr
of O2for 20 min at 623 K and on the subsequently reduced (b) sample by annealing in a vacuum first at 1023 K (for 2 min) and then at 923 K (for
30 min). The spectra corresponding to the fully saturated sample surfaces are marked with an “S” (see text for details). Red lines emphasize the early stages of the NOxuptake.
(i.e., desorbing mostly in the form of NO2) to the surface nitrates on the well-dispersed BaO units that are strongly interacting with the alumina support surface. In addition to this major signal at 760 K, desorption features associated with the weakly bound N2O3and NO+species (389 K), nitrates on the γ-Al2O3support surface (625 K), and surface (bidentate) Ba nitrates (685 K) are also visible as convoluted features on the low-temperature tail of the desorption trace of the 5Fe/8Ba/Al system, while the minor feature associated with the bulk Ba nitrate desorption (750-900 K) mostly appears in a heavily convoluted form, on the asymmetric high-temperature tail of the TPD trace. When these TPD results are assessed in conjunction with the FTIR results presented in Figure 6c, it can be argued that the activated 5Fe/8Ba/Al surface contains well-dispersed BaO and Fe2O3/ Fe3O4/FeOx domains which are readily accessible for NOx
adsorption. This is also consistent with the significant suppres-sion of the major TPD feature that belongs to the nitrates on the exposed alumina surface (625 K). Therefore, it is apparent that nitrates located on the Fe and Ba domains have different thermal stabilities where the nitrates stored on the additional Fe domains are more stable than the surface nitrates on the well-dispersed BaO units by ca. 80 K.
Along these lines, the TPD profile for the 10Fe/8Ba/Al surface can also be analyzed in detail. The FTIR results for the NO2 adsorption on the 10Fe/8Ba/Al surface given above (Figure 6e) as well as the structural characterization data point to the fact that the Fe-containing domains on the 10Fe/8Ba/Al surface exist as relatively large crystallites which have a relatively limited access to NO2(g). This observation is in very good agreement with the corresponding TPD results given in the topmost desorption profiles in Figure 9. In Figure 9a, it is clearly seen that the desorption feature at 760 K corresponding to the bidentate nitrates on the Fe domains is significantly suppressed while the intense desorption features associated with the surface nitrates on the BaO units (685 K) as well as the signal related to the nitrates on the bare alumina support surface (625 K) are noticeably visible. Thus, an overall interpretation of these observations implies that, on the 10Fe/8Ba/Al sample, Fe domains agglomerate on the surface to form large crystallites with a low surface to volume ratio. These crystallites are
relatively inaccessible for NO2adsorption and leave a significant number of available adsorption sites on the surface Ba nitrate sites and on the bare Al2O3support surface. The presence of a large number of available adsorption sites on the Al2O3support surface in the 10Fe/8Ba/Al system is also consistent with the large TPD signal at 625 K in the topmost TPD profile in Figure 9a, in addition to the comparable surface areas of the 10Fe/ 8Ba/Al and 5Fe/8Ba/Al systems.
3.8. Thermal Behavior of the Adsorbed NOxSpecies on
the 20Ba/Al, 5Fe/20Ba/Al, and 10Fe/20Ba/Al Systems via TPD. Figure 10 summarizes the TPD data obtained after the
saturation of the γ-alumina, 20Ba/Al, 5Fe/20Ba/Al, and 10Fe/ 20Ba/Al surfaces with NO2(g) at 323 K. The TPD profile corresponding to the 20Ba/Al sample is dominated by an intense, high-temperature desorption feature at 907 K, which can be attributed to the desorption of the bulk nitrates from the Ba domains. Furthermore, this bulk nitrate feature desorbs mostly in the form of NO + O2.38,40In addition to this dominant feature, the asymmetric low-temperature tail can be attributed to a convolution of the signals originating from the surface nitrates on Ba domains (650-780 K), nitrates on the alumina support (600-650 K), and weakly bound N2O3/NO+ species (ca. 389 K).
The TPD profiles given in Figure 10 regarding the 5Fe/20Ba/ Al surface present noteworthy differences when compared to the 20Ba/Al case. It is apparent that the addition of 5 wt % Fe to the 20Ba/Al system results in a significant thermal destabi-lization of the adsorbed NOxspecies. Considering the lack of a
very significant amount of accessible Fe domains available for NO2 adsorption in Figure 7c, it can be argued that the morphology of the 5Fe/20Ba/Al surface is such that most of the bulk Ba domains are located on the top of the well-dispersed Fe domains where the access of the Fe domains to NO2(g) is partially blocked by the Ba sites. Thermal destabilization of the bulk nitrates on the Ba domains can also be attributed to the loss of the strong interaction between the bulk Ba nitrates with the underlying Al2O3support material which is replaced by a weaker interaction between the Fe domains that are located below the bulk Ba clusters. Therefore, the desorption feature at 760 K for the 5Fe/20Ba/Al TPD profile can be mostly assigned Figure 9. TPD profiles obtained from pure γ-Al2O3, 8Ba/Al, 5Fe/8Ba/Al, and 10Fe/8Ba/Al samples which were initially saturated with NO2(g) at
323 K: (a) 30 and 32 amu signals; (b) 46 amu signal.
to destabilized bulk Ba units that are on the top of the Fe domains (with a minor contribution from NOxdesorption due
to Fe domains). This assignment is also consistent with the observation that the 760 K feature desorbs predominantly in the form NO + O2, as expected from the bulk Ba nitrates. Along these lines, the lower-temperature features within 600-700 K can be associated with the surface nitrates on BaO monomers/ dimers as well as the nitrates located on the bare alumina surface. These latter assignments are in harmony with the desorption characteristics of the surface Ba nitrates and the nitrates located on the bare alumina surface which yield mostly NO2during their thermal desorption/decomposition.
The morphology-related arguments mentioned above can also be extended to explain the TPD results for the 10Fe/20Ba/Al
system, given in the topmost spectra of Figure 10. The TPD trace for the 10Fe/20Ba/Al system shows a strong resemblance to the 20Ba/Al surface particularly in terms of its line shape. However, in the case of the 10Fe/20Ba/Al system, the major desorption feature is located at a lower temperature (870 K) with respect to that of the 20Ba/Al system (907 K). Considering the FTIR results for the 10Fe/20Ba/Al system, it can be argued that almost none of the Fe sites are available for NO2adsorption during neither early nor later stages of the NOxuptake. These results can be explained
by envisioning a surface morphology which is composed of mostly large and isolated Ba or Fe clusters. This explanation is also in good agreement with the results in sections 3.4 and 3.5.2 given above. Thus, the low surface to volume ratio of the large Fe clusters may render the Fe sites to be less accessible for NO2adsorption. Figure 10. TPD profiles obtained from pure γ-Al2O3, 20Ba/Al, 5Fe/20Ba/Al, and 10Fe/20Ba/Al samples which were initially saturated with
NO2(g) at 323 K: (a) 30 and 32 amu signals; (b) 46 amu signal. SCHEME 1
In addition, the slight thermal destabilization of the bulk Ba nitrates may also be due to the fact that some of the bulk Ba clusters are located on the large Fe2O3/Fe3O4/FeOx crystallites, effectively
blocking the access of the Fe domains to NO2(g). Finally, it is worth mentioning that the desorption characteristics of the TPD features located at 870 and 780 K are also in good accordance with the suggested assignments, as the 870 K feature mostly desorbs in the form of NO + O2(consistent with the bulk Ba nitrates), whereas the shoulder within the 600-780 K feature desorbs mostly in the form of NO2that is in line with the surface Ba nitrates (with minor contributions from Fe nitrates and nitrates on Al2O3).
3.9. A General View of the Surface Morphology of Different NOxStorage Domains on the Fe/Ba/Al System. The composi-tion-dependent changes in the morphology of the various NOx
storage components present on the Fe/Ba/Al system that are investigated in the current text are summarized in Scheme 1.
4. Conclusions
The structure and low-temperature NOx uptake properties of
FeOx/BaO/Al2O3materials having different Fe and Ba loadings
were investigated via a variety of spectroscopic, imaging, and diffraction techniques. Our results can be summarized as follows: (a) The presence of Fe centers significantly alters the NOx
uptake mechanism at 323 K. Fe domains provide additional NOx
adsorption sites in the Fe/Ba/Al system where the adsorbed NOx
species are ultimately stored as bidentate nitrates.
(b) Freshly prepared and activated Fe/Ba/Al samples exhibit Fe2+/(3-x)+/3+centers whose relative abundances vary with the Fe and Ba loadings. In addition, reduced Fe centers hinder the oxidation of the adsorbed nitrites into nitrates until the complete oxidation of the reduced Fe centers into Fe3+. Besides, these reduced Fe sites were found to be partially regenerating under alternating oxidation/reduction treatments.
(c) Fe domains on the Fe/Ba/Al systems were found to exist in the form of Fe2O3, Fe3O4, and FeOxwhose surface
morphol-ogy and the accessibility to gas phase NOx are significantly
dictated by the composition of the Fe/Ba/Al system.
(d) The decrease in the NOx storage capacity of the Fe
domains was attributed to the agglomeration of the Fe domains leading to a relatively poor Fe dispersion and/or blocking of the Fe sites by Ba domains, hindering the accessibility of the Fe domains toward gas phase NOxadsorption.
(e) On the basis of the TPD data, the relative stabilities of the stored NOxspecies can be ranked in terms of increasing stability
as N2O3/NO+< nitrates on γ-Al2O3< surface nitrates on BaO < bidentate nitrates on FeOxsites< bulk nitrates on BaO.
Acknowledgment. The authors gratefully acknowledge the
support from the Scientific and Technical Research Council of Turkey (TUBITAK) (Project Codes: 105Y260 and 107Y115) and the University of Missouri Research Board (RBJ61). We also thank Ja´nos Szanyi and Ja Hun Kwak (Pacific Northwest National Laboratory) for fruitful discussions. This work was also partially supported by the European Union FP7 project called UNAM-REGPOT (Contract No.: 203953).
Supporting Information Available: Figures showing XRD
profiles, XPS measurements, ex situ Raman spectra, and temperature-dependent FTIR spectra. This material is available free of charge via the Internet at http://pubs.acs.org.
References and Notes
(1) Pischinger, S. Top. Catal. 2004, 30/31, 5.
(2) “Emission Control Technologies and the Euro 5/6 Emission Legislation”, AECC, http://www.aecc.be/en/Publications/Publications.html. (3) Toyota Patent, European Patent Application no. 0573 672A1(1992). (4) Takahashi, N.; Shinjoh, H.; Iijima, T.; Suzuki, T.; Yamazaki, K.; Yokota, K.; Suzuki, H.; Miyoshi, N.; Matsumoto, S.; Tanizawa, T.; Tanaka, T.; Tateishi, S.; Kasahara, K. Catal. Today 1996, 27, 63.
(5) Olsson, L.; Fridell, E. J. Catal. 2002, 210, 340. (6) Olsson, L.; Andersson, B. Top. Catal. 2004, 28, 89.
(7) Epling, W. S.; Campbell, L. E.; Yezerets, A.; Currier, N. W.; Parks, J. E., II. Catal. ReV. 2004, 46, 163.
(8) Nova, I.; Castoldi, L.; Lietti, L.; Tronconi, E.; Forzatti, P. Catal.
Today 2002, 75, 431.
(9) Fridell, E.; Persson, H.; Westerberg, B.; Olsson, L.; Skoglundh, M. Catal. Lett. 2000, 66, 71.
(10) Roy, S.; Baiker, A. Chem. ReV. 2009, 109, 4054.
(11) Ozensoy, E.; Peden, C. H. F.; Szanyi, J. J. Catal. 2006, 243, 149. (12) Ozensoy, E.; Szanyi, J.; Peden, C. H. F. J. Phys. Chem. B 2006,
110, 17001.
(13) Ozensoy, E.; Szanyi, J.; Peden, C. H. F. J. Phys. Chem. B 2006,
110, 17009.
(14) Ozensoy, E.; Szanyi, J.; Peden, C. H. F. J. Phys. Chem. B 2005,
109, 3431.
(15) Ozensoy, E.; Peden, C. H. F.; Szanyi, J. J. Phys. Chem. B 2005,
109, 15977.
(16) Ozensoy, E.; Peden, C. H. F.; Szanyi, J. J. Phys. Chem. B 2006,
110, 8025.
(17) Desikusumastuti, A.; Staudt, T.; Gro¨nbeck, H.; Libuda, J. J. Catal.
2008, 255, 127.
(18) Staudt, T.; Desikusumastuti, A.; Happel, M.; Vesselli, E.; Baraldi, A.; Gardonio, S.; Lizzit, S.; Rohr, F.; Libuda, J. J. Phys. Chem. C 2008,
112, 9835.
(19) Rohr, F.; Peter, S. D.; Lox, E.; Ko¨gel, M.; Sassi, A.; Juste, L.; Rigaudeau, C.; Belot, G.; Ge´lin, P.; Primet, M. Appl. Catal., B 2005, 56, 201.
(20) Stakheev, A.Yu.; Gabrielsson, P.; Gekas, I.; Teleguina, N. S.; Bragina, G. O.; Tolkachev, N. N.; Baeva, G. N. Top. Catal. 2007, 42/43, 143.
(21) Corbos, E. C.; Elbouazzaoui, S.; Courtois, X.; Bion, N.; Marecot, P.; Duprez, D. Top. Catal. 2007, 42/43, 9.
(22) Andonova, S. M.; Senturk, G. S.; Kayhan, E.; Ozensoy, E. J. Phys.
Chem. C 2009, 113, 11014.
(23) Fanson, P. T.; Horton, M. R.; Delgass, W. N.; Lauterbach, J. Appl.
Catal., B 2003, 46, 393.
(24) Hendershot, R. J.; Fanson, P. T.; Snively, C. M.; Lauterbach, J.
Angew. Chem., Int. Ed. 2003, 42, 1152.
(25) Hendershot, R. J.; Vijay, R.; Snively, C. M.; Lauterbach, J. Appl.
Catal., B 2007, 70, 160.
(26) Yamazaki, K.; Suzuki, T.; Takahashi, N.; Yokota, K.; Sugiura, M.
Appl. Catal., B 2001, 30, 459.
(27) Luo, J.-Y.; Meng, M.; Zha, Yu.-Q.; Xie, Ya-N.; Hu, T.-D.; Zhang, J.; Liu, T. Appl. Catal., B 2008, 78, 38.
(28) Basu, P.; Ballinger, T. H.; Yates, J. T., Jr. ReV. Sci. Instrum. 1988, 59, 1321.
(29) Szanyi, J.; Kwak, J.-H.; Hanson, J.; Wang, Ch.; Szailer, T.; Peden, C. H. F. J. Phys. Chem. B 2005, 109, 7339.
(30) Wang, Ch.; Baer, D. R.; Amonette, J. E.; Engelhard, M. H.; Antony, J.; Qiang, Y. J. Am. Chem. Soc. 2009, 131, 8824.
(31) Sto¨βer, R.; Nofz, M.; Feist, M.; Scholz, G. J. Solid State Chem.
2006, 179, 652.
(32) Mestl, G.; Rosynek, M. P.; Lunsford, J. H. J. Phys. Chem. B 1997,
101, 9321.
(33) Hess, Ch.; Lunsford, J. H. J. Phys. Chem. B 2003, 107, 1982. (34) Sharma, S. K. J. Chem. Phys. 1974, 61, 1748.
(35) de Faria, D. L. A.; Silva, S. V.; de Oliveria, M. T. J. Raman
Spectrosc. 1997, 28, 873.
(36) Shebanova, O. N.; Lazor, P. J. Solid State Chem. 2003, 174, 424. (37) Kwak, J. H.; Mei, D.; Yi, Ch.-W.; Kim, D. H.; Peden, C. H. F.; Allard, F. J. Catal. 2009, 261, 17.
(38) Szanyi, J.; Kwak, J. H.; Kim, D. H.; Burton, S. D.; Peden, C. H. F.
J. Phys. Chem. B 2005, 109, 27.
(39) Venkov, T.; Hadjiivanov, K.; Klissurski, D. Phys. Chem. Chem.
Phys. 2002, 4, 2443.
(40) Szanyi, J.; Kwak, J. H.; Chimentao, R. J.; Peden, Ch. H. F. J. Phys.
Chem. C 2007, 111, 2661.
(41) Digne, M.; Sautet, P.; Raybaud, P.; Euzen, P.; Toulhoat, H. J. Catal.
2004, 226, 54.
(42) Kwak, J. H.; Hu, J. Z.; Kim, D. H.; Szanyi, J.; Peden, C. H. F. J.
Catal. 2007, 251, 189.
(43) Yuen, S.; Chen, Y.; Kubsh, J. E.; Dumeslc, J. A.; Topsøe, N.; Topsøe, H. J. Phys. Chem. 1982, 86, 3022.
(44) Ozensoy, E.; Herling, D.; Szanyi, J. Catal. Today 2008, 136, 46. JP907982Q