MONITORING THE REHABILITATION
PROGRESS USING A DCNN AND KINEMATIC
DATA FOR DIGITAL HEALTHCARE
Javier Conte Alcaraz
∗, Sanam Moghaddamnia
†, Maxim Penner
∗and J¨urgen Peissig
∗ ∗Institute of Communications Technology †Department of Electrical Engineering∗Leibniz Universit¨at Hannover †T¨urkisch-Deutsche Universit¨at
{conte,penner,peissig}@ikt.uni-hannover.de [email protected]
Abstract—Monitoring the progress of patients during the re-habilitation process after an operation is beneficial for adjusting care and medical treatment in order to improve the patient’s quality of life. The supervised methods used for this in the literature need data labeling, which is a time and cost-intensive procedure. In this paper, we propose Deep Convolutional Neural Network (DCNN) for monitoring the progress of the rehabilita-tion, utilizing the kinematic data from a Wearable Sensor System (WSS). The WSS provides three-dimensional linear acceleration and angular velocity from multiple body parts such as the lower back and lower limbs during walking at any speed on level ground. Twelve patients with hip unilateral arthroplasty completed two weeks of gait training after the operation. The classification results of different Inertial Measurement Unit (IMU) placements revealed that the IMU placed at thigh achieved the highest accuracy. The proposed DCNN achieved up to 98% classification accuracy for the rehabilitation progress monitoring. This approach provides an objective and evidence-based way of understanding clinically important changes in human movement patterns in response to exercise therapy.
Index Terms—CNN, Gait Rehabilitation, Progress Monitoring, IMU, Machine Learning, Digital Healthcare and Therapy Control
I. INTRODUCTION
Portable Wearable Sensors (WSs) are attracting increasing interest in the healthcare sector for health monitoring and con-trol, disease forecasting, prevention and individualised thera-peutic applications [1]–[3]. Among them, Inertial Measure-ment Units (IMUs) are of particular interest due to their user-friendly characteristics and offer a broad application spectrum with promising impact on patient care [4]–[7]. The application of Machine Learning (ML) methods to large data volumes recorded by wearable devices opens up new possibilities for diagnosis, prognosis and clinical decision making in a variety of disorders [8], [9]. IMUs are capable of measuring multiparameters, such as 3D linear acceleration, 3D angular velocity and 3D magnetic field. They enable a wide range of locomotor activities to be captured [10], [11].
One particular challenge in this regard is the long-term multidimensional data recordings that quickly become large, complex and clinically uninterpretable. Another challenge is to process, extract and convert the relevant information on normal and pathological gait behaviour into effective and affordable
interventions. Many studies have been yet conducted in the area of activity and gait phase classification. The authors in [12] performed manual feature extraction from 3D accelerome-ter signals from the wrist to classify different daily activities of elderly people. In [13], force resistive sensors and IMUs were applied for Parkinson’s Disease (PD) gait phase classification. The feasibility of the IMU for gait analysis and assessment based on hand-crafted features from kinematics data has been demonstrated in previous studies [14]. However, a vast amount of data recorded by the wearable sensors remains unprocessed, although it may hold key information to answer open questions on patient care [15]. Therefore, there is a great need to develop high-performance data processing and presenting methods.
One of the most promising methods for remote patient monitoring are ML and WSs, which do not only provide the possibility to measure the kinetic symptoms automatically, but also enable caregivers to follow up the progress of rehabilita-tion and the quality of intervenrehabilita-tions more frequently than the current clinical practices [16], [17]. The study performed in [11] addresses the classification of abnormal movements detec-tion in PD using a Denoising Autoencoder (DAE). The authors in [18] applied a Convolutional Neural Network (CNN) to extract gait parameters, e.g. cadence, step time, velocity, from kinematic data avoiding the manual extraction of gait parameters. However, to the best of the authors knowledge, no studies have examined the IMUs placement with different kinematic data in patients with hip unilateral arthroplasty operation in multiple WS applications. Thus, this study aimed to conduct a comprehensive analysis of the placement of multiple wearable sensors, the effect of different kinematic signals and the application of deep convolutional networks for the progress monitoring in rehabilitation.
The paper is organized as follows. In Section II, the data collection system via Wearable Sensor System (WSS), rehabilitation sessions and the preprocessing step applied to the kinematic signals are described. The proposed DCNN for classification of the progress according to the rehabilitation day is introduced in Section III. In Section IV, the evaluation results are demonstrated. Finally, the main conclusion of this work is presented in Section V.
Fig. 1. Wearable System Concept: the gait kinematic data are collected and processed with ML methods in an Android application for digital and biomedical healthcare systems. First step, data collection from patients with hip unilateral arthroplasty surgery. Second step, segmentation of kinematic signals in GCs. Step three, use of different IMUs and kinematic signals to train the proposed DCNN for rehabilitation progress monitoring.
II. DATARECORDING ANDPREPROCESSING
In this section, we introduce the procedure used to select the patients and the data collection. In particular, we provide a brief explanation on the rehabilitation sessions and the routines applied in this work. Furthermore, the hardware setup, including WS and a tablet are described.
A. Rehabilitation Training
For the study, a group of twelve voluntary patients with hip unilateral arthroplasty were selected (age: 63 ± 10 years, height: 173 ± 5 cm). All patients performed the same gait rehabilitation exercises and sessions. Before the first rehabilitation session, all patients were instructed about the course of sessions and the tasks they had to perform in each session. The WSS including four IMUs and an Android tablet were also explained to each patient. All patients performed three walking trials of 15 m to become familiar with the above-mentioned system. The study was conducted over two weeks excluding weekends and the patients had to perform one rehabilitation session per day. The rehabilitation sessions were based on gait exercises such as a 20 minutes walk in a sports hall in a rehabilitation clinic under the supervision of a physiotherapist.
B. Wearable Sensor System
The measurement setup consists of a set of four wearable IMUs integrated into a sensor platform [19]. The sensor units were attached to the patients’ foot, lower leg, upper leg and lower back as depicted in Fig. 1. To provide comparable conditions, the same sensors were attached to the same positions on each subject. The data were captured synchronously at a sampling rate of 60 Hz. Specifically, we used the Shimmer 3 sensor platform, which provides
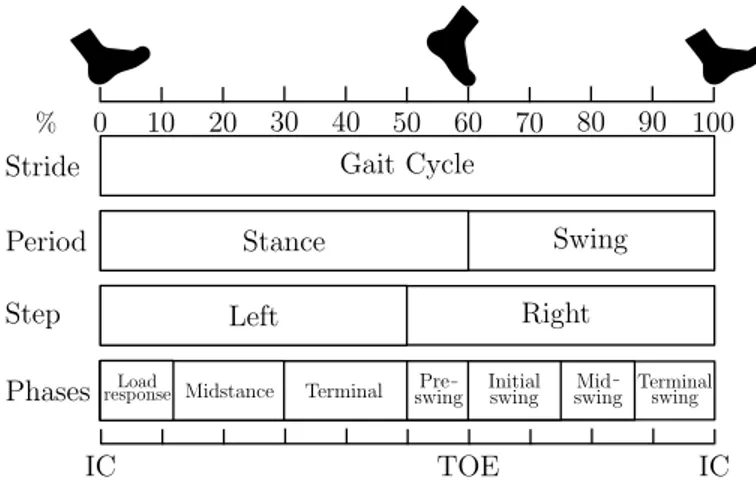
Fig. 2. Gait events and gait phases in one GC. The GC is divided into stance and swing phase. Stance starts from IC, to terminal contact TOE. Stance phase nearly represents about 60% of GC. Swing phase begins as soon as the toe leaves the ground, and ends just prior to IC. Swing phase occupies the rest 40% of the GC.
real-time kinematic motion sensing such as three-dimensional linear acceleration, angular velocity and magnetic field. The data were transmitted via Bluetooth, analysed and processed in an Android application developed for this purpose. The above-mentioned application is able to receive the kinematic data and perform monitoring of the rehabilitation progress.
C. Gait Cycle Segmentation
Human walking can be described in the context of a Gait Cycle (GC) (see Fig. 2). A stride is the distance between the Initial Contact (IC) of the first foot and the next IC of
3 4 5 6 7 8 9 10 -500 -400 -300 -200 -100 0 100 200 300 400 500
Mid-Swing Toe Off Initial Contact
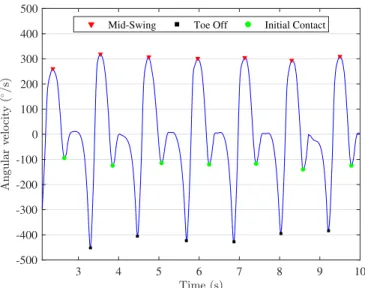
Fig. 3. Estimation of the IC and TOE obtained from the foot angular velocity in the sagittal plane. Red triangle, green circle and black square markers represent the MS, IC and TOE, respectively.
the same foot. In other words, a GC is made up of two steps. Each stride contains a stance and a swing phase. The stance and swing phases are the minimum number of phases in which a GC can be divided. A complex phase model with eight sub-phases reported in [20]–[22] is used to define the duration of the stride, stance and swing phases and accordingly other temporal parameters such as cadence, step length, gait speed, etc. [23]. The defined IC events as shown in Fig. 2-3 were used to segment the gait kinematic data (3D acceleration and angular velocity signals) into GCs. Each GC was resampled to the length of 100 samples so that all GCs have the same length [7], [24].
III. CONVOLUTIONALNEURALNETWORK
It has been shown that CNNs are suitable for processing multidimensional data [25]. They have the ability to learn a high level of abstraction and features by applying a con-volution operation to the raw input data. The CNN archi-tecture used here is based on the following building layers: Convolutional (Conv), Batch Normalization (BN), Rectified Linear Unit (ReLU), Dropout (D), Average-Pooling (AP), fully connected (FC) and Softmax (see Fig. 1). A convolutional connection between layers is defined by a set of Kl kernels
h1, . . . , hKl of length Ll and biases b1, . . . , bNl. The index l hereby represents a label for the layer. Given a multidimen-sional input vector xd with d = 1, . . . , Kl−1, the output of
the convolutional connection is computed as
on= φ X d hn,d∗ xd+ bn ! , (1)
with n = 1, . . . , Kl. To increase the stability of the CNN,
BN normalizes the output of the previous activation layer by
subtracting the batch mean and dividing by the batch standard deviation. The activation function φ used for this type of connection is ReLU. Dropout layers work by probabilistically removing inputs from a previous layer to the next one. The dropout parameter is defined as r. It has the effect of making nodes in the network generally more robust to the inputs. The AP layers increase robustness of the extracted features. The feature maps obtained by the convolutional connection are downsampled by taking the average in temporal windows of length p. The fully connected layer connects all outputs from the previous layer to all the inputs on the next layer. This type of connection is defined by a set of weight vectors W 1, . . . , WKl and biases b1, . . . , bNl. Given a single-channel input vector x, the activation of the densely connected layer is computed by matrix multiplication as
ak = ReLu X l Wl,k∗ xl+ bk ! , (2)
with k = 1, . . . , Kl. Following the dense layer, a Softmax
layer is applied. The Softmax layer turns numeric output of the last linear layer of a multi-class classification network into probabilities by taking the exponents of each output and then normalizing each number with the sum of the exponents. The Softmax output vector adds up to one. The last layer of the network is the classification layer. This layer uses the cross entropy loss function for multi-class classification. The cross entropy loss function is given by
c(y, m) = −ωmlog eym PM −1 u=0 eyu ! , (3)
where ωmis the loss weight of each class. ymand yuare the
outputs to the different classes. The index m = 0, . . . , M − 1 refers to the number of classes, which in this study is 10. In spite of the many benefits of the deep-layered structure of DCNN, a “deep” structure also means complicated hyper-parameters as well as various choices of architectures, which increases the difficulty to build an appropriate and efficient model. Although there are several studies [26], [27] about the automatic optimization of parameters of DCNN, the optimized process is usually time-consuming and easily converges into a local optimum due to the large number of DCNN parameters. Thus, the DCNN model was build initially based on a few general design principles [28]. Then several configurations of the network are tested using the experimental data, and the one with best performance is selected as the setting of the final model.
IV. RESULTS
The lower body gait kinematic data from twelve patients with hip unilateral arthroplasty were used for this study. The study lasted for two weeks excluding weekends and the patients had to perform one rehabilitation session of 20 min per day after the operation. The gait kinematic data were separated
in different rehabilitation days (1 to 10). The 3D linear acceleration and 3D angular velocity were segmented into GCs using the method described in Section II-C. The kinematic data from each patient and day were mixed together using different signals (linear acceleration and/or angular velocity) and IMUs (pelvis, thigh, shank and foot) (see Section II) to build a larger dataset for training, validating and testing the DCNN network. The 4D input matrix dimensions (R x C x d x S) of the each dataset fed into the DCNN depended on the number of IMUs and gait kinematic signals. The total number of available input matrices S, after the segmentation of the gait kinematic data of all twelve patients, is 98116. The number of channels d is 1. The columns C of the input data matrix is set to 1 GC (100 samples). The rows R of the input data matrix depends on the number of IMUs (1 to 4) and kinematic signals (3 to 24). In case of applying only one type of kinematic signal (acceleration or angular velocity), the number of signals per IMU is 3. In case of applying both kinematic signals (acceleration and angular velocity), the number of signals per IMU is 6 (see Table I).
To analyze the optimal placement of the IMUs and the impact of different kinematic signals on the rehabilitation progress monitoring, the CNN was implemented in Matlab and trained several times with different IMU combinations and signals. For all cases, the training, validation and test data were randomly split into 70% | 15% | 15%, respectively. For optimization, we used the adaptive moment estimation (Adam) method [29]. The mini-batch size and learning rate were set to 32 and 0.01, respectively. The training epochs were set to 15, which was found to achieve a good trade-off between generalization and classification accuracy, and at the same time avoids overfitting. A stop loss criterion was applied to the training progress by evaluating the validation loss over the validation steps. The training was stopped if there was no improvement in the validation loss during the last 3 validation checks.
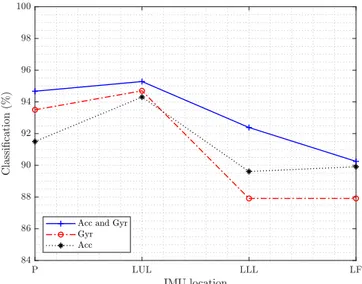
Fig. 4 shows the classification accuracy for different lo-cations of the IMUs and the effect of combining different kinematic signals for the progress monitoring. It can be seen that the classification accuracy for different sensors decreases as in the following order: thigh (LUL), pelvis (P), shank (LLL) and foot (LF). The best results for one IMU are achieved at the thigh with 3D acceleration and 3D angular
TABLE I
PROPOSEDDCNNARCHITECTURE AND HYPERPARAMETERS
Layer Parameters and functions Input R x C x 1 x 98116
Convolutional 5x5, 256, ’same’, BN, ReLu, D (r = 0.5) AP (2x2,Stride=1)
Convolutional 4x4, 128, ’same’, BN, ReLu, D (r = 0.2)AP (2x2,Stride=2) Convolutional 3x3, 96, ’same’, BN, ReLu
Convolutional 2x2, 48, ’same’, BN, ReLu Fully connected 10 classes
SoftMax
Classification Cross Entropy
Fig. 4. Classification accuracy of one IMUs applying the proposed DCNN for Pelvis (P), Left Upper Leg (LUL), Left Lower Leg (LLL) and Left Foot (LF).
TABLE II
CLASSIFICATION ACCURACY OF THE PROPOSEDDCNNFOR DIFFERENT
IMULOCATIONS AND KINEMATIC SIGNALS Sensors/Signals 3D Acc and 3D Gyr 3D Acc 3D Gyr
1 IMU 95.14% 90.30% 92.73%
2 IMUs 97.33% 95.81% 96.23%
3 IMUs 97.75% 96.30% 96.8%
4 IMUs 98.37% 96.65% 95.8%
velocity, since the related sensor is directly located below the hip joint and therefore, the kinematic signals reflect the changes of the limb motion range during the rehabilitation progress. The shank and the foot locations are not directly affected after the operation and thus exhibit low classification accuracy. Table II summarizes the classification accuracy for more than one sensor and the effect of different kinematic signals. It is seen that using more sensors for the rehabilitation monitoring progress leads to an improvement of the accuracy. For two IMUs, the thigh and the pelvis achieved the best results. For three IMUs, the thigh, pelvis and shank led to the highest classification accuracy. The effect of different kinematic signals (3D accelerometer and 3D angular velocity) of the IMUs regarding the classification accuracy are not consistent for gyroscopes and accelerometers. In the case of one IMU, the 3D angular velocity signals achieve better results than the 3D acceleration for the pelvis and thigh. However, the 3D acceleration signals achieve better results than the 3D angular velocity for the shank and foot. This effect may suggest that upper limb locations are convenient for gyroscopes and lower limb locations are more suitable for acceleration sensors. Therefore, the combination of the complementary information from different sensors, signals and locations increases the classification accuracy.
V. CONCLUSIONS
This study investigated the application of the proposed DCNN for the rehabilitation monitoring using the kinematic data of patients with unilateral hip arthroplasty operation. The results show that the proposed DCNN is capable to monitor the progress of the rehabilitation in response to a physiotherapeutic training. Therefore, the integration of machine learning and wearable sensor technology provide an objective way to understand the changes on the human movement during the rehabilitation process. A comprehensive analysis of multiple locations of the wearable sensors for rehabilitation monitoring was performed with the gait kinematic data from four IMUs located at different positions on the body: pelvis, thigh, shank and foot, respectively. The effect of different type of signals (acceleration and angular velocity) was also analyzed. The gait kinematic signals were segmented into GCs and used as input for the proposed DCNN for rehabilitation progress classification. For one IMU, the best results were obtained from the sensor placed on the thigh due to the direct relation to the motion range of the hip. Future work will include the analysis of the number of GCs and kernel size used for the DCNN input data and the time-frequency relation of the gait kinematic data during the rehabilitation.
REFERENCES
[1] S.Y. Park, S.Y. Lee, H.C. Kang, and S.M. Kim, “EMG analysis of lower limb muscle activation pattern during pedaling: Experiments and computer simulations,” International Journal of Precision Engineering and Manufacturing, vol. 13, no. 4, pp. 601–608, Apr 2012.
[2] C. Prakash, K. Gupta, A. Mittal, R. Kumar, and V. Laxmi, “Passive Marker Based Optical System for Gait Kinematics for Lower Extremity,” Procedia Computer Science, vol. 45, pp. 176 – 185, 2015, international Conference on Advanced Computing Technologies and Applications (ICACTA).
[3] L. Yu, J. Zheng, Y. Wang, Z. Song, and E. Zhan, “Adaptive method for real-time gait phase detection based on ground contact forces,” Gait & Posture, vol. 41, 10 2014.
[4] S. Gill, N. Seth, and E. Scheme, “A Multi-Sensor Matched Filter Approach to Robust Segmentation of Assisted Gait,” Sensors, vol. 18, no. 9, 2018. [Online]. Available: https://www.mdpi.com/1424-8220/18/9/2970
[5] M. Meghji, A. Balloch, D. Habibi, I. Ahmad, N. Hart, R. Newton, J. Weber, and A. Waqar, “An Algorithm for the Automatic Detection and Quantification of Athletes’ Change of Direction Incidents Using IMU Sensor Data,” IEEE Sensors Journal, vol. 19, no. 12, pp. 4518–4527, June 2019.
[6] S.O.H. Madgwick, A.J.L. Harrison, and R. Vaidyanathan, “Estimation of IMU and MARG orientation using a gradient descent algorithm,” in 2011 IEEE International Conference on Rehabilitation Robotics, June 2011, pp. 1–7.
[7] S.K.A. Kork, I. Gowthami, X. Savatier, T. Beyrouthy, J.A. Korbane, and S. Roshdi, “Biometric database for human gait recognition using wear-able sensors and a smartphone,” in 2017 2nd International Conference on Bio-engineering for Smart Technologies (BioSMART), Aug 2017, pp. 1–4.
[8] M. L. Frechette, B. M. Meyer, L. J. Tulipani, R. D. Gurchiek, R. S. McGinnis, and J. J. Sosnoff, “Next steps in wearable technology and community ambulation in multiple sclerosis,” Current Neurology and Neuroscience Reports, vol. 19, pp. 1–10, 2019.
[9] R. D. Gurchiek, R. H. Choquette, B. D. Beynnon, J. R. Slauterbeck, T. W. Tourville, M. J. Toth, and R. S. McGinnis, “Remote gait analysis using wearable sensors detects asymmetric gait patterns in patients recovering from acl reconstruction,” in 2019 IEEE 16th International
Conference on Wearable and Implantable Body Sensor Networks (BSN), May 2019, pp. 1–4.
[10] M.A. Anwary, H. Yu, and M. Vassallo, “An Automatic Gait Feature Extraction Method for Identifying Gait Asymmetry Using Wearable Sensors,” Sensors, vol. 18, p. 676, 02 2018.
[11] N.M. Rad, T. Van Laarhoven, C. Furlanello, and E. Marchiori, “Novelty Detection using Deep Normative Modeling for IMU-Based Abnormal Movement Monitoring in Parkinson’s Disease and Autism Spectrum Disorders,” Sensors, vol. 18, no. 10, 2018.
[12] G. Mahitha, N. Swarna, V. Muralidharan, and R. Amutha, “Medical activity monitoring for elderly people using wearable wrist device,” in 2017 International Conference on Communication and Signal Process-ing (ICCSP), April 2017, pp. 2016–2020.
[13] I. Mileti, M. Germanotta, E. Di Sipio, I. Imbimbo, A. Pacilli, C. Erra, M. Petracca, S. Rossi, A. R. Del Prete, Z. andcBentivoglio, L. Padua, and E. Palermo, “Measuring gait quality in parkinson’s disease through real-time gait phase recognition,” Sensors, vol. 18, no. 3, 2018. [Online]. Available: https://www.mdpi.com/1424-8220/18/3/919 [14] J. Conte Alcaraz, S. Moghaddamnia, and J. Peissig, “Mobile
quantifi-cation and therapy course tracking for gait rehabilitation,” in 2017 22nd International Conference on Digital Signal Processing (DSP), Aug 2017, pp. 1–5.
[15] R. Ferber, S. T. Osis, J. L. Hicks, and S. L. Delp, “Gait biomechanics in the era of data science,” Journal of Biomechanics, vol. 49, no. 16, pp. 3759 – 3761, 2016. [Online]. Available: http://www.sciencedirect.com/science/article/pii/S0021929016311332 [16] M. Goodwin, M. Haghighi, Q. Tang, M. Akcakaya, D. Erdogmus,
and S. Intille, “Moving towards a real-time system for automatically recognizing stereotypical motor movements in individuals on the autism spectrum using wireless accelerometry,” 09 2014, pp. 861–872. [17] T. Bhosale, H. Kudale, V. Kumthekar, S. Garude, and P. Dhumal, “Gait
analysis using wearable sensors,” in 2015 International Conference on Energy Systems and Applications, Oct 2015, pp. 267–269.
[18] J. Hannink, T. Kautz, C.F. Pasluosta, K. Gaßmann, J. Klucken, and B.M. Eskofier, “Sensor-Based Gait Parameter Extraction With Deep Convolutional Neural Networks,” IEEE Journal of Biomedical and Health Informatics, vol. 21, no. 1, pp. 85–93, Jan 2017.
[19] Shimmer: Discovery in motion. [Online]. Available: http://www.shimmersensing.com/
[20] J. Perry and J. Burnfield, Gait Analysis: Normal and Pathological Function, 02 2010.
[21] G.P. Panebianco, M.C. Bisi, R. Stagni, and S. Fantozzi, “Analysis of the performance of 17 algorithms from a systematic review: Influence of sensor position, analyzed variable and computational approach in gait timing estimation from IMU measurements,” Gait & Posture, vol. 66, pp. 76 – 82, 2018.
[22] A.M. Sabatini, C. Martelloni, S. Scapellato, and F. Cavallo, “Assessment of walking features from foot inertial sensing,” IEEE Transactions on Biomedical Engineering, vol. 52, no. 3, pp. 486–494, March 2005. [23] A. Baghdadi, L.A. Cavuoto, and J.L. Crassidis, “Hip and Trunk
Kine-matics Estimation in Gait Through Kalman Filter Using IMU Data at the Ankle,” IEEE Sensors Journal, vol. 18, no. 10, pp. 4253–4260, May 2018.
[24] N.H. Ghassemi, J. Hannink, C.F. Martindale, H. Gaßner, M. M¨uller, J. Klucken, and B.M. Eskofier, “Segmentation of Gait Sequences in Sensor-Based Movement Analysis: A Comparison of Methods in Parkinson’s Disease,” Sensors, vol. 18, no. 1, 2018. [Online]. Available: https://www.mdpi.com/1424-8220/18/1/145
[25] I. Goodfellow, Y. Bengio, and A. Courville, Deep Learning. Cambridge: MIT Press, 2016.
[26] J. S. Bergstra, R. Bardenet, Y. Bengio, and B. K´egl, “Algorithms for hyper-parameter optimization,” in Advances in Neural Information Processing Systems 24, J. Shawe-Taylor, R. S. Zemel, P. L. Bartlett, F. Pereira, and K. Q. Weinberger, Eds. Curran Associates, Inc., 2011, pp. 2546–2554.
[27] L. Zhang and P. Suganthan, “A survey of randomized algorithms for training neural networks,” Information Sciences, vol. 364-365, pp. 146 – 155, 2016.
[28] O. Abdel-Hamid, l. Deng, and D. Yu, “Exploring convolutional neural network structures and optimization techniques for speech recognition,” 08 2013.
[29] D.P. Kingma and J.L Ba, “Adam: A Method for Stochastic Optimiza-tion,” International Conference on Learning Representations, 12 2014.