_ VW î .. г іД ’
нс
4-Зг
Z
4 .3і З В 2 .
ANALYSIS OF THE LAST 15 YEARS OF TRADE BETWEEN TURKEY AND IRAN
AND FINDING THE POTENTIAL AREAS FOR EXPANSION
A Thesis
Submitted To The Department Of Management And Graduate School Of Business Administration
Of Bilkent University
In Partial Fulfillment Of The Requirement For The Degree Of
MASTER OF BUSINESS ADMINISTRATION
BY:
FARHAD ZEHTABFARD
f th-lnci 'X>t ^'
1
;■ Ui-cfir,ai hc |ir,!anrni}iir.К С ^92
I (’-M l ily that I have read this thesis and in my opinion it
is Int1y adequate in scope and quality,as a thesis for the
'legrf f (if Hystar of Rnsinaps Administration.
m L · - - . . . .
Assoc.PTOf.Gokhan CapogluI certify that I have read this thesis and in my opinion it
i.c fnlly adequate in scope and quality, as a thesis for the
depiici. of Master of Business Administration.
Assist.Prof.Fatma Taskin
1 'iettify that I have read this thesis and in my opinion it
ir; fully adequate in scope and quality,as a thesis foi. the
deg) (^c of Master of Business Administration.
Assist.Prof.Erol Cakmak
Api'inived for l.lie graduate school of Business Admin i si rytion.
ABSTRACT
ANALYSIS OF THE LAST 15 YEARS OF TRADE BETWEEN TURKEY AND IRAN
AND FINDING THE POTENTIAL AREAS FOR TRADE,1976-1990
By:Farhad ZEHTABFARD MBA In Management
Supervisor:Assoc.Prof.Gökhan CAPOGLU May,1992
This study basically aims at analyzing the last 15 years of trade between Turkey and Iran and finding the potential areas of increase in trade. After looking at the general economic situation of each country and looking at the history of trade between the two countries, the share of each country in the total trade of the other country is analyzed to find the variations during the past years.
The next step is the analysis of the composition of trade among the two countries to find the potential areas of increase in trade of each item. Finally both the political and economic views of the countries are analyzed to see their inclination towards expanding the economic relations.
ÖZET
Ir a n v e t ü r k î y e a r a s i n d a s o n i 5 y i l d a y a r i l a n
T İ C A R E T İ N a n a l i z i v e POTANSİYEL ALANLARI BULMAK
F a r h a d Z e h t a b f a r d M. B. A S u p e r v i s o r : D o ç . Dr . Gök han Ç a p o ğ l u Mayı s , 1 9 9 2 Bu ça l ı ş ; ma . n ı n amacı T ü r k i y e v e İ r a n a r a s ı n d a s o n 15 y ı l d a y a p ı l a n t i c a r e t i a n a l i z etmek v e p o t a n s i y e l a l a n l a r ı b u l m a k t ı r . Her i k i u l k e n i n g e n e l ek onomi k d ur umu i n c e l e d i k t e n s o n r a > h e r ü l k e n i n d i ğ e r ü l k e d e k i d ı ş t i c a r e t i n d e k i pa^^ı b a k ı l a c a k v e s o n y ı 11 a r d a k ı d e ğ i ş i k 1 i k1 e r a n a l i z e d i 1 ec e k t i r . B i r s o n r a k i a ş amad a b ü t ü n i t h a l a t v e i h r a c a t t a k i m a d d e l e r d e t a y l a r l y l a . a n a l i z e d i l e c e k l e r v e p o t a n s i y e l m a d d e l e r b u l u n a c a k t ı r . En s o n a şamad a h e r i k i ü l k e n i n p o l i t i k v e ekomomıik g ö r ü ş l e r i a n a l i z e d i l e c e k t i r . 1 v
ACKNOWLEDGEMENTS
I would like to thank to my supervisor Assoc.Prof.D r . Bokhan Capoglu for his support, encouragement and guidance for the preparation of this tkiesis.
I would also like to thank to Assist.Prof.D r . Fatma Taskin and Assist.Prof.D r . Erol Çakmak for their critisizm and suggestions.
I also have my thanks to my friends Shoeleh and Ali for their patience and understanding.
Finally, I would like to express my appreciation to my parents for providing the necessary encouragement and environment for me to continue my education and prepare this thesis.
LIST OF TABLES TABLE 1 2 3 4 5 6 8 9 10 11 12 13 14 15 16
Oil export revenues of Iran GDP growth rates
Turkey's trade with Iran
Iran's share in Turkey's trade Oil export of Iran to Turkey
Share of Turkey in the total imports of I ran
'/. Of non oil exports to total exports of Iran to Turkey in years
Rank of Turkey when compared to other countries in providing Iran's imports and buying its exports in selected years
Total imports and exports of Iran
Trend of trade of Turkey with Iran on weight basis in selected years
Turkey's trade with Iran
Turkey's imported oil and the 7. provided by Iran
Turkey's imports from Iran Turkey's exports to Iran Turkey's trade with Iran
Comparison of the prices of some selected goods imported from different countries
Page 9 11 18 19 20 21 21 22 24 25 26 29 35 41 47 48 111
Page ABSTRACT ... i ACKNOELEDGEMENT... ii OZET ... iii LIST OF TABLES ... iv 1.INTRODUCTION N 1.1.Introduction to the subject ... 1
2. ECONOMIC OVERVIEW OF TURKEY... 2
2.1.Industry Overview ... 4
3. ECONOMIC OVERVIEW OF IRAN ... 7
2.1.Industry Overview ... 10
4. ANALYSIS OF TRADE 4.1. History of economic relations ... 12
4.2. Trade relations ... 18
4.2.1.Share of the two countries in the total trade ... 18
4.2.2.Share of Iran in Turkey's trade compared to other countries ... 22
4.2.3.General trand of trade ... 24
5. COMPOSITION OF THE COUNTER TRADED GOODS 5.1. Goods imported from Turkey ... 28
5.2. Goods exported to Turkey ... 29
5.2.1. Mineral fuels ... 29
5.2.2. Non-oil goods ... ... 31
5.3. Analysis of traded items ... 33
5.3.1 .Turkey' s imports from Iran ... 33
5.3.2. Turkey's exports to Iran ... 39
6. REASONS AND MOTIVES FOR EXPANSION OF TRADE BETWEEN TURKEY AND IRAN 6.1. Political reasons 6.1.1. Policy of Iran with respect to third world countries ... 46
6.1.2. Positioning of Turkey during the economic embargo of Iran and Iran-Iraq war ... 46 6.2. Economical reasons
6.2.2.Drop in the capacity of Iran's harbours ... 49
0.2.3.Closeness of the countries ... 50
6.2.4.Turkey's policies ... 51
7. CONCLUSION ...52
8. REFERENCES ... '... 58
1.IMT.RQDUCTI0M
1.1.Introduction :
The object of this thesis is to study the last 15 years of trade between Turkey and Iran and find the potential areas of increase in trade among these countries by analyzing their capacities, needs, and political views.
During the last 15 years a lot of changes and incidents such as the 1979 revolution in Iran, the military takeover in Turkey, Iran-Iraq war, and the Gulf crisis occurred in the region which affected the governments policies and as a result the trades between the two countries both adversely and positively. On the other hand the strategic location of both countries has had an important effect on the policies and subsequently on their trade policies.
After studying the current economic situation of each country, the history of trade and developments in trade in different periods is analyzed. Finally the reasons and motives for the expansion of trade between the two country are analyzed.
2. E C O N O M IC O V E R V IE W OF T U R K E Y
The liberal economic policies adopted in 1980 forced Turkey's economy to grow faster. Exports have risen continuously since 1980, growing from $5.7 billion in 1983 to $12.9 billion in 1990. The rapid pace of both public and private investment has outstripped Turkey's domestic resources , and substantial current account deficits have induced Turkey to seek new foreign resources to make possible continued growth .
Total foreign debt now stands at over $49 billion, versus $18.4 billion in 1983. The maturity structure of this debt, about 23 percent in short term obligations, puts the government under pressure to continue its borrowing at a sustainable level. Realizing that new borrowing is not sustainable over the long term, Turkey has given priority to attracting direct foreign investment. The innovative buiId-operate-transfer concept has had success in attracting investors to Turkey.
Another mean the Turkish government is using to help better balance Turkey's supply and use of financial resources is its privatization program. Income generation is only one consideration of the privatization program. The government also hopes to prime Turkey's capital market with an attractive selection of equities. Thus channeling more of its citizens' saving into productive financial instruments (from gold and real state).
Turkey is one of the few food supplier countries of the world and has established itself as a food and fibers exporters. Among its most important agricultural products produced in Turkey are wheat, barley, cotton, tobacco, hazel nuts, fruits, pulses, sugar beets, olives, corn, sunflower seeds, and many types of vegetables. Production of live stock, poultry, and dairy food is also expanding.
Turkey's industry is more modern and diversified than that of most developing countries. Generally speaking, heavy industry is composed of state-owned companies that supply basic industrial raw material such as steel, chemicals, paper, and aluminum to private sector companies, which manufacture intermediate and finished consumer and light industrial goods.
More recently, the state-owned companies have begun to expand into capital goods manufacture<eg.machine tools), while the private sector has successfully diversified into raw materials processing and heavy industrial goods.
The export of services is also important to the Turkish economy. Today over 150 Turkish construction and engineering firms have contracts valued in excess of $20 billion in Middle Eastern and North African countries. Turkish construction industry sources estimate that more than $10 billion in new contracts will be awarded for the reconstruction of Iran and Iraq after the Gulf war.(Overseas
The potential for significant export growth exists. Greater emphasis on marketing, quality control and diversification of exports to countries benefiting from lower oil prices will also be necessary since the final price of exports will be lower than other countries.
2.1.Industry Overview
The gross domestic product has averaged a 5.5 percent growth rate since 1980 and is continuing to grow.
Industrialization was the fundamental factor for this rapid economic growth. Over the past 10 years, the industrial sector has overtaken agriculture which was the most important contributor to G.D.P.
current 1prices (% of total)
1980 1988 1989 1990
Industry 25 33 31 29
Construction 5 4 4 4
Agriculture 23 17 17 18
Services 47 47 48 49
SourceiCentral Bank Of Turkey, Monthly Bulletin
Industry(notably manufacturing) has moved well ahead of agriculture since the 1960's in term of both its share of GDP and its contribution to economic growth. During 1981-90 industry grew by 7.1 percent annually, compared with 3.0 percent for agriculture and 5.0 percent for services.
Mining and energy together contributed 6 percent to ODP. Problems with these industries in the past have included shortages of fuel, electric power, and imports of machinery, parts, and materials for processing that caused a decline in industrial output before 1979.
Although mining contributes only a small portion to GDP, this subsector provides the raw material for such key industries as iron and steel, electric power, aluminum, and cement. There remain large untapped reserves of materials, and joint venture participation with foreign firms has been actively sought to develop this sector.
The original articles of association between Turkey and the E.C. brought the consideration of the formation of a customs union between Turkey and the E.C. by 1985. To date, relatively little progress has been made towards creation of a customs union. Turkey was to reduce tariffs on a group of commodities imported (primarily raw materials) by 10 percent increments over a 12-years period and to reduce tariffs on a group of manufactured goods, with the exception of petrochemicals, iron and steel products, textiles, and agricultural products, by 5 to 10 percent over a 22-year period. Turkey also agreed to eliminate quantitative restrictions on imports from the E.C..
As Turkey's customs tariffs vis-a-vis the E.C. are reduced, its tariffs with regard to non-E.C. countries,
included the U.S., will also be brought into line with the E.C.'s Common Customs Tariff.(Overseas Business Reports, 1989)
s.Eoonomio Oyervlew q
L
IranAt the present time the main influences on the economy arise from the political factors, principally the continuing adverse after effects of the Iran-Iraq war. During 1980-1988, the authorities had been preoccupied with the war effort, and allocations of available financial and real sources were influenced strongly by the claims of the military. In most ways the country had a full scale war economy.
The effects of disinvestment brought on by eight years of economic dislocation are apparent in low rates of growth, specially in industry and even the oil sector. The exodus of trained Iranians and the problem of using expatriate labor have combined to create an adverse impact through constraining the availability of skilled managerial and technical personnel. The basic indigenous sector, agriculture has to recover from the change done to it during the years when the oil economy was rapidly developing during the 1970's(Neglecting agriculture and emphasizing on oil industry)
Disruption in the economy have been apparent since the early 1980's when most large businesses closed, creating massive unemployment. Moreover, industries that once relied on U.S. and European technicians closed or reduced operations during 1980-85. However, since 1985, Iran has been trying to diversify its industry, agriculture, trade, and sources of
technology. Increased demand for war related products has also forced many factories to reopen under public management, thus creating more jobs.
Factories once d o s e d for lack of foreign skilled labor are also reopening, mostly using technicians from other developing countries.
Even if the political climate was friendlier, few Americans, Europeans, or Japanese would contract in Iran because of the disastrous erosion in the value of the Iranian rial, which dropped from 70 to the dollar in 1981 to the current rate of about 800 to the dollar in 1992. This has also contributed inflation estimated at more than 25 percent.
Iran has faced to a declining international market for oil since 1982. Deterioration in the increase generated by the oil and gas industry was exacerbated by a cut in gas exports to the U.S.S.R in the immediate aftermath of the revolution(1980). With the exemption of a brief period of recovery during 1982-1983(table 1), Iran's main economic prop, oil revenue, was gradually dropped by events mainly outside its control.
Although there was a recovery in the international oil price after 1989, the impact on' Iranian revenue was minor because export volumes remained depressed and unit costs of crude exports remained abnormally high. High costs remain a legancy of the damage done and the inadequate maintenance
undertaken since 1979. As a result, the government has sought other sources of foreign exchange, opening negotiations with countries previously banned like England and France.
(Table 1) Oil Export Revenues Of Iran ($mn) Year Expart ($ ) 1976 22,923 1977 23,599 1978 21,684 1979 19,186 1980 13,286 1981 12,053 1982 19,233 1983 19,225 1984 12,255 1985 13,115 1986 7,183 1987 10,515 1988 8,170 1989 12,500 1990 19,700
Source:OPEC,Annual Statistical Bulletin
Iran also has sought to increase exports of petrochemicals, fertilizers, and agricultural commodities.
After the Iran-Iraq war repair of facilities, completion of construction and using the capacity of industries was not performed due to lack of sources.
The industrialized developed countries due to high political risks in Iran have not offered large amounts of credits for the reconstruction of the damages and on the other hand since Iran does not want to get credit from European and western industrialized countries the reconstruction expenditures is acquired through internal sources.
3.1.Industries
Handicrafts is a major economic activity which is spread all-over the country. The production of woolen and silk carpets, felt and kilims as well as other handicrafts form the traditional arts and create massive employment over the country.
Modern industry has started in 1930-40's in textile and food industries and it was followed by fertilizer, sugar, and cement. In heavy industries, cooperation started with Eastern bloc and continued by western investors investments in automotive industry, petroleum, chemicals, and steel.
Large industries, specially that of government are highly dependent on imported raw material, parts, machinery and technology. These industries were mainly designed for final stages of production.
The most dependent industries are machine and metal product industries which in 1990, 84.8% of their inputs were imported from abroad, next paper and printing with 79%; chemicals with 71%; textile, leather and printing with 55.7% imports, consisted the most highly dependent industries,
Oil industry which had the capacity of extraction and export of up to 300 million tons of crude oil per year, after the war it lost the refining capacity of the domestic needs which is a few million tons. This industry with its experience
of over 80 years, is still importing most of its required machinery and technology and it is not even capable of exporting its crude oil with national containers.
By looking at table 2. we can observe that the maximum GDP growth rate was in 1881-82 period in agriculture with 11.3% , in 1982-83 in oil and gas with 92.5%, in 1983-84 in industry and mining with 15.6% and at the same period in services with 18.6%.
( Table 2.) GDP Growth Rates (%,Constant 1974/75 prices)
80/81 81/82 82/83 83/84 84/85 85/86
Agriculture 1.9 11.3 7.9 -1.6 4.1 8.9
Oil and Gas -56.9 -17.2 92.5 0.8 -14.8 -3.6 Industry/Mining 1.6 2.7 10.5 15.6 3.2 -2.8
Services -5.5 1.9 2.8 18.6 2.1 -2.5
4.AMALYSIS Q£ TRADE
4.1.History Of Econonic Relations
Turkey and Iran have had a long and close relation since 1930's but after looking at the history of the economic relations it can be noticed that until 1930, when a treaty was signed between Turkey and Iran, the economic relations were at a minor level, eyenthough the political views were quite close.
The major economic and technical agreements were as follows:
-Custom duty agreement (June 1930)
-Agreement on custom operations in Turkey-Iran border(March 1937)
-Agreement on installing telegraph and telephone lines (March 1937)
From those dates on the relations started improving and the following agreements were signed:
-Flight agreement within two countries(20 March 1951) -Transit contracts with two protocolsd Feb, 1954)
-R.C.D.(Regional Cooperation For Development)treaty among Turkey,Iran and Pakistan(22 July 1964)
-Agreement on cancellation of visa requirements for the residents of both countries(18 Oct. 1964)
-Agreement on economic and technical cooperation between two countries(6 June 1975)(1)
In the frame of R.C.D. agreement, cooperations in
agricultural, trade, education and technical activities existed. The major aim of R.C.D. was to produce technical, cultural and economical cooperation as well as free trade of goods by signing tr.ade contracts and improving air, marine,
and road transportation lines.
After the revolution in 1979 in Iran due to the doubts of Iran in remaining in R.C.D. or getting out,the annual meetings of ministries was postponed for few years and finally in 1984 the meeting was held in Tehran and the name of R.C.D. was changed to E.C.O. (Economic Cooperation Organization)and different ideas such as forming an Islamic market, establishing a bank for expanding investments of E.C.O. were discussed.
These agreement were based on fortification of economical and technical cooperation between two countries to develop the economies and comfort of both nations and cooperation between private and state owned enterprises in different areas such as Industry, Agriculture, and Tourism.
After the 1979 revolution due to the political point of views and positions the two governments relations faced stagnation.
During the economic embargo of Iran by the U.S. and its allies, impartiality and not joining the embargo improved the relations and the trade volume (both import and
export) increased noticeably (Graph 1 ).The commodities
whose export increased were : meat, dairy products, cereals,
animal or vegetable fat, sugar, organic chemicals,
pharmaceutical products, dyeing extracts, soap, chemical
products, plastics, paper and paper board, wool, wadding,
knitted fabrics, clothing accessories, footwear, articles of
iron and steel, copper and aluminum, machinery, vehicles,
and musical instruments.(State Institute of Statistics,1990 ,Handbook of Turkey)
(GRAPH 1)
TURKETS TRADE VOLUME WITH IRAN
2500 2000 4» (0 3 u.o
(0 Z 01
2 15001000
500i i
1*· I 76 77 78 79 80 81 82 83 84 85 86 87 88 80 90 YEARHowever, eventhough there was an increase in the total
volume of trade of Turkey (Graph 2,3) in the 1980's the
percent share of Iran in the total trade volume has
decreased(Graph 4).
The reason for this can be soaked in the political and
economical developments of Western European countries and the expansion of trades between Turkey and E.E.C. as well as the political positioning of Iran. Briefly this can be due to
(GRAPH 2)
TURKEY’S FOREIGN TRADE
IMPORTS ^ EXPORTS ^ BALANCE
(GRAPH 3)
TURKEY’S TRADE WITH IRAN
1600 1400 4» 1200 CO 1 1000 o CO 800 g 600 2 400 200 0 — — — — — — — 1 , 1 , 1 1 1 ” 1 1 —r**-X - t" I® I YEAR IMPORTS EXPORTS
(GRAPH 4 )
economic o.tireeiiiyrity Turkey and E. E. C. coutitrief:: as w e l l as I r a n ' s p o l i c y in reduciriii impox'ts.
4.2.Trade Relations
4.2.1.Share of the two countries in the total trades
We can observe from Graph 4 that both the volume and value
of the trade of Turkey had increased until 1986 and the
meanwhile drop was just coincident with the 1973 revolution of Iran due to the unstable situation of Iran during the
revolution.
As it can be observed from table 3 the total value of trade of Turkey with Iran dropped from $533.2 millions to $187.7 millions in 1979 and from $2343.5 million to $785.7 millioiis
in 1986 which was due to the new policies of Iran in
reducing the imports.
Table 3 (Turkey's Trade with Iran) In millions of US$ Year Volume 1076 143.0 1977 213.6 1978 533.2 1979 187.7 1980 887.3 1981 748.5 1982 1538.8 1983 2309.8 1984 2316.7 1985 2343.5 1986 785.7 1987 1387.3 1988 1205.4 1989 794.5 1990 987.9
In a n a l y n t 5 i ’i; t‘>?rc'en taii-j.'i; o f e/ivher expox-ty or iiMports by I r a n by l o o k i n g at t a b l e 4.
(Table 4) (Iran'a Share in Turkey'o Irctde)
Year % In T u ,c· k e y ' s e xi> o r t s % I n T u r k e y ' s i iii p o r t s
1976 1877 1878 1873 1980 1881 1983 1984 1985 1986 1887 1988 1983 1990 2.13 2.85 10.82 3.47 10.15 5.76 8.46 13.23 14.55 11.15
1
. 6 4.1
2. 99 69 60 4821
1.71 2.77 1,95 2.91 4.97 13.77 18.89 10.53 13.56 7.57 4.32 4.68 4.83 3.83Source :State Institute of Statistics(1976-1991)
we can observe that in some periods for example in 1984 ,15
J
/oof Turkey's total exports were exported to Iran and in 1984
almost 19% of Turkey's total imports were provided by
Iran. This shows that even though both countries have the
capacity of providing the other's needs, due to several
reasons they do not. For example as it can be observed in
table 4 in 1990 the percentages dropped to 2.21% in imports
of Turkey and to 3.83% in exports. This trend caii be
observed also in the total oil export revenue of Iran as
Tubiu b ( o n E.iport of Iran to Tux-koy} ($iah; 1 о a X' V
i
f
.
1 1376 1977 1978 1979 1980 1981 1982 1983 1984 1985 1986 1987 1938 1989 1990 109 n 165.0 488.0 176.0 801.0 515.0 748.0 1 2 2 1 . 0 1562.0 1248.0 218.0 945.0 658.0 232.0 488.0ource:State Institute of Statistics, 1991, Handbook, Turkey
The reason for this can again be the policy of Iran in
reducing the importfx as well as a reduction in the export of
crude oil. By looking at table 4 we can observe that in
1983, 1984, and 1985 the maximum share of Iran in Turkey's
both export and import took place. Turkey imported mainly
crude oil and exported different goods, (analyi2ed in latex-
chapters) , and due to the policies of both reductiori of
imports of different goods and export of oil this percentage.s
dropped. On the other hand Turkey by signing trade
agreements with EEC countries increased its trade with those
countries, this in addition to Iran's policies dropped the
percentages.
In analysing the share of Turkey in Iran's total trade we
can observe from Table 6 that Turkey's share in Iran's
;1 :i 1^;i1
1 Q r \ {· ''.i. 1 I'i,
i:· *:'■ W j. .i .1, X li 1. i.! ;r:. a e* a i 1 t.i i a t· e t.^ о d i t ■,iU.U.e
^Tabl e 6) Share or Tur key In The Total Imp oris Of Iran
76 77 78 79 30 81 82 33 8<1i 85 36 S7 83 30
28 .22 .24 i 2.2 6.5 4.7 3.(• 7.5 6.3 4.2 5.2 9.1
ooui'ce: Aiiiiual Report of Foreign Trade of Iran, 1930
If we anaiyi^e the share of Iran in th-j inports of Turkey
from table 5 we can observe that the шах1шит share of Iran
in pi ovicliiig the Turkey's needs was 18% which hu.;·: dropped
more than 5 times to 3.83% in 1890 which теа.пе Turkey is
acquiring its requirements from some other countries.
If we take a look at the non-oil exports of I ran to Turkey Table 7 we can see that almost none of the total exports
of Iran consisted of non-oil products and the maximum uh.v
in 1988 with 2.4% which dropped to 0.08% in 1989.
(Table 7)% of Non Oil Exports To Total Exports of Iran To Turkey In Years
78 77 78 79 80 81 82 83 84 85 86 87 88 80 90
0 .0 .09 .09 .03 .01 .3 . 1 .56 1.62 .4 .67 .88 .32 OG
Source:Annual Statistical Supplement of Trades
and only in 1085 and 1986 years it was able to export
noticeable amounts of other goods such as iriorganio
chemicals, textile fibers, wadding, ceramic products,
machinery, and vehicles.
This means that Iran should improve the quality and
marketing of the products in order to be competitive in
Turkish markets.
4.2.2.Share Of Iran In Turkey's Trade Coapared To Other Countries
By looking at table 7 which gives the ranking of countries according to the amount of imports and exports in selected
years from Iran we can observe a great improvement in the
sense of exports of Turkey to Iran since as it can be
observed Turkey has improved from being the 32nd supplier of
Iran's needs in 1976 to the 2nd most important supplier-
according to the volume of exports in 1989.
( Table 7>Rank of Turkey When Compared To Other Countries In Providing Iran's Imports And Buying Its Exports
In Selected Years
1976 1979 1982 1985 1986 1987 1988 1989
Selling Goods 32 40 3 3 5 8 4 2
Buying Goods 67 45 30 11 20 15 28 34
Source :Iran's Statistical Annual Supplement,1990
Here the capacity of both Iran and Turkey in order to
provide the other countries requirements can be observed
clearly. Aa it can be observed and mentioned above Turkey
has improved its situation in years but Iran has lost the
11th position it had in 1985, and has dropped to 34tii
supplier of Turkey's imports, this again shows the
possibility of improvement in the current position of Iran's exports.
In regional analysis the most important regions by which
Turkey is dealing are :E.E.C, O.E.C.D. followed by Middle East and N. Africa. The principle trading partners of Turkey are Iran, West Germany, Iraq, U.S, Switserland, and England.2
As it can be concluded Iran's competitors in exporting
goods to Turkey are; W.Germany, U.S and Iraq which means the quality of the produced goods should be at least as good as the others as well as providing that quality at a cheaper price to gain advantage.
4.2.3.General Trend Of Trades
In this section the general trend of trade is discussed in
two different period of post and pre-revolution since the overall policy of these two governirients differed a lot.
By looking at Table 8 we can observe a tremendous drop
in the total exports of Iran in 1979 and 1986 as well as
a drop in the imports during the same period which was due to the unstable period of revolution. The same trend can be observed in the exports of Iran to Turkey (graph 2).
Table 8 ( Total import and export of Iran )
millions of U.S. $
Year Import Export
1976 12,894 23,541 1977 14,070 24,260 1978 13,549 22,476 1979 9,738 19,807 1980 12,246 13,235 1981 14,693 10,234 1982 11,955 18,570 1983 18,320 19,378 1984 15,370 12,422 1985 11,635 13,328 1986 10,521 8,322 1987 9,570 12,691 1988 9,454 9,930 1989 12,970 13,439 1990 17,150 12,970
Source: International Financial Statistics, Yearbook, 1991
If we look at the trade according to the volume
or weight in Table 9 we can conclude observe that in
some periods the monetary value of the exports have been
increased almost 8 times but in weight basis it has
i n c r e a s e d 6 times which can be due to the i n c r e a s e in p r i c e s and/or the c onte nt o f the e x p o r t s .
(Table 9)Trend of trade of Turkey with Iran on weiglit basis in selected years
Years Imports From
Turkey(tons)
% Change Non-Oil Exports To Turkey(tons) % Change 1979 20369 — 101 — 1980 119024 484.3 57 -43.6 1981 464038 289.9 97 70.6 1982 1029473 121.8 165 70.1 1983 845334 -17.9 443 168.5 1884 694773 -17.8 16369 3595.0 1985 1666211 139.8 6658 -85.3 1986 1054472 -36.7 7286 8.4 1987 1080147 2.4 33799 383.9 1988 712694 -34.0 19591 -42.0
Source :i.G.M.Trade Statistics 1980-88
In non oil exports to Turkey for example in 1884 the weight of the exports increased 37 times, but the monetary value
when compared to the previous years had increased only 3
times from which we can conclude that there exists changes either in composition of goods or prices, or the quality was
lowered.
If we look at the import and export trends we can observe the negative growth rate in the imports of goods from Turkey
in 1976 to 1979 which was due to the previous governments
inclination towards importing goods from Japan and 6 otlier
industrial western countries,but as it can be observed from
graph 4 there started to be a positive growth in the trend of imports from Turkey and the maximum amount of imports of
$1087.7 millions, but this trend again started to decline. In analyzing the exports of Iran to Turkey as it can be observed from table 10 the maximum level of exports before 1980 was in 1978 with $488.5 millions. After the revolution due to the new governments policies in expanding the exports it increased to $1565.7 millions in 1984 but it again dropped to $492.4 millions in 1990. These changes might be due to
the increased domestic demand of Iran after the Iran-Iraq
war.
Table 10
TliFfE i'? TRADE «1TH IRAN
H!lL10NS ÜF ÜE, i
Ï!N TOTAL TRADE
TEAR IMPORT VDL'JflE OF TURr.Er
li?6 I'jR .i 33.6 143.0 4. r IR?7 4 8 ,c 213.6 2r5 I?70 486.5 44.7 533.Z 7.7 iR ’ r 175.9 11.3 187.7 2.C 1R60 6v2.5 54.3 887.3 8.2 1R61 514.5 233,7 748.5 C 1 1982 747.7 791.1 1538.8 1 0 .! 196!· II'DI’ .I 1087.7 2309.B 1!..4 196T 1565,7 751.1 2316.7 12. 19SD 1264.7 1078.9 2343.5 12.1 1986 221,3 564.4 785.7 1=87 947.6 439.7 1367.3 7 19S8 659.6 545.6 1205.4 4 .t 19S9 233.5 561,0 794.5 2.9 1990 492.4 495,5 9 :7 .9 2.S
Again by looking at table 9 and Graph 4 we can observe that during 1971 to 1978 the Turkey's exports to Iran increased
4 times ,but from 1978 to 1988 it increased 18.5 times
and the weight of goods also increased 11 times. This
shows that Iran which was importing most of
its industrial goods from either U.S. or Western Europe is now ,due to the political and other reasons discussed in chapter 6
, willing to obtain them from Turkey which again shows an
5.COMPOSITION QE THE TRADED GOODS 5.1.Goods Imported From Turkey
As it can be observed from the table 12 there exists no
important change in the composition of the goods imported
from Turkey after the 1979 revolution. The most important
change in the composition of the goods can be considered as
the increase in the variety of the goods imported after the
revolution from Turkey. The next important fact that can be
noticed is that the import of some chapters (list of
chapters, Appendix) is quite random and irregular(Table 12), For example chapter 1 (Live animals) which was once imported
in 1981, was imported again from Turkey in 1983 and from
that date on it has not been imported by Iran again. Here it can be concluded that these needs are acquired from some other source.
By looking at table 12 we can conclude that the imports
acquired from Turkey provide an important portion of
the goods and materials which are used in Chemical,
Pharmaceutical, Auto, Tractor, construction and Textile
industries which compromise the important industries, here
we can conclude that if Turkey can cope with the
competitors in these industries such as Japan, Germany,
Italy, Canada, and France ,large volumes of these goods
will still be required by Iran since it is dealing with
reconstructing the ruins and damages of the war. 28
5.2.Goods Exported To Turkey 5.2.1.Mineral Fuels
By looking at Table 11 we can observe that if we consider
(Table ll)Turkey's Imported oil and The % provided By Iran
YEARS TONS % Provided by Iran
76 11213187 11.50 77 11658768 15.29 78 10354381 49.08 79 8173202 17.62 80 10490158 30.14 81 11579743 16.32 82 13905837 23.33 83 14161786 40.51 84 15589831 47.37 85 15531897 38.03 86 16861924 11.11 87 20102220 33.22 88 21739799 25.10 89 18583831 9.54 90 19842247 16.37 Source:iGM,TRADE STATISTICS (1976-1990)
only the period after 1979 there has been an
increase up to 1985 at which due to the decline in the price of oil and contradictions in determining the new price and pricing methods the total value of exported crude oil dropped 5.7 times.If we look at the total percentage of Iran
in providing the oil used by Turkey we can observe that in
1984 almost 50% of the total oil bought by Turkey was from Iran, but this has dropped to 16.37% in 1990.
The total annual consumption of oil in Turkey is 17-18
So the rest of the needs (15-16 million tons) is provided by other countries such as Iraq, Libya, Saudi Arabia and Iran .
In energy sector there has occurred expansions in relations for example in 1984 a treaty was signed on laying an oil and natural gas pipelines. The problem is that many of the development projects under discussion in Iran are purely
theoretical since the resources are lacking for their
implementation. The Iran-Europe natural gas line falls into
this category. However, the project has some support from
those who argue that natural gas exports would help
diversifying Iran's foreign exchange sources away from oil.
Bilateral talks on the proposed line with Turkey,
Yugoslavia, Greece and others are continuing, though it is
not yet apparent who will fund this project. In addition to Turkey, U.S.S.R and Czechoslovakia and Greece have agreed to play a role in Iranian gas export plan.
Iran is anxious to emphasize its enormous potential in
natural gas supply and is seeking to position itself to
claim a large share of the European gas market and thereby open up a new source of foreign exchange earnings. If this line is laid there exists large potentials in providing the oil and gas requirements oif Turkey.
Here it should be noted that most of Iran's Purchases from
Turkey is according to the amount of oil sold and it is not in cash. Barter trade makes it easier for the countries to
perform the deals and this is also one of the major
reasons of the expansion of trade between Turkey and Iran. The major reasons that this type of trade makes the
deals feasible are as follows : Counter trade makes it
easy for both countries who have due to different reasons shortage of foreign exchange to continue their trade and the developing countries including Turkey and Iran are generally exporters of raw materials and their prices are usually kept
low by international cartels . So counter trade makes it
possible for trading countries to be affected much less by cartels.(Mustafa BATIER,Karsilikli Ticaret,1989)
5.2.2.Non-oil Products
As it can be observed from table 12 in the next section in the Iran's exports to Turkey most of the goods are vegetables or plants and rarely industrial products or semi finished goods.
The important goods exported to Turkey are ; Metals,
chemicals, Leathers and skins which consist the semi-
processed goods and Dried fruits,Biscuits and Chocolates and Textiles and Carpets.
By looking at the table 12 we can observe that there is no regularity and order in the composition of exported goods of
Iran to Turkey, for example chapters 55, 2 3 , 40 and 76
which are staple fibers, inorganic chemicals, rubber, and
aluminum have been exported to Turkey only once in the
last 15 years.
When comparing the exports of Iran to Turkey after the revolution with the period of pre-revolution(1979)we can see
an improvement in the sense that the variety of the goods
have increased.This shows that Iran has also the capacity to provide a portion other than oil requirement of Turkey. The potential areas of export are chapters with continuous
demands such as edible vegetables, edible fruits, salt,
mineral fuels, raw hides and skins, ceramic products, and
vehicles which were demanded since 1979 and ores, inorganic
chemicals, rubber, wadding, aluminum, machinery, and
optical devices which their exports have started after 1979
5.3.ANALYSIS OF TRADED ITEMS
5.3.1.Turkey's Imports From Iran
As it can be observed from table 12 and List of Chapters
in the Appendix the most important items exported are edible
vegetables, fruits, gums and resins, salt, mineral fuels,
inorganic chemicals, organic chemicals, miscellaneous chemical products, rubber, raw hides and skins, wool and animal hair, man made filaments, staple fibers, wadding, ceramic products,
articles of iron and steel , copper, aluminum, machinery,
and vehicles.
In the analysis those chapters are analyzed which either consist one of the important exports or imports of the other
country or it is imported or exported regularly and amounts
more than $50,000 as a reference.
Edible vegetables has been imported from Iran since 1985 and
there has been a lot of variations since then. As it can be
observed in 1988 a 97% drop,in 1989 a 5800% increase and again in 1990 a 78% drop has happened. This shows that even though a market exists for those items, either necessary activities
are not performed or Turkish market is switching to other
sources.
Edible fruits has been imported since 1987 and until 1889 it
which again raised 7183% in 1990.Here we can conclude that
these items have a good market in Turkey.
It should be noted that since this chapter is consisted of
fruits it is extremely dependent on that periods climate in
both countries.
Gums and resins has been imported only twice during the last
15 years and this shows that either it has been substituted by domestic products or the item is imported from other countries.
This shows that this can be a potential item as long as it
is competitive.
Salt and stones is one of those items whose imports by Turkey from Iran has started after the revolution and it has been imported regularly. It can be noticed that 0.4% of Turkey's
needs of this item was procured from Iran in 1986 while it
changed to 0.25%, 0.76, 0.53% and 0.71% in 1987,1988,1989 and 1990 respectively.
Here we can directly conclude that Turkey is procuring its needs and requirements from some other countries either due to lower price, higher quality or exchange rates. This item can also be a potential area for increasing the trade volume if the item is competitive.
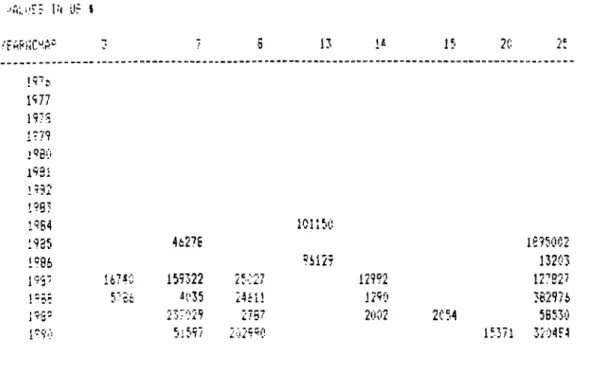
Table 12:Turkey's Imports From Iran (^) .'HLi’ir !■'< Ur » U 1? 20 !^·?. Ti77 19/i 1??? 2^60 199: ).992 1995 1954 101150 1935 4627£ 1£?5002 1905 51125 13203 19';- U75C 155322 25:27 12992 127927 !-53 J('35 2411! 1290 362576 190- ¿o.'?x9 ¿iB·· 2002 2C54 58530 5:597 2029^0 15371 3204F4
Ores and ashes has not been exported to Turkey regularly which
means that it is provided by some other countries rather than
Iran. In 1985 $2146547 was exported to Turkey while it dropped to $ 878932 in 1986 where total imports of that chapter was $66 million which means that 1.33% of total imports was provided by Iran and in 1988 with $703610 Iran provided only 0.8% of Turkey's need.
Mineral fuels has been exported by Iran quite regularly and as it can be observed in 1986 11% of imports of this item was purchased from Iran and the rest from other countries, whereas this percentage changed to 32% in 1987, 24.35 in 1988, 8.5% in 1989 and 12.75% in 1990.This shows that a lot of switching was
done by Turkey from one oil producing country to the other. As it can be observed in the last 5 years the maximum percent was
32% in 1987 and the minimum was 8.5% in 1989. Here it can be
concluded that there is a lot of oapacity and need which makes it possible to increase the volume of trade between Turkey and Iran by Increasing the volume of imported oil from this country,
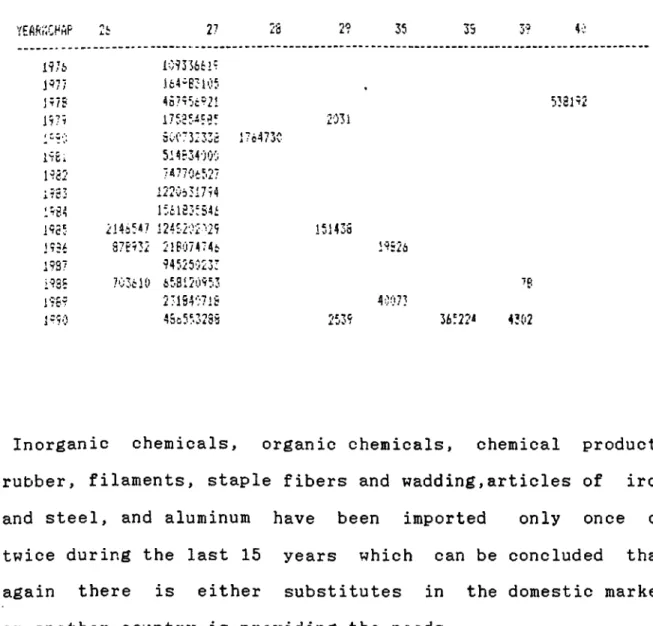
Table 12 Continued YEAfti',CHHp 27 2S 2? 35 35 3? M I 9 7 i 109336i2P i^li .l64'B3i'55 ¡575 4b755c521 1577 I7535.45if 1“5·;; 500:^3:335 ¡'¿ 4730 l5Ci 514534000 1582 7<770i527 i?S 3 1220631754 1554 l:,clS3f541 1553 214i54? 124;-202'25 ¡ i 5 f 375'532 2 !B 0 7 4 '4 t 1937 945250233 >935 ?03cl0 ¿53120953 r?S9 231S4071S 1=50 45c553238 2031 15143S 19526 538192 7ti 40073 2539 3652?! 4302
Inorganic chemicals, organic chemicals, chemical products
rubber, filaments, staple fibers and wadding,articles of iron
and steel, and aluminum have been imported only once or
twice during the last 15 years which can be concluded that
again there is either substitutes in the domestic market
or another country is providing the needs.
If we analyze raw hides from 1986 on we can observe that
1.2% of the total purchases in 1986 and 0.81%,0.2% ,0.4% ,and
0.8% in 1987,1988,1989 and 1990 respectively was from Iran which shows that there is a capacity for this item to at least
increase its share.
Wool and hair has been imported by Turkey from Iran only in 1988 which consisted 0.05% of the total imports of that item.
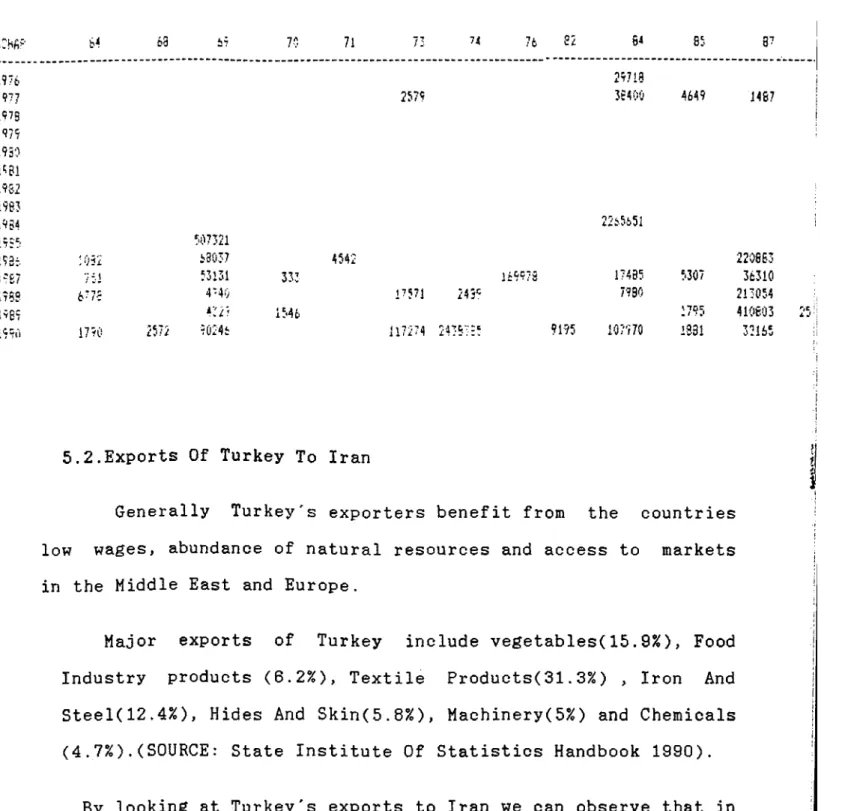
Table 12 Continued r-CH-·"· 4i !9’’o 19';' l'?7B !9'9 1®50 l^Sl 19S2 1420079 1954 1439^27 19?3. 8S3Mi 19S6 1134529 19E7 1710650 1966 251152 1989 6?9Bi' 1990 2015129 '90jei3 J016MO B0763? M l 94 1697 3:193 144i59 30140 239E
Ceramic products has been imported since 1985 in a regular basis and eventhough it shows a decrease from $507321 to
$4329 in the first six years there is an increase to
$90246 in 1990 which shows there exists a potential for increase in trade of this item. If we analyze this item in
more detail and compare this with the volume imported
by Turkey we can observe a lot of oscilations in the
percentage procured from Iran. In 1986 0.07%, in 1987 0.04%,
in 1988 and 1989 almost none and in 1990 0.05% was imported
from Iran from which we can conclude as very low capacity of Iran or as the low quality of the products.
Iron, steel and copper were not imported regularly but in
1990 a considerable amount has been imported from Iran
which shows that this can be a high potential area for trade
if there is the capacity for increasing both the volume
and quality of the product.
Machinery is one of those chapters whose import by Turkey is
quite irregular. It has been imported in 1976 and 1977 then
its import has stopped, again in 1984 she imported almost
$2.6 million and it again dropped to zero and thereafter it
consisted almost none of Turkeys import of this chapter.
We can conclude that this chapter is imported from
technologically more improved countries and these can not
be competitive as long as low quality of production and
technology is employed.
Table 12 Continued r-iwHhP i ¿9 7? 71 / J 74 I t 52 84 85 8^ 197t. 2^79 29718 36A00 4649 H 6 7 ii7B )97y 1950 I'iBi 1982 1963 1954 193:· H 5 7 1959 1969 i99n 22i.5b5i I 507321 ;i)52 ¿3037 m : 2208B3 751 53131 333 1699/S 17485 5307 3t310 6 ‘ 7c 4 ‘ 40 P 5 ? l 7790 213054 43/? 1795 410803 •"iCJ.j'\ ; 1770 2572 9Ö246 m m 243S':55 9195 10?'? 70 1891 33165 ! i
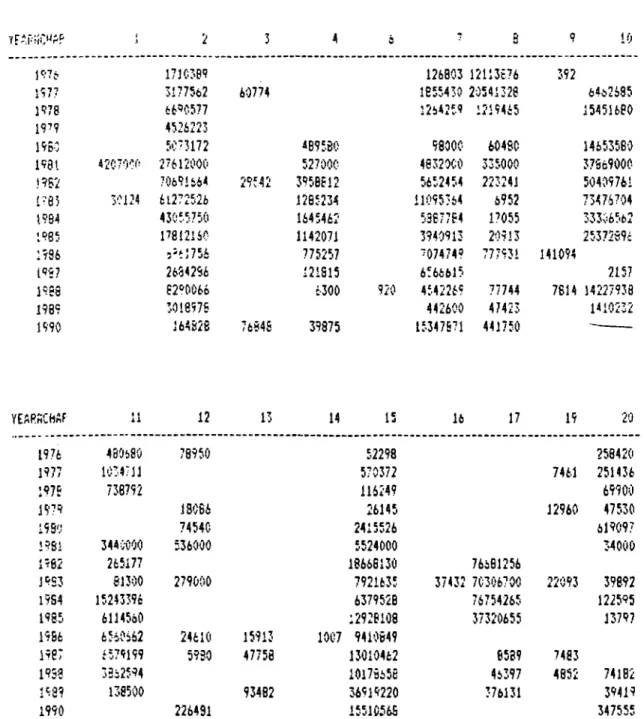
5.2.Exports Of Turkey To Iran
Generally Turkey's exporters benefit from the countries low wages, abundance of natural resources and access to markets in the Middle East and Europe.
Major exports of Turkey include vegetables(15.9%), Food Industry products (6.2%), Textile Products(31.3%) , Iron And Steel(12.4%), Hides And Skin(5.8%), Machinery(5%) and Chemicals (4.7%).(SOURCE: State Institute Of Statistics Handbook 1990).
By looking at Turkey's exports to Iran we can observe that in addition to these items after the Iran's revolution almost all of the chapters have been exported to Iran at least once.
As it can be observed from the table 13 the trend of exports is not constant and it varies a lot during the years. There are
some items such as live animals which have been exported in a
large amounts but their exports have stopped. These might be items that may be highly potential for export to Iran, since the high volume shows thast there is the need for those items. We can conclude that these are imported by Iran from some other countries.
There are also items such as meat and edible meat offal whose exports vary considerably eventhough it has been exported
continuously. For example its export had reached to $70
billions in 1982 and it has dropped to almost $ 165000 ,
such items also can be considered as potential items for
export to Iran.
As it can be observed most of the items have been exported to
Iran by Turkey , eventhough some of them are in quite small
amounts or have been exported once or twice we can conclude
that as long as the quality and price of Turkish products are
competitive with other country origin products Iran is a
lucrative market for them.
Table 13.Turkey's Exports To Iran On Chapter Basis •¿! i;E5 !N j 2 3 4 6 7 B 9 10 173CT«B9 126803 12113676 392 1977 3177562 60774 1855430 20541328 64*2685 1978 i6=iC577 1264254 1215465 15451680 19^9 4526223 19B0 5C'3172 iB95BC 58000 60480 14653580 1981 27612000 527000 4832000 335000 37S6500C m 2 7069I664 29542 3B5BB12 5652454 22324J 50405761 l- 8 i 'y : i2 4 61272526 12B5234 11055364 6552 73476704 1 9 9 4 43055750 1645462 5387784 17055 33306562 1 9 6 5 17812160 1142071 3940913 20913 2537285c 1 9 9 6 5-61756 775257 707474? 777531 141054 i 9 'i? 2654296 121S15 6566615 2157 1983 E2'^Ci066 6300 920 4542265 77744 7614 14227538 1989 30ie'>76 442600 47423 1410232 1990 164S26 76S4S 39875 15347S71 441750 ---YEARiJCdAf 11 12 13 14 15 16 17 15 20 1976 480680 78950 52298 258420 1977 1034?11 570372 7461 251436 157B 738752 116249 65900 1579 1SC66 26145 12960 47530 1550 7454G 2415526 61909? 1581 3440000 536000 5524000 34000 1582 265177 18666130 76661256 J5S3 81300 279000 7921635 37432 70306700 22053 39892 1984 15243356 637952B 76754265 122555 1985 6114560 12528108 37320655 1375? 1586 6560662 24610 15913 1007 5410649 1587 6575155 5930 47758 13010462 8585 7483 1533 3362594 10173658 46397 4852 74182 1589 138500 53482 36515220 376131 35419 1990 226491 15510565 347555
ѴЕГіі'.ІіГ'іііР· :·ι '¿i T! 'ή 3(! ш ь 716 3435971 7444 212470 42916 m í 79303 3500 396189 117272 1'У?8 636720 155500 Ï W 33.4395 7500 iVÜ!0 4 597 8 2840700 5166286 2290035 8080385 39933 ífS l 2170Û0 5173000 228000 4577000 9446000 201000 .1932 85860 4267113 20245 4079867 17611870 3367387 Í9S3 139B24 272940 2412272 30040 39597 6439104 18203089 4708039 1.98i 4145 78449(1 '■ 1374766 30691272 5487004 11045370 933963 198? 1075363 23822077 6435538 11983956 505946 198:·. 4БЗЗ? 521201 22669 13171591 26875014 1932393 İ9E7 109671 261291 285975 349933 12343660 17222080 1245043 19B8 550000 340154 22300154 19255941 27884704 6459735 1989 2200526 И6Ѳ40 24205726 12446875 38225047 7731091 1990 367285 25880 14354431 29724550 6405SB 'líCHÍf 31 γ . 33 34 35 36 37 36 39 19 7¿ 42979 351942 202186 197? 14106 15950 76493 951396 139628 1978 37846 136966? 15502 1979 3100 667336 198C 546524 12511 1290004 536678 193!. 4/4000 1Θ4000 5467000 50000 193S000 1613000 19Ô2 i ce1 к·. J 1144907 120000 13761064 394050 9S55 3464155 13407585 196·? 229 2119866 297Β29 7259718 79Β065 8079230 21718968 198‘) 17 1414070 6179637 722648 1357715 7667092 19S3 2:7491731 764776 3986945 70825 46156 4152015 8752900 т ь 46730973 S66ÊB2 305207 23418 3710689 І2В33014 1?В7 39677450 2292302 416584 1542S407 70390 4568174 14954144 1988 106462516 592772 İ2354Ö2 4977721 511400 7245479 15451766 19B9 Б0В67994 1664Β73 799008 1404126 805473 7484 10846655 29035926 199CI 11221734 1620136 903160 1338461 931701 3000 305832 30761918
YEARÍíCHftP « 41 42 44 43 49 50 51 1976 33600 111280 6 Ш 1 816 55399 1.977 3054B 65760 8379 1978 181486 85325 87177 1249790 1979 857241 193826 481965 I960 5877371 67002 228239 390910 481328 1931 16074000 7359000 1153000 1749000 1932 7396615 1858861 6054876 615000 3609755В 1933 1766S3S1 35836 19573139 9504677 2835 45626471 1984 26906803 1179143 19951 8845595 130Z5İ42 292454 26898494 1985 15819360 1660922 4190 7665776 540 9524807 26901082 1986 8379895 526778 4694768 7732042 386024 17561597 1907 5019711 1368200 5286906 12510492 1986 2606546 141273 3448425 249 28226908 1989 0131766 86557 1150069 5375989 62440 3760101 1990 4556718 319478 29340 2286522 2985 22518738 147993 'ñCHílP 52 53 54 55 56 57 58 59 60 1976 6608717 340669 56B6B 42000 1977 32484 4259565 374202 17171 97375 1978 3179575 417091 36200 509109 1979 213323 . 333050 198Ö 126108 73605 9195855 Z5633 136857? 1931 2615000 4565000 18124000 203000 1664000 22000 1932 5373247 33409 32710770 55302576 84604 29405 1213732 1993 21609995 51165129 1.21E+08 192503 6075739 1395316 1984 2986736 18423166 75464737 950065 2889744 10799 19Б5 1406932 16514033 Ι.ΟδΕ+08 193024 5091614 1403723 268696 1986 1244001 12050522 55558451 3Ϊ693 1746725 665610 5450 19S? 2661723 2906836 15713458 1053533 ttOOiO 1988 2727598 182798 159772A0 130551 4883 94660 1989 596875 28667058 91484 78495 37397981 1990 90227 630656 29581557 472543 61831 358970 31887546 35024
líEfiRÍXHAP él Ь2 сЗ 64 ьь ¿B 6·? 70 71 1976 68690 1202181 2735 1977 91731 2319663 1973 96079 74989 4023175 1979 1756202 1980 203400 295955 1130302 2219141 Î9B1 62000 137000 456000 1392000 10466000 1932 215925 2050384 1104105 501672 579300 13638936 1933 119566 1292427 436080В 1201996 352804 18467523 1984 22477 223343 100094 1337427 1299443 1437836.5 1965 Í3083 3141537 16.27104 513074 13592414 1986 140225 1653464 542230 568785 12537900 1987 12124 5160019 10500 341716 285551 7913304 1989 23306 2791509 37100 85505 611864 762S607 1989 1154 25099 1767635 156418 827226 8399239 1990 113856 I2B405 4690965 677840 71569 13127989 7807 OiCHfif 72 73 74 76 78 79 80 SI 82 1976 1202540 1398119 17809 1977 159371 1076385 9862? 1978 500463 246059 371? 1979 535600 204128 19Б0 2800976 822929 ■644020 1961 14235000 26000 2013000 2БО6000 1982 224742427 4676597 6203037 51900 400342 1903 2B7931773 24983335 20511227 146688 53600 594541 19B4 181679058 66Б6519 15756972 4710 332911 1965 507149396 20669432 8754284 1619466 741821 1966 219501042 22794997 7459569 5201234 732465 1967 207032560 701075 769915 116250 1146053 318520 19B6 176615772 360812 3981281 244730 6169 175935 1989 160078202 20018341 68757 368026 780710 1990 175049103 27472775 71473 2739800 9549Θ
YEßRf'.CHfiP 83 84 85 86 87 90 91 92 94 i 976 4783 2751877 107613 136956 197? 33786 2829161 75531 64152 3611 1978 107929 1990149 232809 101390 1979 39312 538833 560967 7664 19B0 626596 8743377 ,3711009 1304219 5424 19B1 19300ÚC 19457000 7091000 2634000 10000 1982 4227326 31947Ш 309276.36 27582964 3745000 1983 5693798 29560139 24122952 73225796 7580 3947 1984 956772 20302354 22254984 54095296 12063 450000 1963 5074266 22505221 227791B7 69870917 776541 8303667 12800 1906 24S9677 15106644 10515130 10167459 705007 1555000 35172 1967 750620 9921852 13934091 1747774 3336542 142931 52254 1936 784853 20399556 8673786 110500 12267930 1691691 5908 849470 5517 1989 656264 Б612951 17337266. 1047400 742416 18057 10396 1990 570113 3974040 446Û6282 2929072 594159 26700 24315 iTtlRiiCHfiP 96 97 98 TOTftL 1976 1495 1650 223419 33573759 1977 63834 171747 47630738 1978 43270 375545 44748199 1979 445350 11815735 I960 96900 1429314 86406195 19S1 26090 2939000 2.34E+0B 1962 3315109 7,9iE+0B 19B3 33233 2792658 1.09Et09 1964 3104 2266160 7.51E+08 1985 14773 1390809 1.Û3E+09 19S6 10923 7655 3160508 5.64E+0B 1987 76499 960538 4.4Ε+0Θ i9se. 402405 5,46E+08 1989 1875232 5.61E+0B 199(1 453753 4.95E+C8
6.REASONS AND MOTIVES FOR THE EXPANSION OF TRADE BETWEEN TURKEY AND IRAN
6.1.Political Reasons
6.1.1.Policy Of Iran With Respect To 3rd World Countries
The Iranian government's emphasis is on the need for independence from the outside world, a rejection of any
modernization that merely imitates western fashion, and a
re-structuring of ownership of assets. For this reason it is willing to cooperate in political, economical, technical and cultural aspects with developing countries and specially with Islamic ones.
Iran believes that by cooperating, both countries can
produce their requirements through cheaper means (Labor and Capital) which will be beneficial for both parties. This is one of the motives of Iran to try to expand relations with Turkey.
6.1.2.Positioning Of Turkey During The Economic Embargo Of Iran and Iran-Iraq War
After the revolution due to the stagnation in production
activities ,labor problems and lack of raw materials in Iran the GNP of Iran dropped and government started applying short term policies such as importing raw material and other necessary goods to keep the industries survive. In the same
countries which were the trade partners of I ran started applying an economic embargo on Iran in which Turkey did not take part.
This had a very important effect on the improvement of political relations and expansion of trade. This can be observed in the table 14 , as it can be observed in 1981 which was coincident with Iran-Iraq war the total volume of trade suddenly raised from $748.5 millions to $1538.8 millions in 1982, this trend was continued until 1985 when the total volume of trade amounted $2343.5 million.
Table 14. Turkey's Trade With Iran In millions of $U.S . Year Total Volume of Trade(Both Import And Export)
1978 533.2 1979 187.7 1980 887.3 1981 748.5 1982 1538.8 1983 2309.8 1984 2316.7 1985 2343.5
Source: State Institute of Statistics,1990,Handbook,Turkey
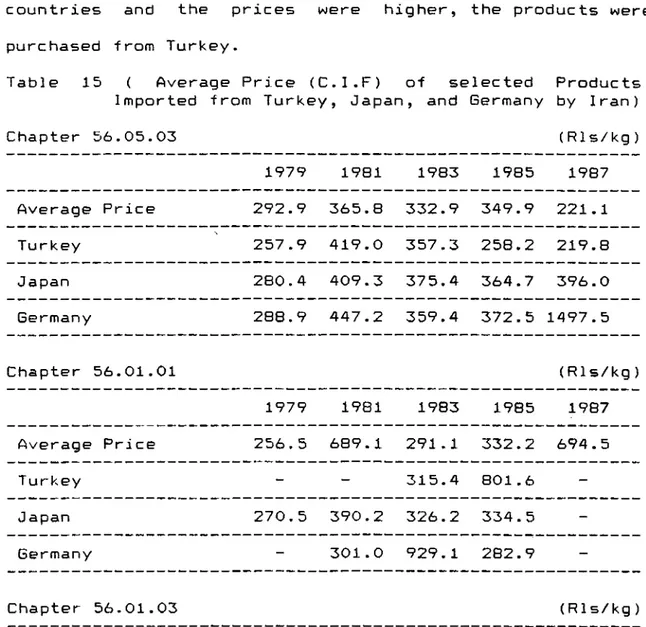
The importance of this factor can be observed more clearly if we look at the price and quality of some of the goods purchased from Turkey and compare them with that of some other countries. For example, chapter 56 (Wadding and non-wovens) have been exported to Iran in large amounts by Turkey. If we compare the quality and price of this items with that of Germany and Japan (Table 15) we can observe that eventhough the quality was lower than that of other two