Full Terms & Conditions of access and use can be found at
http://www.tandfonline.com/action/journalInformation?journalCode=mree20
Download by: [Bilkent University] Date: 29 December 2015, At: 04:54
Emerging Markets Finance and Trade
ISSN: 1540-496X (Print) 1558-0938 (Online) Journal homepage: http://www.tandfonline.com/loi/mree20
The Effect of News on Return Volatility and
Volatility Persistence: The Turkish Economy during
Crisis
M. Nihat Solakoglu & Nazmi Demir
To cite this article: M. Nihat Solakoglu & Nazmi Demir (2014) The Effect of News on Return
Volatility and Volatility Persistence: The Turkish Economy during Crisis, Emerging Markets Finance and Trade, 50:6, 249-263, DOI: 10.1080/1540496X.2014.1013864
To link to this article: http://dx.doi.org/10.1080/1540496X.2014.1013864
Published online: 08 Apr 2015.
Submit your article to this journal
Article views: 16
View related articles
View Crossmark data
Emerging Markets Finance & Trade / November–December 2014, Vol. 50, No. 6, pp. 249–263. © 2014 Taylor & Francis Group, LLC. All rights reserved. Permissions: www.copyright.com
ISSN 1540–496X (print) /ISSN 1558–0938 (online) DOI: 10.1080/1540496X.2014.1013864
Volatility Persistence: The Turkish Economy
During Crisis
M. Nihat Solakoglu and Nazmi Demir
ABSTRACT: In this study, we investigate the effect of public information arrival on return
volatility for Borsa Istanbul. New information arrival is measured by the number of daily news headlines for Turkey, the United States, and a sample of European countries with close trading ties with Turkey. We classify news headlines by country and type of news. Our findings indicate that, during a recessionary period, new information arrival causes return volatility mostly to decline. Moreover, both economic news and European news cause a significant decline in volatility persistence. However, when news is classified based on origin and type, a larger decline in persistence is observed.
KEY WORDS: news arrival, return volatility, Turkey, volatility persistence.
The effect of public information arrivals on asset prices and volatility has been investigated extensively in the past by researchers using different information arrival proxies. One strand of studies uses macroeconomic announcements to measure information arrivals and examine the effect on returns and return volatility (Almeida et al. 1998; Andersen and Bollerslev 1998; Ederington and Lee 1993; Kutan and Aksoy 2004a; Pearce and Roley 1985; Pearce and Solakoglu 2007). Another strand of studies focuses on trading volume as a measure of information arrival (Andersen 1996; Bollerslev and Domowitz 1993; Lamoureux and Lastrapes 1990; Locke and Sayers 1993).1 The last line of stud-ies measures new information arrival by the frequency of public news that arrives to the market. For the frequency of news, these studies use either the number of news reports obtained from newspapers (Berry and Howe 1994) or the number of news headlines released by companies that provide data services, such as Dow Jones & Company and Reuters (Baklaci et al. 2011; Chang and Taylor 2003; Janssen 2004; Kalev et al. 2004; Mitchell and Mulherin 1994).
We follow this last line of research by measuring information arrival via the daily number of news headlines provided by Foreks Data Terminal for the seven-month period September 1, 2008–March 31, 2009. Our aim is to investigate the effect of public infor-mation arrival on return volatility in Borsa Istanbul (BIST).2 We believe this study differs from earlier studies on two fronts. First, we distinguish different types of economic news and different sources of news in our analysis. For different types of economic news, we use two classifications: news on real economy and news on inflation/money. For the classification of news sources, we differentiate among news originating from Turkey, the United States, and a subsegment of Europe that includes France, Germany, Italy, Spain,
M. Nihat Solakoglu ([email protected]), corresponding author, is an Associate Professor of Economics in the Department of Banking and Finance at Bilkent University, Bilkent, Ankara, Turkey. Nazmi Demir ([email protected]) is an Assistant Professor of Economics in the Depart-ment of Banking and Finance at Bilkent University, Bilkent, Ankara, Turkey. The authors thank three anonymous referees for helpful comments.
250 Emerging Markets Finance & Trade
and the United Kingdom (which we call Europe in this study).3 Second, we compare the actual announcements to expectations and classify each news headline as a positive surprise, a negative surprise, or neutral. If markets are efficient, we should not find any relationship between the anticipated arrivals of news and return volatility, but we should observe a significant effect of unanticipated news arrivals on return volatility.4
Our findings show that return volatility is mostly declined by the arrival of news. Moreover, while we find that European and U.S. news on both real economy and infla-tion cause a large decline in volatility persistence, Turkish news on inflainfla-tion, but not on real economy, leads to a decline in volatility persistence. Although the slowdown of the aggregate demands abroad and particularly in Europe hurt the Turkish trade balance and reduced its capital inflows during our sample period, Turkish investors/traders were not affected profoundly by the chain of events during the crisis years. This may be because both the Turkish government and news media downplayed the economic crisis abroad because the Turkish economy and particularly the financial sector, including the banking industry, were robust following the restructuring after the Turkish crisis of 2001. These actions, along with increased information disclosure, may be one reason why news arrival reduced return volatility.
Model Specification and Data
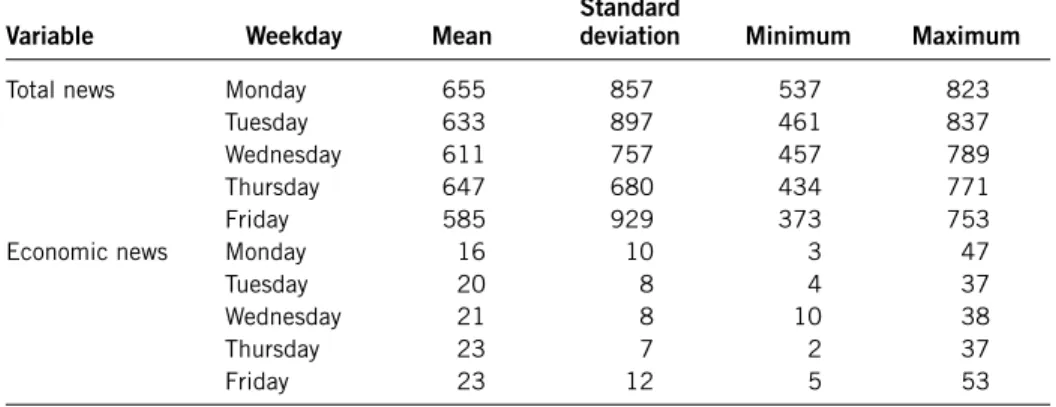
We use the daily number of all news headlines provided by Foreks Data Terminal to proxy new information arrival.5 We employ the standard model and use the number of daily news headlines (mostly utilizing the economic news) as our proxy for information arrival. News coverage only includes the weekdays, and hence there are no data available for weekends. Data on BIST100 and sectoral indexes are obtained from Matriks Data Terminal.6 Table 1 provides descriptive statistics on new information arrival by weekdays.7
Except for Fridays, the average daily number of news headlines stays above 600. The minimum number of daily news headlines is 373; the maximum is 837; and the overall average is 627. The highest number of news headlines arrives on Monday, as expected, with the lowest on Friday. An F-test of a null hypothesis of equality of all mean numbers of headlines for weekdays is rejected at the 1 percent level of significance. Moreover, the application of Tukey’s honestly significant difference (HSD) test indicates that news arrival rates are significantly different from each other when comparing Monday and Friday only.
Although the average number of total news headlines is 627, the average number of economic news headlines is much smaller: 20.5 news items per day. In other words, only about one out of thirty news headlines is on economic news; investors must thus observe a flow of information and pick the relevant news to analyze and take action. With a correla-tion coefficient of 0.34, the total number of news headlines and the number of economic news headlines do not move together. Hence, we can assume that only informed traders, traders who have access to timely and accurate public information, are able to distinguish important news from the rest. If the market is controlled by informed investors/traders, then we should expect only surprise economic news to affect market volatility. Table 1 also presents the average number of daily economic news headlines by weekday, with a minimum of two and a maximum of fifty-three news headlines per day. The lowest number of economic news arrivals occurs, on average, on Mondays, while the highest numbers occur on Thursdays and Fridays. Furthermore, Tukey’s HSD test indicates a significant difference only between Monday and Thursday.
Since most of the news arriving in a day may not be relevant for investors, we separate economic news from all news and classify all economic news as (1) news on real economy, (2) news on inflation, or (3) other news. We exclude “other news” from the analysis as it includes news that may not be relevant a priori or news consisting of mixed signals.8 Furthermore, in segments (1) and (2), we classify news as a positive surprise, a negative surprise, or no surprise as the direction of the surprise may provide different signals for investors. Panel A of Table 2 provides summary statistics for the number of headlines under different segments of economic news.
As is clear from Table 2, most of the news is on the real economy, with an average of 10.3 news headlines per day. Moreover, as expected given the economic environment, we observe more bad news than good news on the real economy, with an average of 5.6 bad news items per day compared to 3.7 good news items per day. For news on infla-tion, there is not a significant difference between positive and negative surprise headline counts. To identify the surprises, we compare actual announcements to the expectations provided by Foreks Data Terminal within the same news headline.9
Not all foreign news is expected to affect return volatility in Turkey. In particular, news items related to the Turkish economy, to a subset of European economies with close trade relationships with Turkey, and to the U.S. economy are expected to be more vital for the return volatility in Borsa Istanbul. For that reason, we classify news arrival according to the country where the news originated. The segments we consider for analysis are news on the U.S. economy, news on the Turkish economy, and news on the European countries of France, Germany, Italy, Spain, and the United Kingdom. Since most of the news on Europe clusters around these countries, and the business relationships are stronger with this group of countries, we assume that this generalization does not cause much loss of information. Summary statistics on news counts for the country segments are provided in Panel B of Table 2. On average, 2.6 news headlines per day are observed for the U.S. economy, while the average for Europe is around 6.9. The average number of economic news headlines for the Turkish economy is 0.2, much lower than we expected. With a maximum of two economic news headlines per day, this indicates that there are many days with no economic news reported on the Turkish economy. The list of news on real economy and inflation that we consider, with a sample of news headlines, is provided in Table 3.
Table 1. Descriptive statistics on daily news headlines
Variable Weekday Mean Standard deviation Minimum Maximum
Total news Monday 655 857 537 823
Tuesday 633 897 461 837
Wednesday 611 757 457 789
Thursday 647 680 434 771
Friday 585 929 373 753
Economic news Monday 16 10 3 47
Tuesday 20 8 4 37
Wednesday 21 8 10 38
Thursday 23 7 2 37
Friday 23 12 5 53
252 Emerging Markets Finance & Trade
To estimate market volatility, we use several market indexes from Borsa Istanbul. The objective of utilizing several index returns is to check the robustness of our results and to observe any differences among sectoral indexes. The main index we use is the BIST100 index, which represents the market portfolio of 100 listed companies on Borsa Istanbul. We also include the Second National Market Index of Turkey, which is established to promote trading in stocks of small- and medium-sized companies. This index also includes companies delisted from the national market of the Borsa Istanbul. To capture differences in the sectoral response to new information arrival, the following sectoral indexes are also included in the analysis: banks, financials, industrials, services, and technology. For all index levels, we use daily closing prices, obtained from Matriks Data Terminal.
To test the effect of information arrival on return volatility, we use the conditional vari-ance from a generalized autoregressive conditional heteroskedasticity (GARCH) process introduced by Bollerslev (1986) and Engle (1982). Under the mixture-of-distributions hypothesis (MDH), the arrival of new information drives the change in return volatility concurrently (Darrat et al. 2007; Kalev et al. 2004). Hence, when a proxy for new infor-mation arrival is included in the conditional variance equation, we expect most of the volatility persistence to disappear. Following Kalev et al. (2004), we estimate the model
Table 2. Economic news and news segments for France, Germany, Italy, Spain, and the United Kingdom
Mean Standard deviation Minimum Maximum
Panel A: News by category
All economic news 20.5 9.4 2 53
News on real economy 10.3 6.3 0 28
Stronger 3.7 3.2 0 18 As expected 1.0 1.3 0 6 Weaker 5.6 4.0 0 18 News on money/inflation 5.8 4.5 0 22 Higher 2.1 2.0 0 11 As expected 1.1 2.0 0 12 Lower 2.6 2.5 0 13 Other news 4.3 3.4 0 14
Panel B: News by origin News on U.S. economy
All news 2.6 2.6 0 11
News on real economy 2.0 2.1 0 11
News on money/inflation 0.5 1.2 0 5
News on eurozone economy
All news 6.9 4.9 0 20
News on real economy 4.5 4.0 0 15
News on money/inflation 2.4 3.1 0 15
News on Turkish economy
All news 0.2 0.6 0 2
News on real economy 0.1 0.4 0 2
News on money/inflation 0.1 0.4 0 2
Notes: Due to rounding, totals may deviate from the sum of subgroups. The list of economic news we use is provided in Table 3.
below for market return Ri,t, where the return is calculated as the change in the logarithm of the daily closing index level.10
Ri,t = µ + φ1 D1 + φ2 D2 + φ3 D3 + φ4 D4 + εt, where ε ~ N(0, σt2)
σt2 = α0 + α1 ε2t–1 + β σ2t–1 + Σ λj Njt.
(1)
Table 3. List of economic news
News on real economy
Retail sales Productivity (overall or sector
based) Continuing claims Manufacturing/service/
compound sector PMI (Purchasing Managers Index)
Capital expenditures Initial jobless claims Mortgage approvals Change in Industrial
Production Industrial new orders Construction approvals Key current economic state
index IFO business climate survey GDP growth Investor confidence index Existing home sales ISM (Institute for
Supply Management) manufacturing/
nonmanufacturing indicator
Leading indicators index Factory good orders
The growth of construction
expenditures Housing starts New motor vehicle sales Business confidence index Building permits Manufacturing shipments Factory orders Capacity utilization rate ZEW (Centre for European
Economic Research) survey indicator
Unemployment rate Consumer confidence index Employment change Manufacturing orders Fed manufacturing index
News on inflation
CPI (consumer price index)
growth Retail price index Change in import prices PPI (producer price index)
growth
ISM prices paid Change in GDP deflator Money supply growth Labor cost index Interest rates
Producer prices: output or input
Sample of news headlines
09:45:23 The unemployment rate in France for the second quarter is 7.6 percent (expected 7.5 percent; previous 7.6 percent)
13:00:14 Manufacturing orders in Germany decreased by 1.7 percent in July (expected +0.4 percent; previous –2.9 percent)
14:00:03 Bank of England left interest rates unchanged at 5.0 percent (expected 5.0 percent) 15:15:12 The private sector employment declined by 33,000 in the United States (expected
–30,000; previous –51,000)
Notes: The sample news is provided from September 4, 2008. The original news headlines were in Turkish. We have translated the sample from Turkish to English.
254 Emerging Markets Finance & Trade
In the mean equation, D1–D4 represent day dummies to capture the day-of-the-week effect. In the conditional variance equation, Njt denotes measures of new information
arrival at time t for measure j, and λj denotes the associated coefficients. If the new
infor-mation arrival is important, we expect λj to be statistically significant for the jth news
measure. Moreover, with the new information arrival, we expect a decline in volatility persistence, as defined by the sum of coefficient estimates α1 and β.
Results Discussion
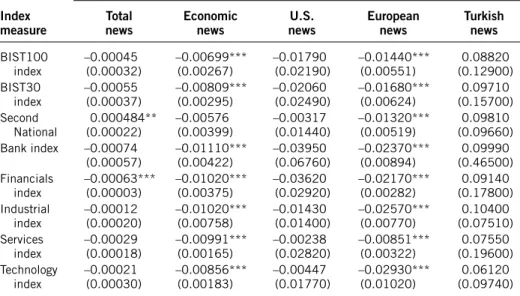
Estimation results for Equation (1) are presented in Table 4. The new information arrival is measured by using several different proxies, and market return is represented by several market indexes. To save space, we present only the coefficient estimates on new information proxies. Except for financial and Second National indexes, the total news does not influence return volatility significantly. With economic news used as our proxy, our findings show a decline in return volatility for most indexes. This result is puzzling as many of the earlier empirical works find news arrival causes the return volatility to increase (see, for example, Janssen 2004; Kalev et al. 2004). However, as Kutan and Aksoy (2004a) find, both lagged tourism announcements and gross national product (GNP) news influence return volatility negatively in Borsa Istanbul. Similarly, for the gold market returns in Turkey, Kutan and Aksoy (2004b) show that the volatility of returns declines in response to public news on industrial production. Moreover, for both bearish and bullish periods, Baklaci et al. (2011) provide some evidence that return volatility declines in response to news for several firms. Therefore, our results, although surprising, are not inconsistent with some of the earlier works that use data from Borsa Istanbul. Further, we use the number of total news headlines for the period January 2, 2013–May 31, 2013 and estimate Equation (1) with the total news as our proxy. The coefficient on news proxy is positive and insignificant for all indexes.11 As a theoretical explanation for the negative effect of news arrival on return volatility, it can be argued that news arrival reduces information asymmetry, and reduced information asymmetry reduces the volatility (Diamond and Verrecchia 1991).12 During our sample period, although investors/traders were not getting clear signals from the domestic and foreign events rolling simultaneously into the country, the Turkish government and news media were both heavily downplaying the economic crisis abroad because the Turkish economy and particularly the financial sector, including the banking industry, were robust fol-lowing the restructuring after the Turkish crisis of 2001. Moreover, to lower the public unease, there was an increased public disclosure on firms’ financial health and strength of the financial sector in Turkey. As a result, it is plausible to assume that reduced return volatility is caused by reduced information asymmetry due to arrival of new information during the crisis period.
In Table 4, our findings indicate that news on the Turkish and U.S. economies does not seem to affect return volatility in Turkey. News from Europe has a negative and sig-nificant effect on return volatility. During that time frame, perhaps the focus of investors was on crisis contagion through trade, and they thus paid more attention to news about major trading partners.
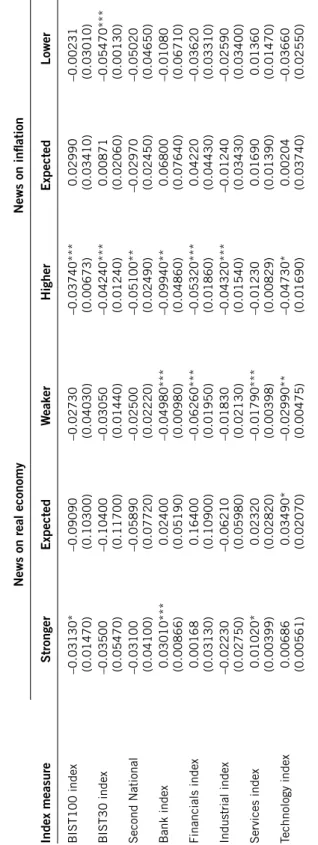
As discussed in the related literature, we cannot assume all news headlines send the same signal to investors/traders. News headlines that indicate a surprise output growth or a surprise rise in price levels can have a different interpretation than expected output growth or a surprise decline in price level. Therefore, we classify news on real economy
and money/inflation into three groups in order to distinguish surprises from expected news by comparing actual to expected news. For news on real economy, the subgroups defined are stronger than expected, as expected, and weaker than expected. For news on money/inflation, we use subgroups higher than expected, as expected, and lower than expected. Moreover, as discussed in Birz and Lott (2011) and Pearce and Solakoglu (2007), the same news headline can send a different signal depending on whether the economy is in a recession or is overheating. For example, in an overheating economy, news on surprise output growth can be interpreted as bad news, while the same can be interpreted as good news when the economy is in a recession. Given that our sample period corresponds to a crisis period, we believe that both surprise growth and surprise inflation news represent signals of good news, which may or may not lead to a decline in return volatility. However, we expect return volatility to decline after a good signal. This expectation is based on literature about herding (see, e.g., Chang et al. 2000; Christie and Huang 1995; Hwang and Salmon 2004).
Table 5 presents our estimation results under the aforementioned classification. Results indicate that higher-than-expected inflation leads to a decline in return volatility for all indexes, which is consistent with our expectation. Stronger-than-expected news on real economy causes return volatility to increase for services and bank indexes. Only for the BIST100 index, we find a negative and significant coefficient. Interestingly, weaker-than-expected news leads to a decline in return volatility.
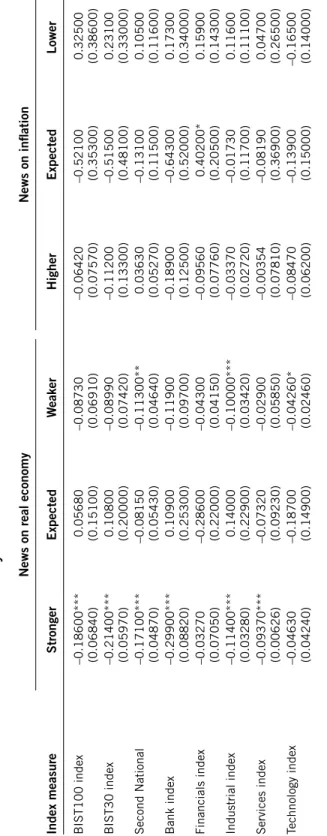
In Tables 6, 7, and 8, we investigate the role of news arrival on return volatility for the United States, the European countries, and Turkey, respectively. As presented in Table 6, return volatility is mostly influenced by U.S. real economy news. The effect seems to be negative for both stronger and weaker real economy news. News on inflation from the
Table 4. New information arrival and stock market volatility
Index measure
News measure Total
news Economic news newsU.S. European news Turkish news
BIST100 index –0.00045(0.00032) –0.00699***(0.00267) –0.01790(0.02190) –0.01440***(0.00551) (0.12900)0.08820 BIST30 index –0.00055(0.00037) –0.00809***(0.00295) –0.02060(0.02490) –0.01680***(0.00624) (0.15700)0.09710 Second National (0.00022)0.000484** –0.00576(0.00399) –0.00317(0.01440) –0.01320***(0.00519) (0.09660)0.09810 Bank index –0.00074 (0.00057) –0.01110*** (0.00422) –0.03950 (0.06760) –0.02370*** (0.00894) 0.09990 (0.46500) Financials index –0.00063***(0.00003) –0.01020***(0.00375) –0.03620(0.02920) –0.02170***(0.00282) (0.17800)0.09140 Industrial index –0.00012(0.00020) –0.01020***(0.00758) –0.01430(0.01400) –0.02570***(0.00770) (0.07510)0.10400 Services index –0.00029(0.00018) –0.00991***(0.00165) –0.00238(0.02820) –0.00851***(0.00322) (0.19600)0.07550 Technology index –0.00021(0.00030) –0.00856***(0.00183) –0.00447(0.01770) –0.02930***(0.01020) (0.09740)0.06120 Notes: Standard errors are in parentheses. * Statistically significant at 10 percent; ** statistically significant at 5 percent; *** statistically significant at 1 percent.
256
Table 5. Economic news and volatility
News on real economy
News on inflation Index measure Stronger Expected W eaker Higher Expected Lower BIST100 index –0.03130* (0.01470) –0.09090 (0.10300) –0.02730 (0.04030) –0.03740*** (0.00673) 0.02990 (0.03410) –0.00231 (0.03010) BIST30 index –0.03500 (0.05470) –0.10400 (0.11700) –0.03050 (0.01440) –0.04240*** (0.01240) 0.00871 (0.02060) –0.05470*** (0.00130) Second National –0.03100 (0.04100) –0.05890 (0.07720) –0.02500 (0.02220) –0.05100** (0.02490) –0.02970 (0.02450) –0.05020 (0.04650) Bank index 0.03010*** (0.00866) 0.02400 (0.05190) –0.04980*** (0.00980) –0.09940** (0.04860) 0.06800 (0.07640) –0.01080 (0.06710) Financials index 0.00168 (0.03130) 0.16400 (0.10900) –0.06260*** (0.01950) –0.05320*** (0.01860) 0.04220 (0.04430) –0.03620 (0.03310) Industrial index –0.02230 (0.02750) –0.06210 (0.05980) –0.01830 (0.02130) –0.04320*** (0.01540) –0.01240 (0.03430) –0.02590 (0.03400) Services index 0.01020* (0.00399) 0.02320 (0.02820) –0.01790*** (0.00398) –0.01230 (0.00829) 0.01690 (0.01390) 0.01360 (0.01470) Technology index 0.00686 (0.00561) 0.03490* (0.02070) –0.02990** (0.00475) –0.04730* (0.01690) 0.00204 (0.03740) –0.03660 (0.02550) Notes:
Standard errors are in parentheses. * Statistically significant at 10 percent; ** statistically significant at 5 percent; *** st
atistically significant at 1 percent.
Table 6. U.S. economic news and volatility
News on real economy
News on inflation Index measure Stronger Expected W eaker Higher Expected Lower BIST100 index –0.18600*** (0.06840) 0.05680 (0.15100) –0.08730 (0.06910) –0.06420 (0.07570) –0.52100 (0.35300) 0.32500 (0.38600) BIST30 index –0.21400*** (0.05970) 0.10800 (0.20000) –0.08990 (0.07420) –0.11200 (0.13300) –0.51500 (0.48100) 0.23100 (0.33000) Second National –0.17100*** (0.04870) –0.08150 (0.05430) –0.11300** (0.04640) 0.03630 (0.05270) –0.13100 (0.11500) 0.10500 (0.11600) Bank index –0.29900*** (0.08820) 0.10900 (0.25300) –0.11900 (0.09700) –0.18900 (0.12500) –0.64300 (0.52000) 0.17300 (0.34000) Financials index –0.03270 (0.07050) –0.28600 (0.22000) –0.04300 (0.04150) –0.09560 (0.07760) 0.40200* (0.20500) 0.15900 (0.14300) Industrial index –0.11400*** (0.03280) 0.14000 (0.22900) –0.10000*** (0.03420) –0.03370 (0.02720) –0.01730 (0.11700) 0.11600 (0.11100) Services index –0.09370*** (0.00626) –0.07320 (0.09230) –0.02900 (0.05850) –0.00354 (0.07810) –0.08190 (0.36900) 0.04700 (0.26500) Technology index –0.04630 (0.04240) –0.18700 (0.14900) –0.04260* (0.02460) –0.08470 (0.06200) –0.13900 (0.15000) –0.16500 (0.14000) Notes:
Standard errors are in parentheses. * Statistically significant at 10 percent; ** statistically significant at 5 percent; *** sta
tistically significant at 1 percent.
258
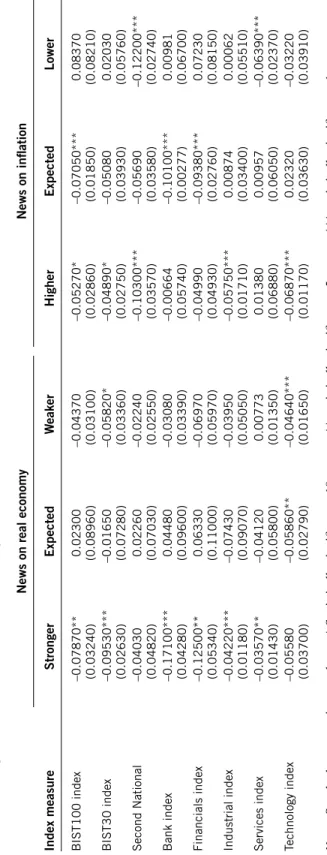
Table 7. European economic news and volatility Index measure
News on real economy
News on inflation Stronger Expected W eaker Higher Expected Lower BIST100 index –0.07870** (0.03240) 0.02300 (0.08960) –0.04370 (0.03100) –0.05270* (0.02860) –0.07050*** (0.01850) 0.08370 (0.08210) BIST30 index –0.09530*** (0.02630) –0.01650 (0.07280) –0.05820* (0.03360) –0.04890* (0.02750) –0.05080 (0.03930) 0.02030 (0.05760) Second National –0.04030 (0.04820) 0.02260 (0.07030) –0.02240 (0.02550) –0.10300*** (0.03570) –0.05690 (0.03580) –0.12200*** (0.02740) Bank index –0.17100*** (0.04280) 0.04480 (0.09600) –0.03080 (0.03390) –0.00664 (0.05740) –0.10100*** (0.00277) 0.00981 (0.06700) Financials index –0.12500** (0.05340) 0.06330 (0.11000) –0.06970 (0.05970) –0.04990 (0.04930) –0.09380*** (0.02760) 0.07230 (0.08150) Industrial index –0.04220*** (0.01180) –0.07430 (0.09070) –0.03950 (0.05050) –0.05750*** (0.01710) 0.00874 (0.03400) 0.00062 (0.05510) Services index –0.03570** (0.01430) –0.04120 (0.05800) 0.00773 (0.01350) 0.01380 (0.06880) 0.00957 (0.06050) –0.06390*** (0.02370) Technology index –0.05580 (0.03700) –0.05860** (0.02790) –0.04640*** (0.01650) –0.06870*** (0.01170) 0.02320 (0.03630) –0.03220 (0.03910) Notes:
Standard errors are in parentheses. * Statistically significant at 10 percent; ** statistically significant at 5 percent; *** sta
tistically significant at 1 percent.
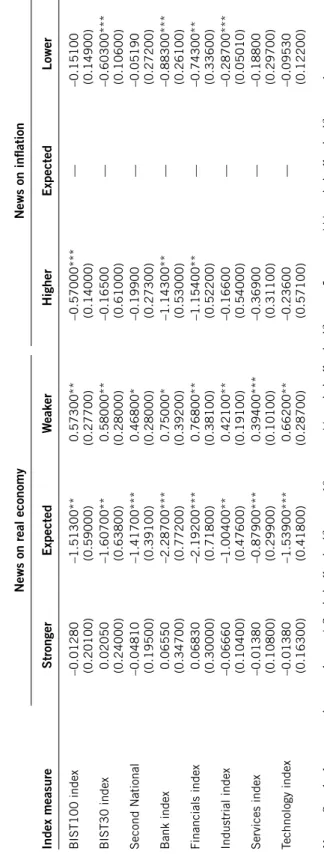
Table 8. T
urkish economic news and volatility
Index measure
News on real economy
News on inflation Stronger Expected W eaker Higher Expected Lower BIST100 index –0.01280 (0.20100) –1.51300** (0.59000) 0.57300** (0.27700) –0.57000*** (0.14000) — –0.15100 (0.14900) BIST30 index 0.02050 (0.24000) –1.60700** (0.63800) 0.58000** (0.28000) –0.16500 (0.61000) — –0.60300*** (0.10600) Second National –0.04810 (0.19500) –1.41700*** (0.39100) 0.46800* (0.28000) –0.19900 (0.27300) — –0.05190 (0.27200) Bank index 0.06550 (0.34700) –2.28700*** (0.77200) 0.75000* (0.39200) –1.14300** (0.53000) — –0.88300*** (0.26100) Financials index 0.06830 (0.30000) –2.19200*** (0.71800) 0.76800** (0.38100) –1.15400** (0.52200) — –0.74300** (0.33600) Industrial index –0.06660 (0.10400) –1.00400** (0.47600) 0.42100** (0.19100) –0.16600 (0.54000) — –0.28700*** (0.05010) Services index –0.01380 (0.10800) –0.87900*** (0.29900) 0.39400*** (0.10100) –0.36900 (0.31100) — –0.18800 (0.29700) Technology index –0.01380 (0.16300) –1.53900*** (0.41800) 0.66200** (0.28700) –0.23600 (0.57100) — –0.09530 (0.12200) Notes:
Standard errors are in parentheses. * Statistically significant at 10 percent; ** statistically significant at 5 percent; *** sta
tistically significant at 1 percent.
260 Emerging Markets Finance & Trade
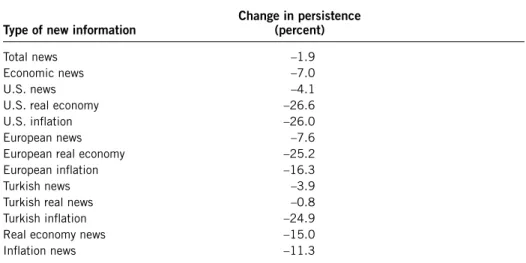
Table 9. New information arrival and persistence
Type of new information Change in persistence (percent)
Total news –1.9
Economic news –7.0
U.S. news –4.1
U.S. real economy –26.6
U.S. inflation –26.0
European news –7.6
European real economy –25.2
European inflation –16.3
Turkish news –3.9
Turkish real news –0.8
Turkish inflation –24.9
Real economy news –15.0
Inflation news –11.3
Notes: Persistence is measured as the sum of coefficients, excluding the constant, in the conditional variance equation. Persistence is calculated for models reported in Tables 5–8.
United States appears to be trivial for investors in Borsa Istanbul. For European news (Table 7), we have some evidence that stronger-than-expected news on real economy reduces return volatility. However, for inflation, most news leads to a decline in return volatility.
News on a stronger Turkish real economy (Table 8) does not affect return volatility. If there is no surprise, we observe a decline in volatility, whereas negative news causes return volatility to increase. Perhaps investors/traders do not put high expectations on positive news, but they value negative news at face value. Our results also indicate that market volatility responds negatively to news on inflation. Most of the responses are nega-tive, regardless of whether the news indicates a positive surprise or a negative surprise. As discussed earlier, we may assume, as an explanation, that reduced return volatility is caused by reduced information asymmetry due to news arrival (Diamond and Verrecchia 1991). As another explanation, it is reasonable to assume that investors/traders cannot separate good news from bad news, and hence they choose the best action by, perhaps, acting together and following the market. That is, this finding might be related to “unin-tentional herding,” where investors take independent but similar actions (Bikhchandani and Sharma 2001; Hwang and Salmon 2004). The results presented in Tables 6, 7, and 8 also indicate that return volatility is not influenced much by the expected news, which is consistent with the efficient market hypothesis.
According to MDH, if news arrival is important for volatility, we should expect to observe a decrease in volatility persistence. In Table 9, we present the average percentage change in volatility persistence with and without news. For instance, when we include total news as a measure of new information arrival in the conditional variance equation, volatility persistence reduces by an average of 1.9 percent. However, with economic news as the measure, we observe an average decline of 7.0 percent. The comparison of news arrival by country indicates that news from Europe leads to a larger decline in volatility persistence than news from Turkey or the United States.
When new information arrival is represented by the news categories in the conditional volatility equation, the decline in volatility persistence is about 15.0 percent for real economy news and about 11.3 percent for inflation news. Moreover, while real economy news from Europe and the United States has a greater effect on volatility persistence than does inflation news from Europe and the United States, inflation news on the Turkish economy has a greater effect on volatility persistence than does Turkish real economy news, which appears to have almost no effect on volatility persistence.
Concluding Remarks
In this study, we investigate the role of news on return volatility in Borsa Istanbul for the period September 1, 2008–March 31, 2009. The news arrival is measured by the number of daily news headlines, and news is classified according to the country of origin, the economic content, and the surprise component.
Our results show that the arrival of news mostly causes a decline in return volatility. Moreover, while both real economy and inflation news from Europe and Turkey affect return volatility, from the United States, only real economy news appears to effect return volatility. In most estimations, consistent with the efficient market hypothesis, return volatility is not influenced by expected news. Although some of the negative effects are expected (such as a decline in return volatility due to higher-than-expected inflation, which may signal economic growth and not inflationary pressures during a crisis), some of the negative effects are not expected (such as a fall in return volatility due to weaker-than-expected growth in the economy). This finding might be due to reduced information asymmetry or unintentional herding by investors in the Turkish stock market during the crisis.
As implied by the mixture-of-distributions hypothesis, our results show a decline in volatility persistence. In particular, economic news and specifically European news lead to a larger decline in volatility persistence. Furthermore, while only inflation news on the Turkish economy reduces volatility persistence, both types of news from Europe and the United States lead to a significant decline in persistence, indicating that Turkish news on real economy is not an important source for volatility clustering. Given the unusual negative effect of news arrival on return volatility, it would be useful to examine the effect of news on return volatility in a more recent, noncrisis period, taking into account the herding patterns.
Notes
1. Along with trading volume, other measures, such as floor transactions, number of price changes, and executed order imbalances, are also used (Locke and Sayers 1993).
2. In April 2013, all exchanges operating in the Turkish capital markets were brought together under Borsa Istanbul, and Istanbul Stock Exchange became part of this new entity. For more in-formation, see the Borsa Istanbul Web site (www.borsaistanbul.com).
3. The share of Turkish exports to the subsegment of European countries is around 30 percent for both 2008 and 2009. If we look at the Turkish exports to EU countries, the share of exports increases to 62 percent and 65 percent, respectively, for 2008 and 2009 (www.economy.gov.tr).
4. Although political news can be important for emerging markets, our analysis includes po-litical news counts only in the total news category; the focus is more on economic news. For the effect of political news on return volatility, see Önder and S*imga-Mugan (2006).
5. Foreks Information Communication Services is a company that specializes in providing real time financial data to banks and financial institutions.
262 Emerging Markets Finance & Trade
6. Matriks Information Distribution Services is a company that specializes in providing real time financial data, mostly to banks and financial institutions.
7. Our sample includes several days with missing data. We replace missing values with the average number of news items for the relevant day. For example, if we have data missing from Monday, we use the Monday average, not the overall average.
8. Some examples of news that falls into this latter category are crude oil inventory, change in housing financing, and Central Bank net debt amount. These news items are excluded from the analysis for two reasons: first, their mixed signals make them difficult to categorize; further, we do not want to present results for individual news. Second, we use “other news” as a proxy for new information arrival; overall results indicate that other news does not influence volatility significantly.
9. There are days with no news arrival on real economy or inflation; hence, we have zero minimum values for these subsegments. However, in our sample, we do not have zero number of news arrivals on the same day for all subsegments, so Table 1, which provides descriptive statistics on overall economic news, reports positive values for the minimum economic news.
10. To check for the robustness of our results, we also estimate EGARCH (1, 1) model, and the results are qualitatively the same. Moreover, the inclusion of lagged news arrival measures with and without contemporary news arrival measure in the conditional variance equation does not change the sign or significance of the effect significantly. Judging from the correlogram and Box-Pierce Q test results, we assume that there is no unaccounted information in the residuals and use GARCH (1, 1) model in our estimations.
11. To test the robustness of our results, we calculate the correlation between squared residuals and total news in our sample data. The correlation is negative. Further, when we use lead and lag news to calculate the correlation coefficient, the sign stays negative. The calculation of the same correlation coefficient for the recent data shows a positive correlation coefficient.
12. We thank an anonymous referee for pointing out this explanation. References
Almeida, A.; C. Goodhart; and R. Payne. 1998. “The Effects of Macroeconomic News on High Frequency Exchange Rate Behavior.” Journal of Financial and Quantitative Analysis 33, no. 3: 383–408.
Andersen, T.G. 1996. “Return Volatility and Trading Volume: An Information Flow Interpreta-tion of Stochastic Volatility.” Journal of Finance 51, no. 1: 169–204.
Andersen, T.G., and T. Bollerslev. 1998. “Deutsche Mark–Dollar Volatility: Intraday Activ-ity Patterns, Macroeconomic Announcements, and Longer Run Dependencies.” Journal of
Finance 53, no. 1: 219–265.
Baklaci, H.F.; G. Tunc; B. Aydogan; and G. Vardar. 2011. “The Impact of Firm-Specific Public News on Intraday Market Dynamics: Evidence from the Turkish Stock Market.” Emerging
Markets Finance & Trade 47, no. 6: 99–119.
Berry, T.D., and K.M. Howe. 1994. “Public Information Arrival.” Journal of Finance 49, no. 4: 1331–1346.
Bikhchandani, S., and S. Sharma. 2001. “Herd Behavior in Financial Markets: A Review.” IMF
Staff Papers 47, no. 3: 279–310.
Birz, G., and J.R. Lott Jr. 2011. “The Effect of Macroeconomic News on Stock Returns: New Evidence from Newspaper Coverage.” Journal of Banking and Finance 35, no. 11: 2791–2800.
Bollerslev, T. 1986. “Generalized Autoregressive Conditional Heteroscedasticity.” Journal of
Econometrics 31, no. 3: 307–326.
Bollerslev, T., and I. Domowitz. 1993. “Trading Patterns and Prices in the Interbank Foreign Exchange Market.” Journal of Finance 48, no. 4: 1421–1444.
Chang, E.C.; J.W. Cheng; and A. Khorana. 2000. “An Examination of Herd Behavior in Equity Markets: An International Perspective.” Journal of Banking and Finance 24, no. 10: 1651–1679.
Chang, Y., and S.J. Taylor. 2003. “Information Arrivals and Intraday Exchange Rate Volatility.”
Journal of International Financial Markets, Institutions and Money 13, no. 2: 85–112.
Christie, W.G., and R.D. Huang. 1995. “Following the Pied Piper: Do Individual Returns Herd Around the Market?” Financial Analysts Journal 51, no. 4: 31–37.
Darrat, A.F.; M. Zhong; and L.T.W. Cheng. 2007. “Intraday Volume and Volatility Relations with and Without Public News.” Journal of Banking and Finance 31, no. 9: 2711–2729. Diamond, D.W., and R.E. Verrecchia. 1991. “Disclosure, Liquidity, and the Cost of Capital.”
Journal of Finance 46, no. 4: 1325–1359.
Ederington, L.H., and J.H. Lee. 1993. “How Markets Process Information: News Releases and Volatility.” Journal of Finance 48, no. 4: 1161–1191.
Engle, R.F. 1982. “Autoregressive Conditional Heteroscedasticity with Estimates of the Vari-ances of United Kingdom Inflation.” Econometrica 50, no. 4: 987–1008.
Hwang, S., and M. Salmon. 2004. “Market Stress and Herding.” Journal of Empirical Finance 11, no. 4: 585–616.
Janssen, G. 2004. “Public Information Arrival and Volatility Persistence in Financial Markets.”
European Journal of Finance 10, no. 3: 177–197.
Kalev, P.S.; W.-M. Liu; P.K. Pham; and E. Jarnecic. 2004. “Public Information Arrival and Vola-tility of Intraday Stock Returns.” Journal of Banking and Finance 28, no. 6: 1441–1467. Kutan, A.M., and T. Aksoy. 2004a. “Public Information Arrival and Emerging Markets Returns
and Volatility.” Multinational Finance Journal 8, no. 3–4: 227–245.
———. 2004b. “Public Information Arrival and Gold Market Returns in Emerging Markets: Evidence from the Istanbul Gold Exchange.” Scientific Journal of Administrative
Develop-ment 2: 13–26.
Lamoureux, C.G., and W.D. Lastrapes. 1990. “Heteroscedasticity in Stock Return Data: Volume Versus GARCH Effects.” Journal of Finance 45, no. 1: 221–229.
Locke, P.R., and C.L. Sayers. 1993. “Intra-Day Futures Price Volatility: Information Effects and Variance Persistence.” Journal of Applied Econometrics 8, no. 1: 15–30.
Mitchell, M.L., and J.H. Mulherin. 1994. “The Impact of Public Information on Stock Market.”
Journal of Finance 49, no. 3: 923–950.
Önder, Z., and C. S*imga-Mugan. 2006. “How Do Political and Economic News Affect Emerg-ing Markets?” EmergEmerg-ing Markets Finance & Trade 42, no. 4: 50–77.
Pearce, D.K., and V.V. Roley. 1985. “Stock Prices and Economic News.” Journal of Business 58, no. 1: 49–67.
Pearce, D.K., and M.N. Solakoglu. 2007. “Macroeconomic News and Exchange Rates.” Journal
of International Financial Markets, Institutions and Money 17, no. 4: 307–325.