Contents lists available atScienceDirect
BBA - Molecular Cell Research
journal homepage:www.elsevier.com/locate/bbamcrDistinct apoptotic blocks mediate resistance to panHER inhibitors in HER2+
breast cancer cells
Bahriye Karakas
a, Yeliz Ozmay
b, Huveyda Basaga
a, Ozgur Gul
c, Ozgur Kutuk
b,⁎ aSabanci University, Molecular Biology, Genetics and Bioengineering Program, Istanbul, TurkeybBaskent University School of Medicine, Dept. of Medical Genetics, Adana Dr. Turgut Noyan Medical and Research Center, Adana, Turkey cBilgi University, Dept. of Genetics and Bioengineering, Istanbul, Turkey
A R T I C L E I N F O Keywords: Breast cancer panHER HER2 Neratinib Cell death BCL-2 A B S T R A C T
Despite the development of novel targeted therapies, de novo or acquired chemoresistance remains a significant factor for treatment failure in breast cancer therapeutics. Neratinib and dacomitinib are irreversible panHER inhibitors, which block their autophosphorylation and downstream signaling. Moreover, neratinib and daco-mitinib have been shown to activate cell death in HER2-overexpressing cell lines. Here we showed that increased MCL1 and decreased BIM and PUMA mediated resistance to neratinib in ZR-75-30 and SKBR3 cells while in-creased BCL-XL and BCL-2 and dein-creased BIM and PUMA promoted neratinib resistance in BT474 cells. Cells were also cross-resistant to dacomitinib. BH3 profiles of HER2+ breast cancer cells efficiently predicted anti-apoptotic protein dependence and development of resistance to panHER inhibitors. Reactivation of ERK1/2 was primarily responsible for acquired resistance in SKBR3 and ZR-75-30 cells. Adding specific ERK1/2 inhibitor SCH772984 to neratinib or dacomitinib led to increased apoptotic response in neratinib-resistant SKBR3 and ZR-75-30 cells, but we did not detect a similar response in neratinib-resistant BT474 cells. Accordingly, suppression of BCL-2/BCL-XL by ABT-737 was required in addition to ERK1/2 inhibition for neratinib- or dacomitinib-induced apoptosis in neratinib-resistant BT474 cells. Our results showed that different mitochondrial apoptotic blocks mediated acquired panHER inhibitor resistance in HER2+ breast cancer cell lines as well as highlighted the potential of BH3 profiling assay in prediction of panHER inhibitor resistance in breast cancer cells.
1. Introduction
Mutation, amplification or altered activity of HER receptor tyrosine kinase family members (EGFR, HER2, HER3, HER4) has been found to play critical roles in the malignant transformation and tumor main-tenance of many cancer types including breast cancer [1]. HER2 overexpression is detected in nearly one-fifth of breast cancer cases and is correlated with poor prognosis. Thus, HER2 is a prominent ther-apeutic target in these patients and HER2-targeting drugs such as trastuzumab, pertuzumab and lapatinib are actively being used in the breast oncology practice. Although targeted therapies significantly improved survival and quality of life in patients with HER2-amplified tumors, development of resistance is a common phenomenon limiting the success of HER2 inhibitors [2–4]. Several molecular mechanisms have been proposed to mediate resistance to HER2-targeting therapies
such as activation of compensatory bypass signaling by other receptor tyrosine kinases (HER3, HER4, EGFR, IGF-IR), activation of estrogen receptor signaling, expression of truncated p95 isoform of HER2, ac-quisition of HER2 mutations, aberrant activation of PI3K/Akt pathway (loss of PTEN, PIK3CA mutations) and alteration of mitochondrial apoptosis signaling [1,5–12].
Importantly, irreversible small molecule panHER inhibitors (ner-atinib, dacomitinib, afatinib) have been recently developed to enhance therapeutic response in HER2+ breast cancer and clinical trials are ongoing which utilize these molecules [13–16]. Neratinib has been shown to exert significant antitumor activity in breast cancer either as a single agent or in combination with other chemotherapy agents [16–19]. Moreover, neratinib was recently approved by FDA for ex-tended adjuvant treatment of patients with HER2+ early-stage breast cancer with a history of previous trastuzumab-based adjuvant therapy
https://doi.org/10.1016/j.bbamcr.2018.05.002
Received 23 October 2017; Received in revised form 29 April 2018; Accepted 2 May 2018
⁎Corresponding author at: Baskent University School of Medicine, Department of Medical Genetics, Adana Dr. Turgut Noyan Medical and Research Center, Dadaloglu Mah. 2591 Sok.
No:4, Yuregir, Adana 01250, Turkey.
E-mail address:[email protected](O. Kutuk).
Abbreviations:Δψm, mitochondrial membrane potential; FCCP, carbonylcyanide-4-(trifluoromethoxy)-phenylhydrazone; FITC, fluorescein isothiocyanate; BSA, bovine serum albumin; JC-1, 5,5′,6,6′-tetrachloro-1,1′,3,3′-tetraethylbenzimidazolylcarbocyanine iodide; MOMP, mitochondrial outer membrane permeabilization; BH3, Bcl-2 homology domain 3; PMSF, phenylmethylsulfonylfluoride
Available online 04 May 2018
0167-4889/ © 2018 Elsevier B.V. All rights reserved.
[20]. Likewise, dacomitinib (PF-00299804) efficiently downregulated phosphorylation of EGFR, HER2 and HER4, inducing G0/G1 arrest and apoptosis in HER2+ breast cancer cells [21].
The mitochondrial apoptotic pathway is mainly regulated by pro-tein-protein interactions between antiapoptotic and proapoptotic BCL-2 protein family members [22]. Activation of BAX and BAK by activator BH3-only proteins (BIM, BID and PUMA) along with the inhibition of antiapoptotic BCL-2 proteins (BCL-2, BCL-XL, MCL1) by sensitizer BH3 proteins (BAD, BIK, NOXA, BMF, HRK) promotes the permeabilization of the mitochondrial outer membrane. Mitochondrial outer membrane permeabilization is followed by translocation of cytochrome c into the cytosol and activation of caspases. We and others demonstrated that either increased expression of prosurvival BCL-2 proteins or down-regulation of proapoptotic BCL-2 proteins mediate molecular mechan-isms responsible for de novo or acquired resistance to conventional chemotherapeutics and targeted-therapies [23–28].
Here we demonstrate that acquired therapeutic resistance to ner-atinib is mediated by distinct blocks in cell death signaling pathways in HER2+ breast cancer cells. We found that persistent ERK1/2 activation was present in neratinib-resistant SKBR3R and ZR-75-30R cells fol-lowing treatment with neratinib, while both ERK1/2 and Akt remained active in BT474R cells. Second, increased MCL1, decreased BIM and PUMA contribute to neratinib resistance in SKBR3R and ZR-75-30R cells, although increased BCL-2 and BCL-XL and decreased BIM and PUMA promote resistance to neratinib in BT474R cells. Neratinib re-sistant cells were also cross-rere-sistant to another panHER inhibitor da-comitinib. Consistent with these findings, inhibition of ERK1/2 by SCH772984 led to increased apoptotic response in SKBR3R an ZR-75-30R cells, but suppression of BCL-XL/BCL-2 by ABT-737 was further needed induce apoptosis in BT474R cells. In addition, BH3 profiling assay successfully detected both the development of acquired resistance and dependence on individual antiapoptotic proteins in neratinib-re-sistant cells. Altogether, ourfindings delineate the molecular mechan-isms mediating acquired panHER inhibitor resistance in HER2+ breast cancer cell lines and underscore the potential of BH3 profiling assay in predicting the acquisition of panHER inhibitor resistance in breast cancer cells.
2. Material and methods 2.1. Cell lines and cell culture
SKBR3, ZR-75-30 and BT474 cells were obtained from ATCC/LGC Standards (Wessel, Germany) and grown in DMEM/F12 (ThermoFisher Scientific, Carlsbad, CA, USA) supplemented with 2 mML-glutamine,
10% heat-inactivated fetal bovine serum (Sigma, St Louis, MO, USA), 100 IU/mL penicillin, and 100μg/mL streptomycin (ThermoFisher Scientific, Carlsbad, CA, USA) in a humidified incubator at 37 °C and 5% CO2. Neratinib-resistant SKBR3R, ZR-75-30R and BT474R cells
were derived as described before [29]. After selecting neratinib-re-sistant clonal lines, SKBR3R, ZR-75-30R and BT474R cells were main-tained in the presence of neratinib plus 5μg/mL verapamil. Neratinib was withdrawn from growth media for 24 h before experiments to re-duce the possibility of neratinib-mediated variations in gene expression. Cellular spheroids were grown in AlgiMatrix 24-well plates (Thermo-Fisher Scientific) as recommended by the manufacturer. Spheroids were isolated from matrix using Algimatrix dissolving buffer (ThermoFisher Scientific) for lysis and protein isolation.
2.2. Chemicals
Neratinib, Dacomitinib, SCH772984, ABT-737, ABT-199 and A-1331852 were obtained from Selleck Chemicals. Trehalose, oligomycin, digitonin, succinate, FCCP, cycloheximide, sucrose, HEPES, KCl, MgCl2,
EDTA, EGTA and PMSF were purchased from Sigma.
2.3. Real-time qPCR
Total RNA was extracted using RNeasy kit (Qiagen). To quantify mRNA expression of BCL-2, BCL-XL, MCL1, PUMA, NOXA and BIM, qRT-PCR was carried out using QuantiTect Primer assays (Hs_BCL2_1_SG QuantiTect Primer Assay, NM_000633; Hs_BCL2L1_1_SG QuantiTect Primer Assay, NM_001191; Hs_MCL1_1_SG QuantiTect Primer Assay, NM_001197320; Hs_BCL2L11_1_SG QuantiTect Primer Assay, NM_001204108; Hs_BBC3_1_SG QuantiTect Primer Assay, NM_001127240; Hs_PMAIP1_1_SG, NM_021127, Qiagen) and 1-step QuantiTect SYBR Green qRT-PCR Kit (Qiagen) according to the man-ufacturer's standard protocol on LightCycler 480 instrument (Roche). The housekeeping gene GAPDH (Hs_GAPDH_1_SG QuantiTect Primer Assay, NM_002046, Qiagen) was used for normalization and relative gene expression levels were calculated using 2−ΔΔCT method. Results are shown as fold expression over untreated control (mean ± SEM, n = 3).
2.4. Coimmunoprecipitation, immunoprecipitation and immunoblotting Total cell lysates were prepared in 1% CHAPS buffer [5 mM MgCl2, 140 mM NaCl, 1 mM EDTA, 1 mM EGTA, 1% CHAPS, 20 mM Tris-HCl (pH 7.5), and protease inhibitors (cOmplete ULTRA, Roche)]. AlgiMatrix dissolving buffer (ThermoFisher Scientific) was used to harvest spheroids before lysis in 1% CHAPS buffer. Proteins (1000 μg) were immunoprecipitated with BCL-2 (#4223, Cell Signaling), BCL-XL (#2762, Cell Signaling), MCL1 (S-19, Santa Cruz), BAX (6A7, BD Pharmingen) and BAK (Ab-2, Millipore) antibodies at 4 °C for 16 h and coimmunoprecipitates/immunoprecipitates were captured by Dynabeads Protein G at 4 °C for 2 h. Beads were recovered using DynaMag spin magnet and washed twice in 1% CHAPS buffer. Total cell lysates and immunoprecipitates were separated on 10% SDS-PAGE gels. After SDS-PAGE, proteins were transferred onto PVDF membranes (Millipore) and then blocked with 5% dried milk in PBS-Tween20. Membranes were incubated with primary and secondary antibodies (GE Healthcare) in a buffer containing 10% milk diluent-blocking con-centrate (KPL), detected with Luminata Crescendo Western HRP sub-strate (Millipore). Blots were imaged with C-DiGit Blot Scanner (LI-COR Biosciences, Bad Homburg, Germany) on chemiluminescence mode. The following antibodies were used for immunoblotting: BCL-2 (#2872, Cell Signaling), BCL-XL (#2762, Cell Signaling), Actin (#8457, Cell Signaling), MCL1 (S-19, Santa Cruz), BIM (#2933, Cell Signaling), NOXA (FL-54, Santa Cruz), PUMA (#4967, Cell Signaling), EGFR (#4267, Cell Signaling), pEGFR (#3777, Cell Signaling), HER2 (#4290, Cell Signaling), pHER2 (#2243, Cell Signaling), HER3 (#12708, Cell Signaling), pHER3 (#2842, Cell Signaling), HER4 (#4795, Cell Signaling), pHER4 (#4757, Cell Signaling), ERK1/2 (#4695, Cell Signaling), pERK1/2 (#4370, Cell Signaling), Akt (#4685, Cell Signaling), pAkt Ser473 (#4060, Cell Signaling), pAkt Thr308 (#13038, Cell Signaling), Cytochrome c (#4272, Cell Signaling), CoxIV (#4844, Cell Signaling), BAX (#2774, Cell Signaling), BAK (#3814, Cell Signaling).
2.5. BH3 profiling
JC-1 (ThermoFisher Scientific) plate-based BH3 profiling was done as described before [30]. GeneCust Europe synthesized the peptides used in this assay and peptide sequences were previously described [31]. Briefly, cells were permeabilized in T-EB buffer [300 mM Treha-lose, 10 mM Hepes-KOH, pH 7.7, 80 mM KCl, 1 mM EGTA, 1 mM EDTA, 0.1% BSA (w/v), 5 mM succinate] in the presence of 0.005% digitonin, 5 mMβ-mercaptoethanol, 10 μg/mL oligomycin, 1 μM JC-1. Cells were transferred to 364-well black plates and treated with indicated BH3 peptides (100μM). JC-1 fluorescence was analyzed at 545 nm excita-tion and 590 nm emission using Spectramax Gemini multiplate fluo-rometer every 5 min for 3 h at 28–32 °C. Data shown are mean ± SEM
of three independent experiments in duplicate and expressed as %ΔΨm (%MMP) loss compared with DMSO-treated cells. FCCP was used as a positive control.
2.6. Caspase activation assays
The activity of caspase-3 and caspase-9 was determined by ApoAlert Caspase Assay Plates (Clontech, Takara) according to manufacturer's protocol. The release of fluorochrome AMC was analyzed at 380 nm excitation and 460 nm emission using Spectramax Gemini microplate fluorometer. Data shown are mean ± SEM of three independent ex-periments and expressed in arbitrary fluorescence units per mg of protein.
2.7. Cell viability and apoptotic assays
Apoptosis was evaluated by Annexin V-FITC/PI staining kit (BD Biosciences, San Diego, CA, USA) according to the manufacturer's protocols. Apoptosis was quantified by flow cytometry on FACSCanto (BD Biosciences, San Diego, CA, USA), followed by analysis using FlowJo v9 software. The alamarBlue assay (Invitrogen) was used to monitor cell viability in cell spheroids grown in 3D culture as described by the manufacturer and results were expressed as percentage of cell viability. Cell viability was determined in cells by CellTiterGlo assay according to the manufacturer's protocol (Promega). Results are ex-pressed as % of untreated control (mean ± SEM).
2.8. Detection of BAX and BAK activation by intracellular staining Detection of BAX and BAK activation by intracellular staining and flow cytometry using active conformation-specific antibodies BAX (6A7, BD Pharmingen) and BAK (Ab-1, Millipore) was performed as described previously [32]. Activation of BAX or BAK was determined by a shift to the right in the histogram.
2.9. Colony-forming assay
Colony-forming assay was done as described previously [33]. Briefly, cells were plated in 24-well plates and treated with indicated drugs for 16 h. Cells were counted and replated into 60-mm tissue culture dishes (200 per plate). Following 10 days of incubation, tissue culture plates were stained with crystal violet [0.5% crystal violet in a 3:1 (v/v) mixture of distilled water/methanol] and colonies were counted. Results were expressed as the percentage of colony formation by untreated control cells.
2.10. Subcellular fractionation
Subcellular fractionation was done as described before [34]. Briefly, cells were harvested and washed in ice-cold PBS and then resuspended in an isotonic buffer [250 mmol/L sucrose, 20 mmol/L HEPES (pH 7.5), 10 mmol/L KCl, 1.5 mmol/L MgCl2, 1 mmol/L EDTA, 1 mmol/L EGTA,
1 mmol/L phenylmethylsulfonyl fluoride, and protease inhibitors cOmplete ULTRA, Roche] on ice for 20 min. Following incubation, cells were homogenized with Dounce homogenizer and centrifuged at 800 × g for 10 min at 4 °C. The resulting supernatant was centrifuged at 8000 × g for 20 min at 4 °C to obtain mitochondrial and cytosolic fractions. These fractions were used to monitor cytochrome c release from mitochondria. Mitochondrial fractions were lysed in 1% CHAPS buffer for immunoblot analysis.
2.11. siRNA transfection
Cells were transfected with BIM siRNA (Hs_BCL2L11_5 FlexiTube siRNA, NM_001204108, Qiagen), PUMA siRNA (Hs_BBC3_2 FlexiTube siRNA, Qiagen) and negative control (scrambled) siRNA (AllStars
Negative Control siRNA, Qiagen) by using Hiperfect transfection re-agent (Qiagen) according to manufacturer's instructions. Protein knockdown efficiencies by siRNA transfection were verified by im-munoblotting 24 h following transfection.
3. Results
3.1. Neratinib-resistant cells are cross-resistant to dacomitinib
To explore the mechanisms of acquired resistance to panHER in-hibitors in HER2+ breast cancer cells, we developed neratinib-resistant breast cancer cell lines. We initially established neratinib-resistant cell pools and then we selected neratinib-resistant clones by continuous exposure to neratinib. EC50values for neratinib in parental (SKBR3,
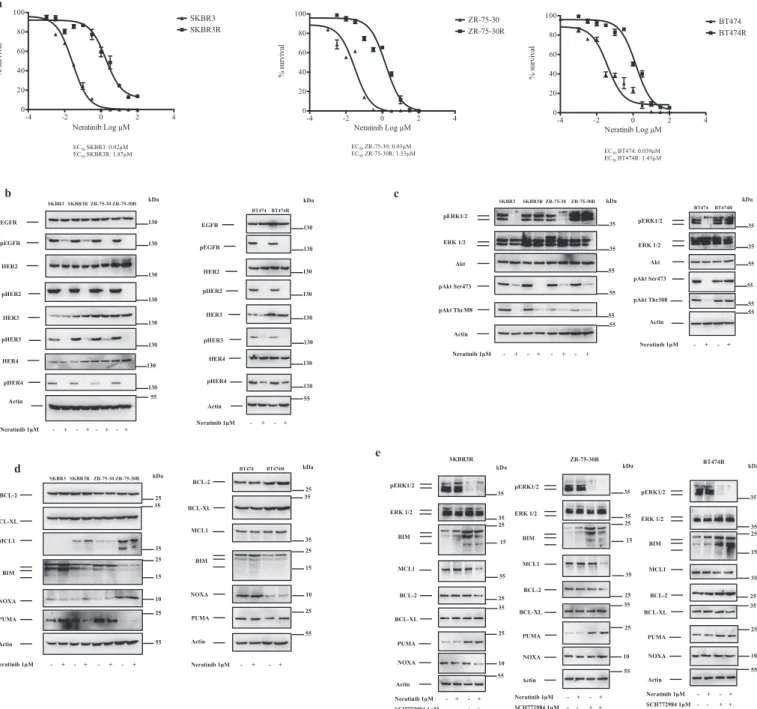
ZR-75-30 and BT474) and resistant cell lines (SKBR3R, ZR-ZR-75-30R, BT474R) were determined by nonlinear regression analysis of dose-response curves (Fig. 1a). Of note, neratinib-resistant cells tolerated nearly 50-fold higher concentrations of the drug. Because reactivation of HER family members was shown to mediate resistance to EGFR/ HER2 inhibitors, we next tested whether neratinib could inhibit EGFR, HER2, HER3 and HER4 in neratinib-resistant cells. As shown inFig. 1b, neratinib treatment inhibited EGFR, HER2, HER3 and HER4 with si-milar efficiencies in parental and resistant cells. These results suggest that neratinib binds to its targets and suppress their activation. To further show the inhibition of HER family members by panHER in-hibitors in neratinib-resistant cells, we took advantage of another ir-reversible panHER inhibitor, dacomitinib. CellTiterGlo assays demon-strated that neratinib-resistant cells were also resistant to dacomitinib treatment (Supplemental Fig. S1a).
3.2. Persistent activation of Akt and ERK1/2 regulates resistance to neratinib
These results implied that alteration of signaling pathways down-stream of receptor signaling could mediate resistance to panHER in-hibitors. Therefore, we next evaluated the effect of neratinib treatment on two major signaling pathways, ERK1/2 and Akt, which are reg-ulators of survival, proliferation and invasion downstream of HER re-ceptors. As shown inFig. 1c, neratinib treatment suppressed ERK1/2 phosphorylation in SKRB3 and ZR-75-30 cells but not in SKBR3R and ZR-75-30R cells. In contrast to ERK1/2 phosphorylation status, Akt phosphorylation at Ser473 and Thr308 could be inhibited with similar efficiencies following treatment with neratinib in parental and ner-atinib-resistant SKBR3R and ZR-75-30R cells. Neratinib treatment in-hibited ERK1/2 and Akt activation in BT474 cells, whereas both ERK1/ 2 and Akt were in active phosphorylated state upon neratinib exposure in BT474R cells. These results suggest that ERK1/2 reactivation by-passes panHER inhibition in SKBR3R and ZR-75-30R cells although concurrent downstream ERK1/2 and Akt reactivation is needed to overcome panHER inhibition in BT474 cells (Fig. 1c). We next com-pared the expression of BCL-2 family proteins in parental and neratinib-resistant cells. As shown inFig. 1d, MCL1 levels were increased, BIM and PUMA levels were decreased in SKBR3R and ZR-75-30R cells. Furthermore, increased NOXA levels were detected in ZR-75-30R cells, although NOXA was not altered in SKBR3R cells. We did not detect any pronounced change in the expression levels of BCL-2 and BCL-XL. Correspondingly, there were increased levels of BCL-2 and BCL-XL and decreased levels of BIM, PUMA and NOXA in BT474R cells. MCL1 was not altered in BT474R cells (Fig. 1d). To test the contribution of altered protein stability in modified expression of BCL-2 proteins in neratinib-resistant cells, we explored the stability of BCL-2 protein family mem-bers BCL-2, BCL-XL, MCL1 and BIM in parental and neratinib-resistant cells using immunoblotting along a time course of treatment with protein synthesis inhibitor cycloheximide. We found that BIM was de-graded more rapidly in SKBR3R cells compared to SKBR3 cells, but BCL-2, BCL-XL, MCL-, PUMA and NOXA had similar rates of degradation in
SKBR3 and SKBR3R cells (Supplemental Fig. S2a) In ZR-75-30R cells, we detected increased stability of MCL1 and NOXA, decreased stability of BIM in comparison to ZR-75-30 cells without any marked change in the degradation rate of BCL-2, BCL-XL and PUMA. Besides, we found that acquired resistance to neratinib led to increased stability of BCL-XL and enhanced degradation of BIM in BT474R cells (Supplemental Fig. S2a). Next, we determined the expression of BCL-2, BCL-XL, MCL1, BIM, PUMA and NOXA at mRNA level in parental and neratinib-re-sistant HER2+ breast cancer cells by using real-time qPCR analysis. Our results demonstrated that MCL1 mRNA levels were upregulated and PUMA mRNA levels were downregulated in SKBR3R and ZR-75-30R cells when compared to SKBR3 and ZR-75-30 cells, respectively (Supplemental Fig. S2b). We could not detect any change in BCL-2, BCL-XL, BIM and NOXA mRNA levels. Notably, BCL-2 and BCL-XL mRNA levels were higher and PUMA mRNA levels were lower in BT474R cells compared to BT474 cells (Supplemental Fig. S2b), without any alteration of BIM, NOXA and MCL1 mRNA expression. These results suggest that increased MCL1 expression in SKBR3R cells is mainly mediated by increased MCL1 mRNA levels, but both increased MCL1 mRNA and protein stability contributes to increased MCL1 ex-pression in ZR-75-30R cells. Besides, increased NOXA stability led to increased NOXA levels in ZR-75-30R cells. Moreover, increased stability of BCL-XL and increased BCL-XL mRNA expression lead to upregulated BCL-XL levels in BT474R cells, but BCL-2 upregulation is mediated by increased BCL-2 mRNA expression. Intriguingly, decreased BIM stabi-lity is a common molecularfinding in all neratinib-resistant cell lines, which underscores the critical role of activated ERK1/2 in mediating resistance to neratinib-induced apoptosis by enhancing the degradation of BIM protein. Similarly, decreased PUMA mRNA levels resulted in downregulation of PUMA in all three neratinib-resistant cell lines. To test whether BIM or PUMA contributes to neratinib-induced cell death in SKBR3, ZR-75-30 and BT474 cells, we depleted BIM by means of RNAi (Supplemental Fig. S3a). We demonstrated that knockdown of BIM suppressed neratinib-induced apoptosis in SKBR3, ZR-75-30 and BT474 cells. In addition, depletion of PUMA protected against ner-atinib-induced apoptosis in SKBR3 and BT474 cells. Scrambled siRNA did not exhibit any significant effect (Supplemental Fig. S3b). 3.3. Inhibition of ERK1/2 and BCL-2/BCL-XL in neratinib-resistant cells restores sensitivity to panHER inhibitors
To evaluate the effect of specific ERK1/2 inhibitor SCH772984 on ERK1/2 activation and BCL-2, BCL-XL, MCL1, BIM, PUMA and NOXA levels, we treated neratinib-resistant cells with neratinib, SCH772984 or combination of both drugs. In SKBR3R and ZR-75-30R cells, BIM and PUMA levels were increased in response to SCH772984 or SCH772984 plus neratinib treatment, but MCL1 and BCL-2 levels were decreased only after SCH772984 plus neratinib treatment (Fig. 1e). We did not observe any change in the expression levels of BCL-XL upon treatment with neratinib, SCH772984 or neratinib plus SCH772984 in these cells. SCH772984 plus neratinib treatment resulted in decreased NOXA in SKBR3R cells but NOXA was not altered following treatment with neratinib, SCH772984 or neratinib plus SCH772984 in ZR-75-30R cells. In BT474R cells, SCH772984 or SCH772984 plus neratinib treatment increased BIM and PUMA levels and decreased MCL1 levels. BCL-XL expression was diminished only after treating the cells with neratinib plus SCH772984. We did not detect any change in NOXA expression in response to neratinib, SCH772984 or neratinib plus SCH772984 treat-ment in BT474R cells. To verify that blocking ERK1/2 activation could sensitize neratinib-resistant cells to neratinib, we evaluated apoptotic response of parental and neratinib-resistant cells following treatment with neratinib, SCH772984 or SCH772984 plus neratinib. As demon-strated inFig. 2a and b, treatment of SKBR3 and ZR-75-30 cells with neratinib triggered apoptosis, but SKBR3R and ZR-75-30R cells were resistant to neratinib or SCH772984 treatment alone. Importantly, neratinib plus SCH772984 treatment led to significant apoptotic
response in SKBR3R and ZR-75-30R cells. Neratinib treatment induced apoptosis in BT474 cells but not in BT474R cells (Fig. 2c). Nonetheless, adding SCH772984 to neratinib was not enough to elicit an apoptotic response in BT474R cells. BCL-2 and BCL-XL levels were increased in BT474R cells. Therefore, we tested whether suppressing BCL-2 and BCL-XL by means of BH3-mimetic ABT-737 could sensitize these cells to neratinib. Our results demonstrated that 737, neratinib plus ABT-737 or SCH772984 plus ABT-ABT-737 did not elicit any substantial apop-totic response in BT474R cells. Of note, neratinib plus SCH772984 plus ABT-737 treatment led to significant apoptosis in these cells (Fig. 2c). Next, we tested whether a selective BCL-XL inhibitor (A-1331852) or a selective BCL-2 inhibitor (ABT-199) sensitize BT474R cells with similar efficacy as ABT-737. Our results indicated that treatment of BT474R cells with BCL-XL inhibitor (A-1331852) or BCL-2 inhibitor (ABT-199) in combination with neratinib plus SCH772984 did not induce cell death in BT474R cells (Supplemental Fig. S4). Therefore, simultaneous inhibition of BCL-2 and BCL-XL was shown to be necessary for sensi-tizing BT474R cells to neratinib plus SCH772984 treatment.
Next, we tested whether combination of ERK1/2 inhibitor and ABT-737 with dacomitinib induces apoptosis in neratinib-resistance cell lines. We found that dacomitinib plus SCH772984 treatment led to robust apoptotic response in SKBR3R and ZR-75-30R cells, although dacomitinib or SCH772984 treatment alone did not have any sig-nificant effect (Supplemental Fig. S1b). In addition, dacomitinib plus SCH772984 plus ABT-737 treatment triggered cell death in BT474R cells (Supplemental Fig. S1b). Dacomitinib, SCH772984 or ABT-737 treatment did not alter the apoptotic response when used as single agents.
3.4. Mitochondrial apoptosis is reactivated by combination therapies in neratinib-resistant breast cancer cells
To verify that these proapoptotic effects were occurring via the mitochondrial apoptosis pathway, we monitored cytochrome c release from mitochondria. As shown inFig. 3a, neratinib treatment promoted cytochrome c release in SKBR3, ZR-75-30 and BT474 cells, but not in SKBR3R, ZR-75-30R and BT474R cells. Accordingly, neratinib plus SCH722984 treatment led to cytochrome c release from mitochondria in SKBR3R and ZR-75-30R cells. In BT474R cells, cytochrome c release was detected after treatment of cells with neratinib plus SCH772984 plus ABT-737. Supporting thesefindings, caspase-3 and caspase-9 was activated upon exposure to neratinib plus SCH772984 in SKBR3R and ZR-75-30R cells and neratinib plus SCH772984 plus ABT-737 in BT474R cells (Fig. 3b). Of note, moderate activation of caspase-8 was also detected in ZR-75-30R cells in response to neratinib plus SCH772984 treatment. Dacomitinib induced cytochrome c release in parental SKBR3 and BT474 cells with similar efficiency as neratinib, but not in neratinib-resistant SKBR3R and BT474R cells (Supplemental Fig. S1c). Similar to neratinib plus SCH77298 combination, dacomitinib plus SCH722984 treatment led to cytochrome c release from mi-tochondria in SKBR3R cells (Supplemental Fig. S1c). We further de-tected cytochrome c release from mitochondria in BT474R cells upon exposure to dacomitinib plus SCH772984 plus ABT-737. Caspase-3 and caspase-9 were also activated in SKBR3R and ZR-75-30R cells after treatment with dacomitinib plus SCH722984, and in BT474R cells after treatment with dacomitinib plus SCH772984 plus ABT-737 (Supple-mental Fig. S1b). Treatment of cells with inhibitors alone did not alter caspase-3, caspase-9 or caspase-8 activation in neratinib-resistant cell lines. To further support our data that mitochondrial apoptosis sig-naling is activated in neratinib-resistant cells in response to treatment with combination of inhibitors, we determined the activation of BAX and BAK in these cells byflow cytometer. Neratinib triggered the ac-tivation of BAX and BAK in SKBR3 and ZR-75-30 cells but not in SKBR3R and ZR-75-30R cells (Supplemental Fig. S5a, b). Nonetheless, neratinib plus SCH722984 treatment led to activated BAX and BAK in SKBR3R and ZR-75-30R cells. In addition, we found that neratinib
activated BAX and BAK in BT474 cells, but active BAX or BAK was not detected in BT474R cells (Supplemental Fig. S5c). Respectively, BCL-2 and BCL-XL need to be neutralized to reengage mitochondrial apoptotic pathway in BT474R cells, neratinib plus SCH772984 plus ABT-737 treatment in BT474R activated BAX and BAK in these cells (Supple-mental Fig. S5c). To test the activation of BAX and BAK in response to dacomitinib in SKBR3, SKBR3R, BT474 and BT474R cells, we exposed the cells to dacomitinib and we evaluated BAX and BAK activation by means of immunoprecipitation with conformation-specific antibodies. We found that dacomitinib induced BAX and BAK activation in SKBR3
and BT474 cells, although they were not activated in SKBR3R and BT474R cells after treatment with dacomitinib (Supplemental Fig. S1e). Combining SCH772984 with dacomitinib in SKBR3R cells and SCH772984 plus ABT-737 with dacomitinib in BT474R cells induced BAX and BAK activation.
We further confirmed the prodeath effects of neratinib in parental cell lines and combination treatments in neratinib-resistant cell lines by means of colony formation assays. As shown in Fig. 3c, neratinib treatment led to the inhibition of colony formation capabilities in parental cell lines. In contrast, colony formation was suppressed in
-4 -2 0 2 4 0 20 40 60 80 100 ZR-75-30 ZR-75-30R Neratinib Log M % s u rv iv al -4 -2 0 2 4 0 20 40 60 80 100 SKBR3 SKBR3R Neratinib Log M % s u rv iv al -4 -2 0 2 4 0 20 40 60 80 100 BT474 BT474R Neratinib Log M % s u rv iv al pERK1/2 ERK 1/2 SKBR3 SKBR3R ZR-75-30 ZR-75-30R Akt Actin pAkt Ser473 pAkt Thr308 Neratinib 1µM - + - + - + - + pERK1/2 ERK 1/2 BT474 BT474R Akt Actin pAkt Ser473 pAkt Thr308 Neratinib 1µM - + - + c EGFR pEGFR HER2 Actin pHER2 pHER4 HER4 pHER3 HER3 SKBR3 SKBR3R ZR-75-30 ZR-75-30R Neratinib 1µM - + - + - + - + EGFR pEGFR HER3 Actin pHER3 pHER4 HER4 HER2 pHER2 BT474 BT474R Neratinib 1µM - + - + EC50 SKBR3: 0.02µM EC50 SKBR3R: 1.87µM EC50 BT474: 0.039µM EC50 BT474R: 1.43µM EC50 ZR-75-30: 0.03µM EC50 ZR-75-30R: 1.53µM kDa 130 130 130 130 130 130 130 130 55 130 kDa 130 130 130 130 130 130 130 55 35 kDa 35 55 55 55 55 35 35 55 55 55 55 kDa a b e BCL-2 BCL-XL MCL1 BIM Actin SKBR3 SKBR3R ZR-75-30 ZR-75-30R Neratinib 1µM - + - + - + - + NOXA PUMA Neratinib 1µM - + - + BCL-2 BCL-XL MCL1 BIM Actin BT474 BT474R NOXA PUMA SKBR3R Neratinib 1µM - + - + SCH772984 1µM - - + + pERK1/2 ERK 1/2 Actin BIM MCL1 BCL-2 BCL-XL PUMA NOXA ZR-75-30R Neratinib 1µM - + - + SCH772984 1µM - - + + Actin pERK1/2 ERK 1/2 BIM MCL1 BCL-2 BCL-XL PUMA NOXA BT474R Neratinib 1µM - + - + SCH772984 1µM - - + + Actin pERK1/2 ERK 1/2 BIM MCL1 BCL-2 BCL-XL PUMA NOXA kDa 25 35 35 25 15 25 10 55 kDa 25 35 35 25 15 25 10 55 25 15 55 35 35 kDa 35 25 35 25 25 15 55 35 35 kDa 35 25 35 25 25 15 55 35 35 kDa 35 25 35 25 10 10 10 d
Fig. 1. Acquired resistance to neratinib is mediated by distinct molecular mechanisms in HER2+ breast cancer cells. a) Cell viabilities of parental (SKBR3, ZR-75-30 and BT474) and neratinib-resistant cell lines (SKBR3R, ZR-75-30R, BT474R) following treatment with different doses of neratinib for 48 h were determined by using CellTiter Glo assay. EC50values were determined by nonlinear regression analysis using GraphPad Prism 6.0 software. Bars, SE. b) Western blot analysis of EGFR,
pEGFR, HER2, pHER2, HER3, pHER3, HER4 and pHER4 in parental and neratinib-resistant cells following treatment with 1μM neratinib for 2 h. Actin was probed as loading control. c) Immunoblot analysis of pERK1/2, ERK1/2, Akt, pAkt (S473) and pAKT (T308) in parental and neratinib-resistant cells following treatment with 1μM neratinib for 2 h. Actin was probed as loading control. d) Western blot analysis of BCL-2, BCL-XL, MCL1, BIM, PUMA and NOXA in parental and neratinib-resistant cells following treatment with 1μM neratinib for 2 h. Actin was probed as a loading control. e) pERK1/2, ERK1/2, BIM, MCL1, BCL-2, BCL-XL, PUMA and NOXA levels were detected following treatment with neratinib (1μM), SCH772984 (1 μM), or combination of both drugs in neratinib-resistant cells.
a
b
Untreated SKBR3 Neratinib-treated SKBR3 Untreated SKBR3R Neratinib-treated SKBR3R
SCH772984-treated SKBR3R SCH772984 + Neratinib-treated SKBR3R
Untreated ZR-75-30 Neratinib-treated ZR-75-30 Untreated ZR-75-30R Neratinib-treated ZR-75-30R
SCH772984-treated ZR-75-30R SCH772984 + Neratinib-treated ZR-75-30R
c
Untreated BT474 Neratinib-treated BT474 Untreated BT474R Neratinib-treated BT474R SCH772984-treated BT474R ABT-737-treated BT474RSCH772984 + Neratinib-treated BT474R ABT-737 + Neratinib-treated BT474R SCH772984 + ABT-737-treated BT474R SCH772984 + ABT-737+ Neratinib-treated BT474R
SKBR3R and ZR-75-30R cells only after treatment with neratinib plus SCH772984. Similar to thesefindings, colony formation was inhibited in BT474 cells following treatment with neratinib whereas neratinib plus SCH772984 plus ABT-737 treatment was required to suppress colony formation capability of BT474R cells (Fig. 3c). As to better re-capitulate the in vivo milieu of breast tumors, we tested whether atinib treatment in parental cells and combination treatments in ner-atinib-resistant cells have similar effects grown in 3D culture. We initially confirmed that acquired resistance to neratinib in SKBR3R and BT474R cells did not interfere with the growth and spheroid formation in Algimatrix 3D culture plates (Fig. 3d). Because higher concentrations of drugs are required to induce cell death in cells grown as spheroids, we next determined the cytotoxic effect of neratinib in parental and neratinib-resistant cell spheroids. alamarBlue assays demonstrated that 4μM neratinib elicited significant levels of cell death in parental cells and we used this concentration accordingly in further experiments with neratinib-resistant cell spheroids. Neratinib plus SCH772984 in SKBR3R cell spheroids and neratinib plus SCH772984 plus ABT-737 in BT474R cell spheroids led to substantial cell death as evident by ala-marBlue viability assays (Fig. 3d). Consequently, caspase-3 and cas-pase-9 were activated in response to neratinib plus SCH772984 treat-ment in SKBR3R cell spheroids and neratinib plus SCH772984 plus ABT-737 treatment in BT474R cell spheroids.
3.5. BCL-2 protein family protein-protein interaction network is altered in neratinib-resistant cells
The protein-protein interaction patterns of BCL-2 protein family members dictate mitochondrial outer membrane permeabilization and the translocation of cytochrome c into cytosol. Therefore, we tested whether acquired resistance to neratinib in HER2+ breast cancer cells induced a change in these protein-protein interaction patterns that correlated with divergent apoptotic blocks. As shown in Fig. 4a, a substantial amount of BIM was bound by BCL-2, BCL-XL and MCL1 before treatment with neratinib in SKBR3 cells. Treatment with ner-atinib caused dissociation of the BCL-2/BIM and BCL-XL/BIM com-plexes. We did not detect any change in MCL1/BIM complex. Note in-creased amount of BIM was bound by MCL1 in SKBR3R cells and displacement of BIM from BCL-2 and BCL-XL was not detected. In ZR-75-30 cells, BIM was mostly bound to BCL-2 in untreated cells and treatment with neratinib led to decreased BCL-2/BIM interaction (Fig. 4b). BCL-XL/BIM complex was not altered and MCL1/BIM inter-action slightly increased after treatment with neratinib. BIM was mostly complexed to MCL1 in neratinib-resistant ZR-75-30R cells and treat-ment with neratinib did not alter BCL-2/BIM, BCL-XL/BIM or MCL1/ BIM interactions. In addition, BCL-XL/PUMA and BCL-2/PUMA inter-actions decreased following treatment with neratinib in SKBR3, SKBR3R, ZR-75-30 and ZR-75-30R cells (Fig. 4a,b). Although MCL1/ PUMA interaction was diminished in response to neratinib treatment in SKBR3 cells, we did not observe a similar response in SKBR3R cells. Of note, we did not detect any alteration of MCL1/NOXA complexes upon treatment with neratinib in SKBR3, SKBR3R, ZR-75-30 and ZR-75-30R cells. BIM was complexed to BCL-2, BCL-XL and MCL1 in BT474 cells and exposure to neratinib resulted in decreased 2/BIM and BCL-XL/BIM complexes without any effect on MCL1/BIM complex (Fig. 4c). However, BIM was mostly bound to BCL-XL in BT474R cells along with
decreased BCL-2/BIM and MCL1/BIM complexes. We found that ner-atinib treatment did not alter any of these complexes in BT474R cells and BIM remained mostly bound to BCL-XL. Neratinib exposure led to decreased BCL-XL/PUMA and BCL-2/PUMA complexes in BT474 cells, but no such effect was seen in BT474R cells along with increased se-questration of PUMA by BCL-2 and BCL-XL. MCL1/NOXA interaction was reduced in BT474 and BT474R cells upon treatment with neratinib. Next, we tested the effect of ABT-737 on 2/BIM, XL/BIM, BCL-2/PUMA and BCL-XL/PUMA interactions when combined with ner-atinib plus SCH772984 in BT474R cells. Our results demonstrated that adding ABT-737 to neratinib plus SCH772984 resulted in displacement of BIM and PUMA from BCL-2 and BCL-XL (Supplemental Fig. S6). As demonstrated in Fig. 4d, BH3 profiling data indicated decreased re-sponse to BIM and BAD peptides along with increased loss of MMP in response to NOXA peptide exposure through the progress of developing neratinib-resistance in SKBR3R and ZR-75-30R cells. Furthermore, we demonstrated increased MCL1 levels, decreased BIM and PUMA levels together with reduced mitochondrial cell death priming through the course of development of resistance. Thesefindings support our find-ings that MCL1 upregulation in SKBR3R and ZR-75-30R cells is primary driving event that promotes resistance to neratinib-induced apoptosis in these cells. Contrary to SKBR3R and ZR-75-30R, we observed increased response to BAD and HRK as well as decreased response to BIM as the cells became more resistant to neratinib (Fig. 4d). This response profile of BT474R mitochondria posits that increased BCL-2 and BCL-XL levels lead to mitochondrial cell death block in BT474R cells. Note that BH3 profiling strategy successfully monitored the progressive development of resistance to neratinib in HER2+ breast cancer cells Furthermore, we demonstrated that increased BCL-2 and BCL-XL as well as decreased BIM and PUMA complements the development of resistance to neratinib in BT474R cells (Fig. 4d).
4. Discussion
The efficiency of HER2-targeting therapies in breast cancer is lim-ited by the development of acquired resistance throughout the course of treatment as well as the presence of de novo resistance to drugs. PanHER inhibitors have been recently developed to target all four HER family members simultaneously. Neratinib (Nerlynx) is an oral, irreversible panHER inhibitor and was recently approved in the USA for extended adjuvant treatment of patients with HER2+ early-stage breast cancer who received a previous trastuzumab-based adjuvant therapy [20]. Several ongoing clinical trials are currently evaluating the efficiency of neratinib in the metastatic, adjuvant and neoadjuvant settings in breast cancer as well as in other solid tumors (a comprehensive list of active clinical trials of neratinib is provided in [20]). Thus, identifying me-chanisms of acquired resistance to panHER inhibitors is of critical im-portance to increase therapeutic response in HER2+ breast cancer. We provide evidence here that acquired resistance to neratinib is mediated by activation of ERK1/2 in SKBR3R and ZR-75-30R cells although both PI3K/Akt and ERK1/2 pathway are activated in BT474R cells. Neratinib treatment inhibited HER family members effectively in neratinib-re-sistant cells and these data suggest that persistent activation of down-stream signaling pathways in neratinib-resistant cell lines is not coupled to recalcitrant activation of upstream HER family receptor tyrosine kinases. In fact, several mechanisms have been shown to mediate Fig. 2. Inhibition of BCL-2/BCL-XL is required for induction of apoptosis in BT474R cells in addition to neratinib plus SCH772984 treatment. a) SKBR3 cells were treated with neratinib (1μM) and SKBR3R cells were treated with neratinib (1 μM), SCH772984 (1 μM) or the combination of neratinib (1 μM) and SCH772984 (1μM) for 48 h. Cell death response was evaluated by Annexin V/PI staining and flow cytometry. b) ZR-75-30 cells were treated with neratinib (1 μM) and ZR-75-30R cells were treated with neratinib (1μM), SCH772984 (1 μM) or the combination of neratinib (1 μM) and SCH772984 (1 μM) for 48 h. Cell death response was evaluated by Annexin V/PI staining andflow cytometry. c) BT474 cells were treated with neratinib (1 μM) and BT474R cells were treated with neratinib (1 μM), SCH772984 (1μM), ABT-737 (0.5 μM), neratinib plus SCH772984, ABT-737 plus neratinib, SCH772984 plus ABT-737 or the combination of neratinib (1 μM), SCH772984 (1μM) and ABT-737 (0.5 μM) for 48 h. Cell death response was evaluated by Annexin V/PI staining and flow cytometry. Results are representative of three independent experiments.
b
Cytochr ome c CoxIV SKBR3 SKBR3R Neratinib 1µM - - + + - - + + M C M C M C M C SKBR3R Cytochr ome c CoxIV Neratinib 1µM - - + + - - + + SCH772984 1µM - - - - + + + + Cytochr ome c CoxIV ZR-75-30 ZR-75-30R M C M C M C M C Neratinib 1µM - - + + - - + + M C M C M C M C ZR-75-30R Cytochr ome c CoxIV Neratinib 1µM - - + + - - + + SCH772984 1µM - - - - + + + + Cytochr ome c CoxIV BT474 BT474R M C M C M C M C Neratinib 1µM - - + + - - + + M C M C M C M C M C BT474R Cytochr ome cCoxIV Neratinib 1µM - - + + - - - - + + SCH772984 1µM - - - - + + - - + + ABT
-737 0.5 µM - - - - - - + + + + 0 1000 2000 3000 4000 5000 6000 7000 8000 9000 10000 Control Neratinib SCH772984 Neratinib + SCH772984
Caspase activity (RFU)
Caspase-3 Caspase-9 Caspase-8
0 1000 2000 3000 4000 5000 6000 7000 8000 9000 10000 Control Neratinib SCH772984 Neratinib + SCH772984
Caspase activity (RFU)
Caspase-3 Caspase-9 Caspase-8
0 1000 2000 3000 4000 5000 6000 7000 8000 9000 10000 Control Neratinib SCH772984 ABT -737 Neratinib + SCH772984 Neratinib + ABT -737 ABT -737 + SCH772984 Neratinib + ABT -737+ SCH772984
Caspase activity (RFU)
Caspase-3 Caspase-9 Caspase-8
SKBR3R ZR-75-30R BT474R ** * ** ** * * *** ** 15 kDa 15 15 kDa 15 kDa 15 15 15 kDa 15 15 kDa 15 15 kDa 15
a
(caption on next page)resistance to HER2-targeting therapies in HER2+ breast cancer. For instance, heregulin-mediated activation of EGFR-HER3-PI3K signaling has been shown to mediate acquired lapatinib-resistance in HER2+ breast cancer cells [7]. Moreover, persistent Akt Thr308 phosphoryla-tion, but not Akt Ser473 phosphorylation was shown to accompany constitutive activation of EGFR-HER3-PI3K signaling in lapatinib-re-sistant cells. Additionally, depletion of HER3 by means of RNA inter-ference or treatment with panHER inhibitor neratinib restored sensi-tivity to apoptosis in lapatinib-resistant breast cancer cells. Thus, inhibition of other HER coreceptors including HER3 is necessary for efficient anti-HER2 therapy. Supporting this concept, HER3 levels were found to be upregulated in primary HER2+ tumor samples obtained from patients treated with lapatinib as well as in BT474 xenografts treated with lapatinib [35]. In these experimental models, increased HER3 levels were mediated by inhibition of PI3K/Akt and activation of FoxO3a. Furthermore, depletion of HER3 by RNAi or neutralization of HER3 by AMG-888 monoclonal antibody led to enhanced inhibition of HER3, Akt and ERK1/2 phosphorylation accompanied by increased apoptotic response to lapatinib treatment [35]. We detected increased HER3 levels in SKBR3R and ZR-75-30R cells compared with parental cell lines, but this increase in HER3 did not alter the phosphorylation of HER3 or other HER family members in response to neratinib. Therefore, HER3-mediated escape did not seem to explain the activation of ERK1/ 2 pathway in neratinib-resistant cells. Moreover, increased HER4 levels and nuclear translocation of HER4 were shown to promote resistance to trastuzumab treatment in SKBR3 and BT474 cells [9]. Neratinib po-tently prevented upregulation and nuclear localization of HER4 in SKBR3 cells and BT474 xenografts, potentiating the antitumor effects of trastuzumab. Neratinib treatment for 24 h also led to downregulation of HER2 expression along with suppression of HER2 signaling and in-duction of apoptosis in HER2+ breast cancer cells [36]. This effect of neratinib was shown to be mediated by ubiquitination and dynamin-independent endocytosis of HER2 following dissociation of HSP90 from HER2. We did not observe any alteration of HER2 expression in par-ental cell as we treated the cells for only 2 h to monitor the activation of HER receptors. But it is possible that downregulation of HER2 by pro-longed neratinib treatment contributes to cell death response in par-ental HER2+ cells.
Heretofore, two studies have been reported exploring the mechan-isms of neratinib resistance in breast cancer cells. In thefirst report, acquired neratinib-resistant HCC1954-NR and EFM192A-NR cells were shown to be cross-resistant to afatinib and lapatinib [37]. Furthermore, decreased expression of HER family members and increased activity of CYP3A4 were detected in neratinib-resistant variants in comparison with parental cells. In contrast, we did not observe any decrease in baseline expression levels of HER family members in our
neratinib-resistant cells. Indeed, there was a slight increase in HER3 expression in BT474R cells. We utilized verapamil to exclude the possibility of re-sistance development through activation or upregulation of drug pumps in our resistant cell lines. However, we did not have the chance to evaluate the activity of CYP3A4 in parental and neratinib-resistant cells. Therefore, it is possible that increased CYP3A4 activity may also contribute to the neratinib-resistant phenotype in our cells. Secondly,
HER2T798Imutation was shown to be acquired during neratinib therapy
in a patient with ER+/PR+, HER2 non-amplified lobular breast car-cinoma, leading to neratinib resistance [10]. Binding of neratinib to HER2 was abrogated as a consequence of HER2T798Imutation-mediated steric hindrance and consistent with this finding, MCF10A cells ex-pressing HER2T798I were less sensitive to neratinib along with
in-sufficient inhibition of HER2. In this study, we also assessed whether acquired resistance to one class of panHER inhibitor also confers re-sistance to other panHER inhibitors. Dacomitinib (1μM) has been de-monstrated to inhibit phosphorylation of EGFR, HER2, HER4, Akt and ERK1/2, induce cell cycle arrest and apoptosis in HER2-amplified SKBR3, BT474 and ZR-75-30 cells [21]. Besides, dacomitinib treatment successfully overcame acquired resistance to trastuzumab and lapatinib in SKBR3 and BT474 cells along with inhibition of HER receptor family members and PI3K/Akt and ERK1/2 signaling pathways. Dacomitinib was also shown to inhibit EGFR, HER2, HER3 and HER4 phosphor-ylation and induce apoptosis in OVCAR3, SKOV3 and A2780CP epi-thelial ovarian cancer cells but downstream signaling pathways were not investigated in this study [38]. We found that neratinib-resistant cells were also resistant to dacomitinib, which confirms the presence of a common prosurvival pathway conferring resistance to panHER in-hibition. Consistent with our data with neratinib, inhibition of ERK1/2 by SCH772984 in SKBR3R and ZR-75-30R restored sensitivity to da-comitinib. Whereas inhibition of ERK1/2 by SCH772984 alone was ineffective at restoring sensitivity to dacomitinib in BT474R cells, BCL-2/BCL-XL inhibition by ABT-737 combined with SCH772984 led to enhanced dacomitinib-induced apoptotic response. Reasoning that cells expressing HER2T798Iwere sensitive to afatinib treatment [10], we can
argue that HER2T798Imutation is not involved in neratinib-resistance in our model because neratinib-resistant cells were cross-resistant to da-comitinib and HER2 phosphorylation was equally suppressed in par-ental and neratinib-resistant cells.
It was shown that HCT116 cells with acquired resistance to lapa-tinib had increased expression of MCL1 and decreased expression of BAX [24]. Enforced expression of constitutively active Akt and MEK1 inhibited lapatinib-induced cell death. Similar to our results, EGFR phosphorylation in response to EGF stimulation was inhibited by la-patinib exposure in both parental and lala-patinib-resistant HCT116 cells. Furthermore, knockdown of MCL1 led to increased cell death in Fig. 3. Combination of neratinib, SCH772984 and ABT-737 reactivates mitochondrial apoptotic pathways in neratinib-resistant cells. a) SKBR3 and SKBR3R cells (upper panel), ZR-75-30 and ZR-75-30R cells (middle panel) were treated with neratinib (1μM) or SCH772984 (1 μM) or the combination of neratinib (1 μM) and SCH772984 (1μM) for 48 h. BT474 and BT474R cells (lower panel) were treated with neratinib (1 μM) and BT474R cells were treated with neratinib (1 μM), SCH772984 (1μM), ABT-737 (0.5 μM) or the combination of neratinib (1 μM), SCH772984 (1 μM) and ABT-737 (0.5 μM). Cytosolic and mitochondrial fractions were blotted for cytochrome c. CoxIV was probed as loading control for mitochondrial fractions. b) SKBR3R cells (upper panel) and ZR-75-30R cells (middle panel) were treated with neratinib (1μM) or SCH772984 (1 μM) or the combination of neratinib (1 μM) and SCH772984 (1 μM) for 36 h. BT474R cells (lower panel) were treated with neratinib (1μM), SCH772984 (1 μM), ABT-737 (0.5 μM) or the combination of neratinib (1 μM), SCH772984 (1 μM) and ABT-737 (0.5 μM). Activation of caspase-3, caspase-9 and caspase-8 was evaluated byfluorometric caspase activation assays. Columns, mean relative fluorescence units from three independent experiments; bars, SE; *P < 0.05, **P < 0.01, ***P < 0.001. c) SKBR3 and SKBR3R cells, ZR-75-30 and ZR-75-30R cells (upper panel) were treated with neratinib (1μM) or SCH772984 (1 μM) or the combination of neratinib (1 μM) and SCH772984 (1 μM) for 16 h. BT474 and BT474R cells (lower panel) were treated with neratinib (1μM), SCH772984 (1 μM), ABT-737 (0.5 μM) or the combination of neratinib (1 μM), SCH772984 (1 μM) and ABT-737 (0.5 μM). Clonogenic survival was assessed by colony-forming assay. Data presented are percentage of colony formation normalized to untreated control cells. Columns, mean number of colonies (% of untreated control) from three independent experiments; bars, SE; ***P < 0.001. d) SKBR3, SKBR3R, BT474 and BT474R cells were grown in 3D Algimatrix culture plates. Microscopic evaluation of spheroids was performed to verify that acquired resistance to neratinib did not interfere with 3D growth of breast cancer cells. Scale bars, 100μm. Cell viability was evaluated in spheroids following treatment with different concentrations of neratinib by means of alamarBlue assay (upper panel). Results are mean values from three independent experiments; bars, SE. SKBR3R spheroids were treated with treated with neratinib (4μM) or SCH772984 (4 μM) or the combination of neratinib (4μM) and SCH (4 μM) for 48 h. BT474R spheroids with neratinib (4 μM), SCH (4 μM), ABT-737 (2 μM) or the combination of neratinib (4μM), SCH772984 (4 μM) and ABT-737 (2 μM). Cell viability was evaluated by using alamarBlue assay (middle panel) and activation of caspase-3, caspase-9 and caspase-8 was evaluated byfluorometric caspase activation assays (lower panel). Columns, mean cell viability (% of untreated control) or mean relative fluorescence units from three independent experiments; bars, SE; **P < 0.01, ***P < 0.001.
BT474 BT474R ZR-75-30 ZR-75-30R SKBR3 SKBR3R Neratinib 1µM - + - + + SCH772984 1µM - - - - + Neratinib 1µM - + - + + SCH772984 1µM - - - - + ABT-737 0.5 µM - - - - + 0 20 40 60 80 100 120 Neratinib SCH772984 Neratinib + SCH772984
Number of colonies (% of control)
0 20 40 60 80 100 120 Neratinib SCH772984 Neratinib + SCH772984
Number of colonies (% of control)
0 20 40 60 80 100 120
Neratinib SCH772984 ABT-737 Neratinib + SCH772984 +
ABT-737
Number of colonies (% of control)
c
SKBR3R ZR-75-30R BT474Rd
SKBR3 SKBR3R BT474 BT474R 0 10 20 30 40 50 60 70 80 90 100 110 120 Neratinib SCH772984 Neratinib + SCH772984 Cell V iability (% of untr eated contr ol) SKBR3R 0 10 20 30 40 50 60 70 80 90 100 110 120Neratinib SCH772984 ABT-737 Neratinib + SCH772984 Neratinib + ABT-737 ABT-737 + SCH772984 Neratinib + ABT-737+ SCH772984 Cell V iability (% of untr eated contr ol) BT474R 0 1000 2000 3000 4000 5000 6000 7000 8000 9000 10000
Control Neratinib SCH772984 Neratinib + SCH772984
Caspase activity (RFU)
Caspase-3 Caspase-9 Caspase-8 0 1000 2000 3000 4000 5000 6000 7000 8000 9000 10000
Control Neratinib SCH772984 ABT-737 Neratinib + SCH772984 Neratinib + ABT-737 ABT-737 + SCH772984 Neratinib + ABT-737+ SCH772984
Caspase activity (RFU)
Caspase-3 Caspase-9 Caspase-8 SKBR3R BT474R 0 10 20 30 40 50 60 70 80 90 100 110 120 0 0.5 1 2 4 8 12 Cell V iability (% of untr eated contr ol) Neratinib [µM] SKBR3 SKBR3R 0 10 20 30 40 50 60 70 80 90 100 110 120 0 0.5 1 2 4 8 12 Cell V iability (% of untr eated contr ol) Neratinib [µM] BT474 BT474R *** *** *** ** ** ** *** *** ***** Fig. 3. (continued)
a
Neratinib 1µM - + - + BCL-2 BCL-XL MCL1 BIM SKBR3 SKBR3R BIM BIM IP:BCL-2 IB:BCL-2 IP:BCL-XL IB:BCL-XL IP:MCL-1 IB:MCL-1 IP:BCL-XL IB:BIM IP:MCL-1 IB:BIM IP:BCL-2 IB:BIM IP:MCL-1 IB:NOXA Neratinib 1µM - + - + PUMA PUMA PUMA SKBR3 SKBR3R IP:BCL-2 IB:PUMA NOXA IP:BCL-XL IB:PUMA IP:MCL-1 IB:PUMA Inputs Neratinib 1µM - + - + BCL-2 BCL-XL MCL1 BIM SKBR3 SKBR3R Actin PUMA NOXA kDa 25 35 35 25 15 10 25 55b
Neratinib 1µM - + - + BCL-2 BCL-XL MCL1 BIM ZR-75-30 ZR-75-30R BIM BIM IP:BCL-2 IB:BCL-2 IP:BCL-XL IB:BCL-XL IP:MCL-1 IB:MCL-1 IP:BCL-XL IB:BIM IP:MCL-1 IB:BIM IP:BCL-2 IB:BIM Neratinib 1µM - + - + PUMA PUMA PUMA IP:BCL-2 IB:PUMA NOXA IP:MCL-1 IB:PUMA IP:MCL-1 IB:NOXA IP:BCL-XL IB:PUMA ZR-75-30 ZR-75-30R Neratinib 1µM - + - + BCL-2 BCL-XL MCL1 BIM Actin ZR-75-30 ZR-75-30R Inputs PUMA NOXA kDa 25 35 35 25 15 25 10 55 Neratinib 1µM - + - + BCL-2 BCL-XL MCL1 BIM BT474 BT474R BIM BIM IP:BCL-2 IB:BCL-2 IP:BCL-XL IB:BCL-XL IP:MCL-1 IB:MCL-1 IP:BCL-XL IB:BIM IP:MCL-1 IB:BIM IP:BCL-2 IB:BIM Neratinib 1µM - + - + PUMA PUMA PUMA IP:BCL-2 IB:PUMA NOXA IP:MCL-1 IB:PUMA IP:MCL-1 IB:NOXA BT474 BT474R Neratinib 1µM - + - + BCL-2 BCL-XL MCL1 BIM Actin BT474 BT474R Inputs PUMA NOXA kDa 25 35 35 25 15 25 10 55c
response to lapatinib treatment along with activation of BAX and BAK. BIM induction through inhibition of ERK1/2 signaling was shown to be required for EGFR tyrosine kinase inhibitor-induced apoptosis in non-small cell lung cancer [39–42]. Of note, BIM knockdown by means of RNA interference notably inhibited lapatinib-induced apoptosis in HER2+ breast cancer cells [43]. Consistent with our findings in BT474R cells with neratinib resistance, inhibition of MEK/ERK pathway triggered increased BIM levels and suppressing PI3K/Akt pathway led to downregulation of survivin expression. PUMA was shown to be involved in gefitinib-induced apoptosis in head and neck cancer cells as well as in osimertinib-induced apoptosis in colon cancer cells [44,45]. Correspondingly, our results demonstrated that both BIM and PUMA were required for neratinib-induced cell death in HER2+ breast cancer cells (Supplemental Fig. S3a, b). Using a high-throughput siRNA screening approach in BT474 cells, Berns et al. identified acti-vation of PI3K/Akt pathway due to loss of PTEN or aberrant actiacti-vation of PIK3CA as a prominent mediator of trastuzumab resistance [46]. Moreover, they demonstrated that patients receiving trastuzumab-based treatment have shorter progression-free survival if they have tumors with activated PI3K pathway as a result of PTEN loss or acti-vating PIK3CA mutations. In case of EGFR mutant non-small lung cancer cells, PI3K inhibition was shown to induce MCL1 down-regulation independent of Akt signaling and MEK inhibition was shown to lead to BIM upregulation [47]. Importantly, simultaneous inhibition of both pathways was necessary to induce cell death in EGFR-mutated non-small cell lung cancer cells. SCH772984 has been identified as a selective inhibitor of ERK1/2, which not only inhibits kinase activity of ERK1/2 but also abrogates MEK-mediated phosphorylation of ERK1/2 [48]. In addition, SCH772984 treatment efficaciously elicited anti-tumor effect in BRAF and KRAS mutant cells and xenografts together with inhibition of ERK1/2 kinase activity. Phospho-ERK reactivation was shown to be fundamental for the development of resistance against BRAF inhibitor plus MEK inhibitor combination therapy in BRAF-mu-tant A101D melanoma cells and SCH772984 competently circumvented therapy resistance in these cells [48]. We observed that treatment of neratinib-resistant cell with SCH772984 restored BIM and PUMA ex-pression and when combined with neratinib, reactivated mitochondrial apoptosis in SKBR3R and ZR-75-30R cells together with decreased MCL1 levels. Thus, we hypothesize that BIM and PUMA is under the regulation of ERK1/2 in SKBR3R and ZR-75-30R cells but concomitant inhibition of HER tyrosine kinases and ERK1/2 is necessary to down-regulate MCL1 expression and induce cell death. Given that upregula-tion of BCL-2 and BCL-XL rather than MCL1 was detected in BT474R cells, further neutralization of BCL2/BCL-XL by BH3 mimetic ABT-737 was required to promote cell death in these cells. Our findings de-monstrated that treatment of BT474R cells with BCL-XL inhibitor or BCL-2 inhibitor in combination with neratinib plus SCH772984 did not induce cell death in BT474R cells. Thus, these findings revealed that concurrent upregulation of BCL-2 and BCL-XL in BT474R cells leading to sequestration of BIM or PUMA displaced from one of them by the other. Deregulation of BIM, BCL-XL, BCL-2, MCL1, PUMA and NOXA expression at transcriptional and posttranslational levels may confer resistance to mitochondrial apoptosis. Accordingly, we examined the protein stability and mRNA levels of these BCL-2 proteins in parental and neratinib-resistant cells. We found that reduced BIM expression in neratinib-resistant cells was due to decreased protein stability coupled to sustained activation of ERK1/2 and decreased PUMA expression was mainly triggered by decreased PUMA mRNA levels. On the other hand,
increased MCL1, BCL-2 and BCL-XL levels were mediated by increased protein stability, increased transcription or both. We observed di ffer-entially regulated NOXA levels in HER2+ breast cancer cells with ac-quired resistance to neratinib. NOXA was upregulated in ZR-75-30R cells, downregulated in BT474R cells and was not altered in SKBR3R cells (Fig. 1d). In ZR-75-30 cells, upregulation of NOXA could be ex-plained by increased protein stability, but we could not elucidate the mechanism behind NOXA downregulation in BT474R cells in the light of ourfindings. Altogether, these data suggest the presence of more than one molecular mechanism exist in neratinib-resistant cells pro-moting mitochondrial apoptotic block and concurrent targeting of these pathways is needed to overcome these resistance mechanisms.
We also demonstrated that protein-protein interaction between antiapoptotic BCL-2 proteins and BIM has changed in neratinib-re-sistant cells as we detected increased MCL1/BIM complexes in SKBR3R and ZR-75-30R cells. BCL-2/PUMA and BCL-XL/PUMA complexes were disrupted following neratinib treatment in SKBR3, SKBR3R, ZR-75-30 and ZR-75-30R cells. However, we found that MCL1/PUMA interaction was maintained in SKBR3R and ZR-75-30R cells in contrast to promi-nently decreased MCL1/PUMA interaction in SKBR3 and ZR-75-30 cells upon neratinib treatment (Fig. 4a, b). Thus, increased MCL1 also se-questers displaced PUMA from BCL-2 and BCL-XL in SKBR3R and ZR-75-30R cells. On the other hand, BIM was mostly bound to BCL-XL in BT474R cells along with decreased BCL-2/BIM and MCL1/BIM com-plexes. Our results suggest that BCL-XL is the primary antiapoptotic protein sequestering BIM in neratinib-resistant BT474R cells, but the mechanism promoting this selective dependence on BCL-XL remains to be clarified. Importantly, BCL-2/PUMA and BCL-XL/PUMA complexes were upregulated in BT474R cells and treatment with neratinib did not affect the amount of PUMA bound to BCL-2 or BCL-XL. We also iden-tified decreased MCL1/NOXA interaction in BT474 and BT474R cells in response to neratinib treatment (Fig. 4c). Considering the insensitivity of BT474R cells to neratinib, displacement of NOXA from MCL1 did not activate a significant cell death response due to alteration of other BCL-2 protein family members.
Exposing BH3 peptides derived from proapoptotic BH3-only pep-tides selectively binding to antiapoptotic BCL-2 proteins to mitochon-dria of cells and measuring mitochonmitochon-drial membrane potential con-stitute the main principle of BH3 profiling assay [49,50]. Hence, increased sensitivity to peptides indicates heightened mitochondrial cell death priming and predicts dependence to specific antiapoptotic BCL-2 proteins and response to cancer therapeutics [22,30,50]. The binding specificity of BH3 peptides allow us to determine the pro-survival BCL-2 protein on which the cells are dependent on for pro-survival. For instance, BAD BH3 peptide binds to BCL-2 and BCL-XL with high affinity whereas NOXA binds to MCL1. Our results revealed that ner-atinib-resistance SKBR3R and ZR-75-30R cells became more dependent on MCL1 together with decreased mitochondrial cell death priming and response to neratinib. On the other hand, increased response to BAD and HRK in neratinib-resistant BT474R cells indicated co-dependence to BCL-2 and BCL-XL, correlating with decreased mitochondrial cell death priming and acquisition of resistance to neratinib. Immunoblot analysis of BCL-2, BCL-XL, MCL1, BIM, PUMA and NOXA through the development of neratinib resistance demonstrated that changes in an-tiapoptotic and proapoptotic proteins complement mitochondrial apoptotic priming of HER2+ breast cancer cells. Notably, increased response to HRK in BT474R cells suggested more dominant BCL-XL dependence, which confirmed our coimmunoprecipitation results Fig. 4. Protein-protein interactions between BIM and antiapoptotic BCL-2 proteins are altered in neratinib-resistant HER2+ cancer cells. a) SKBR3 and SKBR3R cells, b) ZR-75-30 and ZR-75-30R, c) BT474 and BT474R cells were treated with neratinib (1μM) for 2 h and the interaction of BIM and PUMA with BCL-2, BCL-XL and MCL1 as well as interaction of NOXA with MCL1 was evaluated by coimmunoprecipitation assays. Inputs for coimmunoprecipitations were also subjected to immunoblot analysis and actin was probed as loading control. d) Mitochondrial priming of parental (SKBR3, ZR-75-30 and BT474) and neratinib-resistant cell lines (SKBR3R, ZR-75-30R, BT474R) were determined through the course of development of resistance (Day 0, 2 months, 5 months and 9 months). Columns, mean %ΔΨ loss from three independent experiments; bars, SE. Western blot analysis of BCL-2, BCL-XL, MCL1, BIM, PUMA and NOXA in neratinib-resistant cells was performed through the course of development of resistance. Actin was probed as a loading control.
SKBR3R
-40 -20 0 20 40 60 80 100BIM BAD HRK NOXA
% m loss -40 -20 0 20 40 60 80 100
BIM BAD HRK NOXA
% m loss -40 -20 0 20 40 60 80 100
BIM BAD HRK NOXA
% m loss -40 -20 0 20 40 60 80 100
BIM BAD HRK NOXA
%
m loss
Day 0
2 months
5 months
9 months
ZR-75-30R
Day 0
2 months
5 months
9 months
-40 -20 0 20 40 60 80 100
BIM BAD HRK NOXA
% m loss -40 -20 0 20 40 60 80 100
BIM BAD HRK NOXA
% m loss -40 -20 0 20 40 60 80 100
BIM BAD HRK NOXA
% m loss -40 -20 0 20 40 60 80 100
BIM BAD HRK NOXA
%
m loss
BT474R
Day 0
2 months
5 months
9 months
-40 -20 0 20 40 60 80 100
BIM BAD HRK NOXA
% m loss -40 -20 0 20 40 60 80 100
BIM BAD HRK NOXA
% m loss -40 -20 0 20 40 60 80 100
BIM BAD HRK NOXA
% m loss -40 -20 0 20 40 60 80 100
BIM BAD HRK NOXA
% m loss EC50 0.027 µM EC50 0.136 µM EC50 0.414 µM EC50 1.83 µM EC50 0.03 µM EC50 0.207 µM EC50 0.889 µM EC50 1.53 µM EC50 0.039 µM EC50 0.158 µM EC50 0.370 µM EC50 1.43 µM BCL-2 BCL-XL MCL1 BIM Actin PUMA NOXA
Day 0 2 months 5 months 9 months
Day 0 2 months 5 months 9 months
BCL-2 BCL-XL MCL1 BIM Actin PUMA NOXA
Day 0 2 months 5 months 9 months
BCL-2 BCL-XL MCL1 BIM Actin PUMA NOXA kDa 25 35 35 25 15 10 25 55 kDa 25 35 25 15 35 10 25 55 kDa 25 35 25 15 35 10 25 55