KADIR HAS UNIVERSITY
GRADUATE SCHOOL OF SCIENCE AND ENGINEERING
THE SOCIAL RETURN OF INVESTMENT METRICS: SUCCESSFUL SOCIAL
MEDIA MEASUREMENT
YASEMIN CENGİZ
Ya se m in C eng iz M S Thesi s 20 17
THE SOCIAL RETURN OF INVESTMENT METRICS: SUCCESSFUL SOCIAL
MEDIA MEASUREMENT
YASEMIN CENGİZ
B.S., Industrial Engineering, Kadir Has University, 2014 B.S., Computer Engineering, Kadir Has University, 2014
Submitted to the Graduate School of Kadir Has University In partial fulfillment of the requirements for the degree of
Master of Science in
Management Information Systems
KADIR HAS UNIVERSITY August, 2017
i
THE SOCIAL RETURN OF INVESTMENT METRICS: SUCCESSFUL
SOCIAL MEDIA MEASUREMENT
Abstract
The world economy has been formed based on needs, innovations, wars, and trends until today. Primary sector became stepping stone, industrial development forwarded economy to 2000’s and now, today, internet is shaping it with accordance to trends. If someone is aiming for an investment, clicking for stock market or F/X rate is too simple, if someone is looking for renting a house, it takes a few minutes to conclude, if someone is surfing for online shopping, there are many options to the point there it became too easy to buy. Therefore, companies and firms have started to put an emphasis to e-commerce to edge ahead from the competitors. Nowadays, almost all brands/companies are presenting online sales services to consumers, and one of the keys for surviving in this huge market is managing social media networks and guiding consumers with these tools; Facebook, Twitter, Instagram, YouTube etc.
Today, social media is becoming more than a place of entertainment and communication. Popular social media sites such as Facebook, Twitter and Instagram, which house millions of people from all corners of the world, have also become the focus of advertisers. Social media is now an essential part of our lives. Even when an employer recruits someone, he can first review the person's social media account and make various assessments. The employer can use the social media as a tool to earn money as the person chooses according to the social media account. Monetary counterparts have begun advertising through social circles, and the return of these ads to investors has been constantly researched and examined. Although advertisers and investors are removed from manipulated data from time to time, the results of the advertising campaign in social media can
ii
now be analyzed more healthily in various ways and the social media campaign ROI calculation process gives more accurate results.
The results from the calculations to give you the return that you spend on advertising are called "ROI". The ROI, which is the abbreviation of Return of Investment, is a concept that tells what an invested investment is as a return to investor. With an ROI, you can see how much profit you make or how much you suffer from an investment you make.
While the posters you put on a street can only be seen by people passing through that street, ads given to social media sites with a preference for successful targeting can be seen by all active users interested in that space. Social media ads offer more advantages in both measurement and return than classic ads. Social media ads offer more advantages in both measurement and return than classic ads. According to classical advertising concept; suppose you advertise on a billboard on the street, in a newspaper or on a television channel. It will take quite a long time to measure the return of this ad and you will have to spend as much money as you learn how to recycle these ads, and you will continue to invest in the same ad until you know you have failed because at first glance it is difficult to see that an advertising project failed. On the other hand, you can measure what an ad you give on social media brings back to you from the moment you advertise it. The return on each digital advertising campaign or ad investment you've made is crucial to your campaign metrics and future brand goals. Being able to measure your return on investment will help you in the same way that you will be new at the same time whether or not your campaign is efficient and where you should optimize your advertising campaigns.
It is easy to measure in a certain way the budget of your budgets, such as mobile video ads, natural advertising, programmatic advertising, etc., as you try to make a new marketing move for your brand and go through digital channels. It may also be true on paper, but this excess base will be far less reflective of the rate of
iii
return on investment. You'll also need more granular metrics to capture the big picture, such as viewership, engagement, brand awareness, brand image, website visits, fill in lead forms, and downloads.
Return on investment (ROI) is one of the most important factors for digital marketing as well as for traditional marketing because it tells us that our campaigns are not making money for us. If you do not earn it, it is a very critical operation to identify the causes and revise it to make it better. Of course, in order to be able to do all of these things, we need to efficiently measure the return on investment in our digital marketing campaigns.
My research is, “The social return on investment metrics: successful social media measurement”, and the time interval that I am observing resources and references is between 2010 to 2017.
iv
THE SOCIAL RETURN OF INVESTMENT METRICS: SUCCESSFUL SOCIAL
MEDIA MEASUREMENT
Özet
Dünya ekonomisi bugüne kadar ihtiyaçlara, yeniliklere, savaşlara ve trendlere dayalı olarak kurulmuştur. Birincil sektör adım attı, sanayi gelişimi 2000'li yıllara ekonomiyi yönlendirdi ve şimdi, bugün internet eğilimler doğrultusunda şekillendiriyor. Birisi bir yatırım yapmak isterse, borsa ya da döviz kuru için tıklamak çok basit, eğer birisi bir ev kiralamak istiyorsa, birinin çevrimiçi alışverişte sörf yapması halinde birkaç dakika sürer, pek çok seçenek vardır. Noktaya kadar satın almak çok kolay olmuştur. Bu nedenle, şirketler ve firmalar rakiplerinden öne çıkmak için e-ticarete önem vermeye başlamışlardır. Günümüzde neredeyse tüm markalar / şirketler tüketicilere online satış hizmetleri sunmakta ve bu büyük pazarda hayatta kalmanın anahtarlarından birisi sosyal medya ağlarını yönetmek ve bu araçları tüketicilere yönlendirmektir; Facebook, Twitter, Instagram, YouTube vb. Sosyal ağ analizi, pazarlama disiplinine düzenli olarak ilgi duyan bir konudur.
“Sosyal medya günümüzde bir eğlence ve iletişim alanı olmaktan çok öte bir hal almaya başladı. Dünyanın dört bir köşesinden milyonlarca insanı içinde barındıran Facebook, Twitter, Instagram gibi popüler sosyal medya siteleri reklam verenlerin de ilgi alanı haline geldi. Sosyal medya artık hayatımızın temel parçalarından biri oldu. Bir işveren, birisini işe alırken bile ilk olarak o kişinin sosyal medya hesabını inceleyip çeşitli değerlendirmelerde bulunabiliyor. İşveren, para vereceği kişiyi sosyal medya hesabına göre seçtiği gibi para kazanmak için de sosyal medyayı bir araç olarak kullanabiliyor. Sosyal mecralar üzerinden para karşılığı reklam işleri başladı başlayalı bu reklamların yatırımcıya
v
geri dönüşü sürekli araştırıldı ve incelendi. Zaman zaman manipülasyona uğrayan veriler ile reklam veren ve yatırımcı kaldırılsa da günümüzde sosyal medyadaki reklam kampanyasının sonuçları çeşitli yollarla daha sağlıklı analiz edilebiliyor ve sosyal medya kampanya ROI hesaplama işlemi daha doğru sonuçlar veriyor. Reklam için yaptığınız harcamanın size geri dönüş kazandırmasına yönelik hesaplamalardan çıkan sonuçlara “ROI” denmektedir.” (Hesaplama.com, 2016)the popula Return of Investment açılımının kısaltması olan ROI, yapılan bir yatırımın yatırımcısına geri dönüş olarak ne kazandırdığını söyleyen bir kavramdır. ROI oranı ile yaptığınız bir yatırımdan ne kadar kar ettiğinizi ya da ne kadar zarar ettiğinizi öğrenebilirsiniz.
Bir sokağa koyduğunuz afiş sadece o sokaktan geçen insanlar tarafından görülebilirken sosyal medya sitelerine başarılı bir hedefleme tercihi ile verilen reklamlar ise o alan ile ilgilenen bütün aktif kullanıcılar tarafından görülebilir. Sosyal medya reklamları hem ölçümleme hem geri dönüş açısından klasik reklamlardan daha çok avantaj sağlamaktadır. Klasik reklam anlayışına göre; sokaktaki bir bilboarda, bir gazeteye ya da bir televizyon kanalına reklam verdiğinizi varsayalım. Bu reklamın geri dönüşünü ölçümlemek oldukça uzun zaman alacak ve bu reklamların geri dönüşümünü öğrenene kadar oldukça büyük paralar harcamanız gerekecektir, geri dönüşümünü geç öğrendiğiniz bir reklam projesinin başarısız olduğunu ilk bakışta anlamak zor olacağı için başarısız olduğunuzu anlayana kadar aynı reklama yatırım yapmaya devam edersiniz. Diğer taraftan sosyal medyada verdiğiniz bir reklamın size geri dönüş olarak ne getirdiğini reklamı verdiğiniz andan itibaren ölçümleyebilirsiniz. Reklam için yaptığınız harcamanın size geri dönüş kazandırmasına yönelik hesaplamalardan çıkan sonuçlara “ROI” denmektedir. Return of Investment açılımının kısaltması olan ROI, yapılan bir yatırımın yatırımcısına geri dönüş olarak ne kazandırdığını söyleyen bir kavramdır. ROI oranı ile yaptığınız bir yatırımdan ne kadar kar ettiğinizi ya da ne kadar zarar ettiğinizi öğrenebilirsiniz.
vi
Markanız için yeni bir pazarlama hamlesine kalkışıyor ve dijital kanallar aracılığı ile taarruza geçiyor iseniz mobil video reklamları, doğal reklamcılık, programlı reklamcılık gibi mecralara ayırdığınız bütçelerin getirisini belirli oranda ölçmek kolaydır. Kağıt üzerinde doğru da görünebilir ancak bu fazla basite indirgenmiş düşünce yapısı yatırımın geri dönüş oranını yansıtmaktan uzak olacaktır (özellikle çok sayıda - düşük rakamlara satılan hızlı tüketim ürünleri pazarındaysanız). Büyük resmi görmek için görüntülenme, etkileşim, marka bilinirliği, marka imajı, web site ziyaretleri, lead formlarının doldurulma sayısı ve indirmeler gibi hikâyeyi bütünüyle anlatabilecek daha hassas metrikleri de hesaba katmanız gerekli.
Yatırım getirisi (ROI), dijital pazarlama için de geleneksel pazarlama için de en önemli unsurlardan biri çünkü kampanyalarımızın bize para kazandırıp kazandırmadığını söylüyor. Kazandırmıyorsa bunun sebeplerini tespit etmek ve daha iyi hale getirmek üzere revize etmek oldukça kritik bir operasyon. Tabi bütün bunları yapabilmek için, dijital pazarlama kampanyalarımızda yatırımın geri dönüşünü verimli bir şekilde ölçmemiz lazım.
Benim araştırma yaptığım soru, “Sosyal medyada yatırımın geri dönüş metrikleri: başarılı ölçümleme" ve kaynak ve referansları gözlemlediğim zaman aralığı 2010-2017 arasındadır.
vii
Acknowledgements
I would like to express my deep-felt gratitude to my advisor, Professor Doctor Hasan DAĞ of the Magament Information Systems Department at Kadir Has University. This thesis would not have been possible without his valuable guidance, constant motivation and constructive suggestions. He always gave me his time and support led me with constructive suggestions. I wish all students would benefit from his experience and ability.
Besides, I would like to thank all MIS Professors at Kadir Has University, for all supports they provided me throughout my all-academic and graduate career. Besides, I thank to my family for their supports and understanding on me in completing this project. Without any of them mentioned above, I would face many difficulties while doing this thesis.
viii
Table of Contents
Abstract ... i Özet ... iii Acknowledgements ... v Table of Contents ... viList of Figures ... vii
Introduction ... 1
Literature Review ... 5
Return of Investment Metrics on Social Media ... 8
Overview of Business Intelligence Structure ...14
Overview of Data Analysis ... 16
Overview of Algorithms and Insights ... 30
ix
LIST OF FIGURES
Figure 2.1: The Nielsen Report (2012)
Figure 2.2: Cluth 2016, study includes 304 social media marketers
Figure 2.3: Commonly used social media platforms, 2014 Smart Insights Blogg Figure 2.4: Which paid social media is most popular
Figure 4.1: Raw Data for Facebook Figure 4.2: Raw Data for YouTube Figure 4.3: Raw Data for Twitter
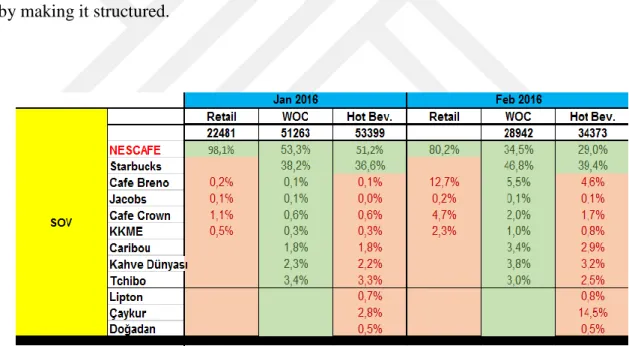
Figure 4.4: Categorized Share of Voice Data
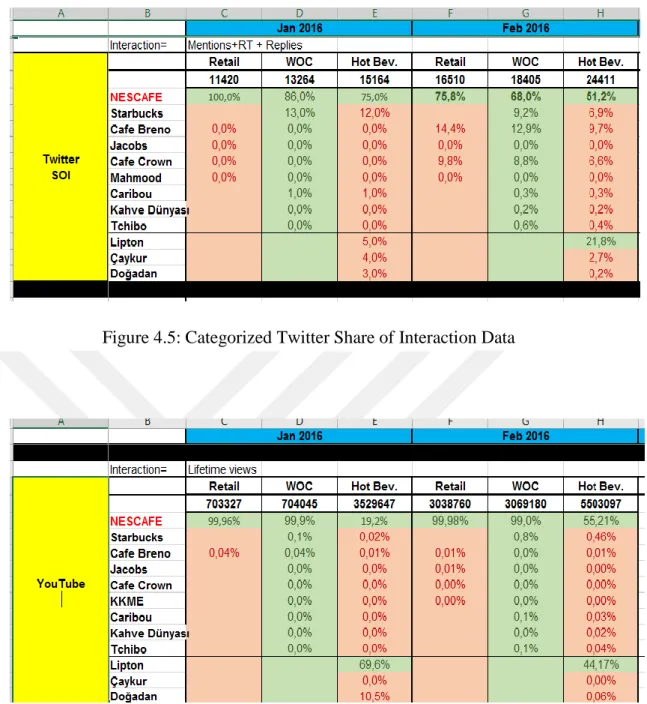
Figure 4.5: Categorized Twitter Share of Interaction Data Figure 4.6: Categorized Twitter YouTube Data
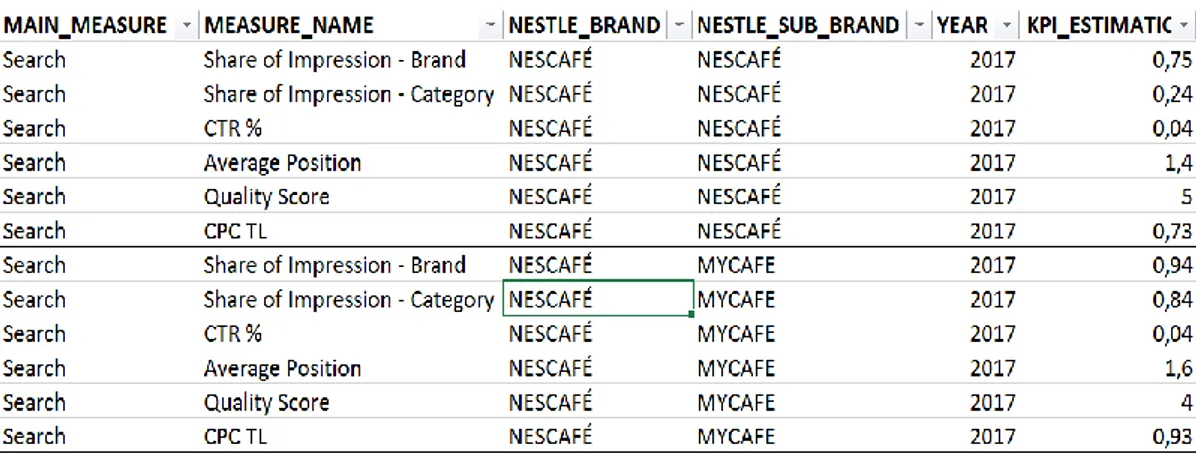
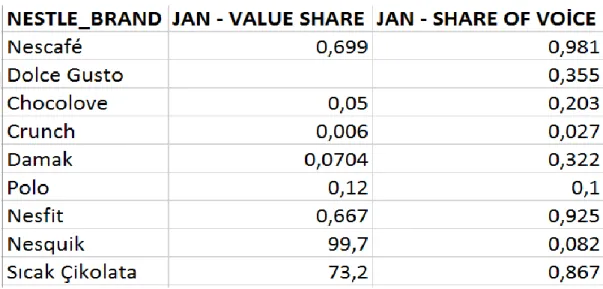
Figure 4.7: Categorized Twitter Facebook Data Figure 4.8: Structural KPI Measurement Data Source Figure 4.9: Structural Share of Impression Data Source Figure 4.10: Structural Channel Estimation Data Source Figure 4.11: Structural Nielsen Data Source
Figure 4.12: Stage Package in ETL Figure 4.13: Temporary Package
x Figure 4.14: Defect Management Package Figure 4.15: General Information in Package
Figure 4.16: Database connection in Connection Manager Figure 4.17: Data Flow in Package
Figure 4.18: Data Flow in Package
Figure 4.19: Staging Table at Nestle Database Figure 4.20: Temporary Table at Nestle Database Figure 4.21: Error Table at Nestle Database Figure 5.1: ETL Flowchart
Figure 5.2: Share of Voice Comparison Dashboard
Figure 5.3: Twitter Share of Interaction Comparison Dashboard Figure 5.4: YouTube Share of Views Comparison Dashboard Figure 5.5: Facebook Social Media Performance Dashboard
Figure 6.1: Facebook, Twitter and YouTube Performances,Jan 2016 Figure 6.2: Share of Voice on Digital World
Figure 6.3: Facebook, Twitter and YouTube Performances, December 2016 Figure 6.4: Twitter Share of Interaction, March 2017
Figure 6.5: YouTube Share of Views, March 2017 Figure 6.6: Facebook Performance, March 2017
xi
LIST OF ABBREVIATIONS AND GLOSSARY
CTR Click Through Rate CTR is the ratio of users who click on a specific link to the number of total users who view a page, e-mail, or
advertisement.
CPC Cost per Click CPC refers to the actual price you pay for each click in your pay-per-click marketing campaigns.
CPA Cost per Action CPA, also known as pay per action (PPA) and cost per conversion, is an online advertising pricing model where the advertiser pays for each specified action - for example:an impression, click, form submit, etc.
CPI Cost per Impression CPI is the cost or expense incurred for each potential customer who views the advertisement(s)
CPM Cost per Mille
CPM refers to the cost or expense incurred for every thousand potential customers who view the advertisement(s) CPV Cost per View CPV bidding is the default way to set the
price you will pay for your TrueView video ads.
AR Amplify Rate The ratio of the number of share a post to the number of users who interact with (like/share/comment on) a post. PER & VER Post and Video Engagement
Rate
The ratio of the number of users who interact with (like/share/comment && click on image, click on link on) a post to the number of users who see a post. ER (Twitter) Engagement Rate A tweet engagement rate is a formula
which allows to measure followers' engagement (Re-tweet, reply, like) towards brand tweets on Twitter. SOV Share of Voice SOV in online advertising is an ad
revenue model that focuses on weight or percentage of brand related talks amongst other advertisers.
xii
FB SOV Facebook Share of Voice FB SOV in online advertising is an ad revenue model that focuses on weight or percentage amongst other advertisers on Facebook social media platform.
TW SOI Twitter Share of Interaction TW SOI in online advertising is an ad revenue model that focuses on percentage of brand interactions (Re-tweet, replies, like) on Twitter amongst other advertisers on the same platform
YT SOV YouTube Share of Views YT SOV in online advertising is an ad revenue model that focuses on percentage of viewibility of brand's videos on
YouTube amongst other advertisers on the same platform.
1
Chapter 1
Introduction
The research is to find social media return of investment metrics for measurement. It does not compare social media return of investment. It only specifies return of investment metrics on social media. There are some used methods in the literature.
A lot of related articles and presentations are read and know-how is acquired. It is inevitable for marketing executives to use these platforms for marketing activities such as spending a significant portion of their time on the social media platforms of all ages, marketing these platforms to increase brand awareness, create brand loyalty, conduct consumer research, obtain information about competitors, and communicate viral videos or oral campaigns with company campaigns . The first step is to investigate and find which method will help more in the process. Detailed data analysis methode applied to make strategic decisions The most widely known, using the business intellegince proceses help to give insights from data. The business intellegince processes are examined and visualizing data to get direct insights are discussed.
The input is the data of the social media. The data gives the social media performances since 2016 to date. Share of voice data can be compared by using this data. There are various data anlaysis processes for creating quality data sets. Firstly, Facebook performance that includes different activities on it affected on marketing. All facebook activities are clustered by using this data. Then these methods are implemented the other social media channels which are Twitter and YouTube. In order to benefit from this data, data should be normalized. Then, it must be preprocessed. And after using the data, it should be post-processed.
An improvement to the clustering model is to use artificial data analysis methods. This method helps the research finding the most effective values. This helps the research make
2
the mesaurement process faster and more accurate. Moreover with this methods data can be visualized and controlled so good that data can be interpreted easier and better. This method benefit from business intellegince processes.
As an input that comes from Social Studio and Social Bakers applications that are following social media tool. They have all social media activities. They analyze your performance across Facebook, Twitter, Instagram, Pinterest, YouTube and VKontakte.They have data of comparing the social profiles against competitors. They have data of every Facebook Page post and Tweet about any set of keywords to track. These data prove the business impact of the social and digital activities with data integration on marketing. Analytics methods are used to find which social media channel is the most effective on marketing.
As the first step, a project planning is made. The steps that have to be taken are determined. Time planning is made. According to this plan, project progresses. Firstly, ETL(Extract, Transformation, Loading) is used for the project with cleasing and clustering data, then the project is realized by SAP Business Objects Web Intellegince tool with real values. Raw data cannot be used for the getting insights on the data. Some redundant data should be stripped from the main data. Furthermore data should be normalized. The normalization and cleansing of the data is one of the steps. By normalization,meaningful data is obtained.
Finding the best processes for creating quality data is also a step. Firstly, the most suitable clustering way has to be determined. Secondly, the most suitable data cleasing way has to be determined. The number of click, share, like or comments are in the input, output and data pool are determined. The optimum historical and real-time data in the data pool will give best results.
3 Analytics Method
1. Obtain data and data cleansing
The all historical data and real time data are extracted from Social Studio and Social Bakers. For three different “csv” file about activities of social media channels (Competitor Analysis, Performance Analysis and KPI Tracking) obtain data for the most effective channel. After that, redundant and unnecessary data must be cleansed and finally, necessary and helpful data will be obtained.
2. Data Preprocessing
Before using the data in the ETL tool, data must be preprocessed. After the data is preprocessed, it can be got better results easier.
• For every campaign, comments, videos and likes data is normalized. Process of Elimination :
• Process of elimination preserves exactly one copy of each previous extraction in the staging area for future use.
• During the next run, the process takes the entire source able(s) into the staging area and makes a comparison against he retained data from the last process. • Only differences (deltas) are sent to the data warehouse.
4
3. Realize algorithm by using Analysis for Office
An algorithm must be made if we want to train data in AFO. AFO ways are used to realize the algorithm which trains data.
4. Realize algorithm by using ETL tool
An algorithm must be made if we want to train data in ETL tool. 5. Visualize and Results
Final project stage is visualizing and to get insight form data. After using Webi tool to create dashboard.It can be seen which channel performance is the most effective on marketing.
5
Chapter 2
Literature Review
The amount you spend on social media marketing, and the efficiency of returning you and your mark to the time you've been talking. In short, it is also possible to describe the investments you make for social media as a return to you. Social media has enormous numbers of users and this means a sheer audience size therefore social media is a good opportunity for advertising. Kaplan and Haenlein defines social media as “a group of Internet-based applications that build on the ideological and technological foundations of Web 2.0 and that allow the creation and exchange of user-generated content (Kaplan & Haenlein, 2010, p. 59). Social media has interactive, participatory and collaborative
properties and it can be described as the communication which allows people to interact with each other and share information. Social media consists of networks such as Linkedin,
multimedia sharing sites such as Youtube, bookmarking sites such as Delicious and Digg and rating sites such as Yelp. Informations about products, services and brands can be shared by interaction between people. Tagginf, posting, pinning and tweeting are social media's important tools .By using these tools viral campaigns can be facilitated. Many fast growing companies actively use Twitter, Facebook, Youtube or blogs and some companies use them all. Organizations have the idea of customer involvement as main component for
organizational structure. Due to consumer involvement, performance of the brands can be measured.
Marketing investment in social media is increasing, yet marketers continue to struggle with the methodologies for validating these investments. In the absence of standardized best practices, some turn to ROI as a means of proving social contributions, but many benefits delivered by social media are not easily measured in dollars and cents (Ray, 2016). The best way to measure the impact of social media, as with other diverse efforts in the organization,
is through a wide range of metrics that are both directly and indirectly financial. In their 1996 book, The Balanced Scorecard: Translating Strategy into Action, Dr. Robert S. Kaplan and Dr. David P.
6
Norton offered an approach for avoiding narrow ROI-based performance management and instead presented a means to capture all of the benefits of corporate initiatives. The Balanced Scorecard they prescribed monitors business impact from four perspectives: financial,
customer, internal processes, and learning and growth. (Ray, 2016)
Social media is moving out of the experimentation stage and into the mainstream of
marketing strategies. The way we measure the contributions of social media programs must follow suit. This is what we can expect with respect to social media marketing metrics: · Metrics will gauge not just activity but outcome. Whenever an inflection point occurs in marketing technology, an explosion of creativity is experienced around measurement. As the technology matures, many new measures are abandoned in favor of traditional ones that align with business objectives and not simply technology. Counting fans and retweets are good tactical measures, but true social media measurement will come from gauging all outcomes in business terms.
·Not every social media program needs ROI to deliver business benefit. What is the ROI of your company’s Web sites? Fifteen years into the Internet age, it is likely your organization does not recognize the entire financial return it receives from its owned Web properties; despite that, the company continues to invest in redesigns, new sites, and Web technology because it must to keep up with customer expectations and the competition. Many social media activities — such as a presence in Facebook or listening programs — are becoming the new table stakes in the same manner, regardless of immediately available ROI metrics. (Ray, 2016)
For companies to anticipate and affect consumers in a way that is parallel with business goals, consumer's brand related activities must be understood. Different motivations on social media are stimulated by different brand-related activities. If brand managers know different sets of motivations, they can have the opportunity to anticipate consumers' brand experience and direct their preferences. It is important to understand consumer's motivation of using social media and moreover to build a social media campaign that targets consumers. This requires focus and strategic planning.
Customers' talk about social media space must be listened. Then relevant people about conversation with customers must be chosen. Social media users must be interacted with to build a community for the brand. Later members of the community must be talked
face-to-7
face. Finally success must be measured to understand overall performance. Goals and objectives must be checked.The popularity of social media makes it nearly impossible to do business without developing a brand presence on big name platforms. (Social Media Week, 2017)1January 2016, there were about 2.3 billion global social media users. “A new study on the state of social media marketing in 2016 reveals that nearly 80 percent say social media is more important than other digital marketing strategies, like search engine optimization (SEO), content creation, email, paid advertising, mobile apps, and a website, according to Clutch, a business-to-business (B2B) research firm.” (Social Media Week, 2017)
“Powerful online networking advertising requests building up a technique that is remarkable to your objectives. 2A standout amongst the most vital parts of this methodology is
web-based social networking channel arrangement. Facebook, Twitter, and YouTube are the main three most well known web-based social networking channels for medium-to-extensive organizations, as indicated by a similar Clutch study. These channels' notoriety gets from the quantity of clients on the stages and the sorts of substance the clients support.” (Social Media Week, 2017) “YouTube is the second largest search engine and is owned by Google, so it influences your SEO. 3Video is taking up more bandwidth on the Internet,” says Jeff Gibbard, President and Chief Strategist of True Voice Media, a social media marketing agency.
“[Video] is increasingly supporting businesses’ content strategies or being used as a content medium in place of writing and images.” (Jeff Gibbard)
Social media has begun to be used as a marketing tool by which companies can follow consumer considerations. Say (2015), In her study, Facebook which is the most commonly used social network in Turkey is used in what way by Fast-moving consumer goods (FMCG) firms and the effects of marketing activities on the customers have been researched. Meetings have been held by using interview technic with the FMCG firms, the effects of Facebook on consumers have been worked to define through firms’ perspective in the study. The strategy was succeed, Facebook increase firm recognition, it affects by positively on sales that was identified.
1 Social Media Site;
https://socialmediaweek.org/blog/2016/08/study-facebook-twitter-youtube-top-3-social-media-channels-u-s-companies/
2 Digital Newsletter,2016
8
Return of Investment Metrics on Social Media
In the early days of using social media for marketing, business best practices didn’t exist and determining ROI was elusive. While organizations were able to track the linear progression of basic indicators - fans, likes, clicks, and number of responses – it was challenging to associate any of these measures with ROI. Social can help so many areas of the business: drive brand awareness, grow revenue, promote brand loyalty, convey thought leadership, nurture leads, attract new employees, and enhance overall customer relations. Using a structured process, it’s possible to become a more socially mature organization with the ability to identify cross-channel attribution metrics to better understand customers and demonstrate ROI. According to research, ROI metrics can be listed as by social media; Facebook, Twitter, Youtube: FACEBOOK
- Post Engagement Rate - Video Engagement Rate
- Reach
- Amplify YOUTUBE
- Click Through Rate - Cost per View - Recordability - Viewability TWITTER
- Post Engagement Rate - Video Engagement Rate
- Reach
9
Social network websites
Social network web sites are established to create a social electronic environment where big communities communicate and interact. In social network websites people create their own domain and meet with other people and share materials with each other which can be shared in digital platforms such as photos, videos etc. Social networks are virtual environments in which individuals create public or half-public profile and can list other users and can see his and other user’s connection list and pass through these lists.
Today there are hundreds of local and foreign social network websites. These sites are categorized in two groups. First group is user based social network websites in which people interact with people with which they have personal ties. They don’t have a specific title like Facebook and Instagram and they address general users. Second group is group based social network sites which collect people around a hobby, an idea or a topic. They are established based on a specific interest and relationship. Their members are generally less than user based social networks and they have more strict rules. Linkedin is an example of this kind of social networks.
Thanks to social networks, salesman can follow consumer trends and can determine the factors which influence their preferences and ideas. Especially popular social networks have become a consumer market therefore consumers are willing to share their opinions and demands on these companies on the social network. Moreover, companies can have different influences on the users with marketing methods on social networks besides with traditional marketing methods.
SMG Knowledge (2012), In a study of the changes made in the internet made in 2011 to the behavior of consumers in the purchasing process: 89% of active internet users in Turkey do research on internet before purchasing, it has been determined that 62% thinks that
researching the product / brand that they are considering buying is the most important reason to use the internet.
10
Influence of social networks on consumer behaviours
Users can have friends who have similar interests and similar friends on social networks so that they have friend in virtual world as well as real physical world. Despite of this, people try to find and be friend with people who are somehow related to them rather than unknown people. It is accepted that people use Facebook as a tool to continue their current friendships rather than have more friends. This proves that social networks can be a good marketing tool in people’s daily life. Salesman try to find out how target consumer behave in social networks and how consumers are stationed. In a study which investigates friend influence on sale, consumers are investigated in 3 groups. First group isn’t affected by their friends’ purchase behaviors. Second group is greatly affected by the products their friends purchased and their consuming behaviours. Third group can influence people but is rather negatively influenced by other people’s purchasing behaviours. Socio-cultural factors which are influential on consumer behaviours are also influential on social networks. Therefore the social network’s influence on consumer behaviour are based on socio-cultural factors. Usage and proliferation of internet improved online users’ information and experience about internet. Today
consumers, before giving decision on purchasing can request help from other people, can be member of discussion groups for taking advice and help and can discuss their views. In surveys which investigate the influence of internet on users’ purchasing behaviours it is figured out that most people search internet before purchasing and many people think that the search for the product which they will purchase is the reason for internet use. Besides most people admit they write their comments and opinions in an online site about the products and brands,many people admit getting advice from someone whom they don’t know created positive views and some people admitted that advice from someone whom they don’t know provided him with information about the product/service. Social networks are seen as an advanced new marketing channel and they make marketing sensitive, personal and social. Social networks have consumers’ age, gender, marital status and demographic info and this condition allows consumers to reach consumers in most effective way. In some surveys most people admit that when they decide to buy they’re positively affected from their Facebook friends and it is figured out that a Facebook friend’s buying a specific product or advising users to go specific vendors seriously affected consumers. It is figured out that after consumers become a follower of specific brand in Twitter and Facebook, they advise this brand to others more often and them their tendency to purchase increased. People reach to
11
their favorite brands over social networks making them a marketing tool. And people made social networks a part of their life. Consequently arguments above prove the influence of social networks on consumers.
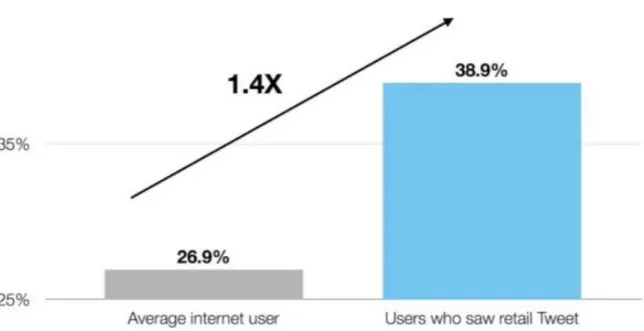
“Twitter is seen as a channel through which many brands can promote through sponsored advertising practices. According to the statement made by Twitter, the sales and user reach rates of advertising brands are on the rise. In Nielsen Report (2012), the table below clearly shows the rates:” (Nielsen, 2012)
Figure 2.1: The Nielsen Report (2012)
Benefits of Social Media Marketing
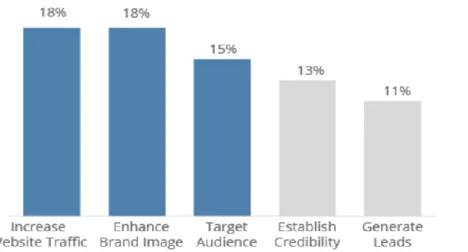
Social media has expansive advantages for organizations, from expanding movement to a site, enhancing clients' impressions of a brand, and focusing on potential and existing clients to bring issues to light about items and administrations.
12
Figure 2.2: Cluth 2016, study includes 304 social media marketers The chart below shows the most commonly used social media platforms, with the top 5 ranking as Facebook, Twitter, LinkedIn, YouTube and Blogging. Their annual survey has seen little change in the top 7, and this year new platforms have emerged including social media review sites including Yelp, short video from Vine and Snapchat and deal/voucher sites such as Groupon and Q&A Sites (Quora) (
http://www.smartinsights.com/social-media-marketing/social-media-governance/social-media-marketing-effectiveness-2014/)
Figure 2.3: Commonly used social media platforms, 2014 Smart Insights Blogg
13
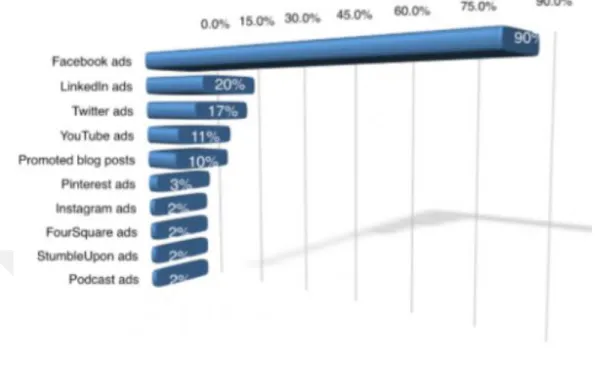
The most popular form of paid social media advertising amongst respondents is comfortably Facebook followed by Twitter and YouTube adverts (2014 Digital Reports) :
Figure 2.4: Which paid social media is most popular
Social Media for Business on Marketing : Facebook, Twitter and YouTube
In the event that you need to make a fruitful social technique, you ought to acclimate yourself with how each system runs, the sorts of groups of onlookers you can reach on that system and how the business can best utilize every stage.
Facebook is the huge social network on the web in total number of users. Considering that Facebook has a wealth of options for any type of organization, it is a great starting point for the business. Facebook can be used to share photos, videos, important company updates and more. Therefore, to find out more about Facebook for the business.
4In Business Newsletter (Jan, 2017), With Twitter, you can share short text updates (of 140
characters or fewer), along with videos, images, links, polls and more. Twitter is not only a
14
great way to market your business, but also an effective channel for handling customer service. Simply share links or media of the business.
YouTube
Danielle Corcione defined that YouTube: “Many businesses on YouTube have a creative, visual or educational component. The platform is heavily driven by creativity in nature, so it is important to have a tailored video editor producing content. However, your business does not need a channel to market on the platform. There is a subculture of vloggers, called YouTubers, who publish frequent videos and often maintain large audiences. Often, businesses collaborate with YouTubers for product placement, because these users already have engaged audiences.”
Overview of marketing methods on Social Medias
In this chapter, literature review about the marketing methods will be explained. It is a marketing method for promoting your product or service on social media sites and networks and for making sales, increasing brand awareness, promoting campaigns and news, and drawing attention. They have already been used before. Measures of reaching the target audience in the traditional media can be done on a limited number of subjects, and this measurement can be done in social media and internet marketing. After explaining theory of these methods, implementations of these methods are discussed.
In-depth Interview Method
Interview quality is the most frequently used technique in the research. Interview; Data collection through oral communication technique. According to another definition of interview is for a pre-determined, serious purpose, asking questions and continue a reciprocal and interactive communication with the response style. The reason for preferring this method is that in our country with newly launched social networks as a marketing tool. In detail, from the views and experiences of relevant existing firms be able to benefit. With this method, the useful information of data collection is obtained from the first source and provide the researcher with more information. This kind of data summarizes the attitudes and attitudes of the interviewer and interviewee as the high possibility of influencing information should be
15
taken into account. Interviews may be conducted by face-to-face, by telephone or other means of communication can be done.
There are many example, as one of them is the case of cloth companies in Turkey to use social media as a marketing tool. In the scope of the research, it is dealt with in the garment sector. The number of followers by examining the corporate Facebook pages of the companies is minimum 54 companies were found to be 5.000 and actively using their pages. Various questions were asked to the participant firm to try to understand the angle of the companies' views on Facebook. Tried to learn how to use features such as number of followers, like, share so on. As a result of interviews are that social media features which companies consider important and that they find most effective on consumers; number of followers, like, share, comments. As a result, social media increases company awareness and the company's sales. According to the research, social medias are more effectively used by ready-to-wear companies in Turkey. It is important for them to carry out marketing activities systematically with this channel.
Descriptive Research Method
The purpose of this model is to define the variables of the phenomenon to be examined and the relationships between these variables and to make forward-looking estimates based on this definition. In studies where this model is used it is often intended to determine the relationships between two or more variables. In such research, the main goal is not to investigate a cause-and-effect relationship in the subject, but to make definitions of the events of interest. The main difference that distinguishes this model from the exploratory model is that the problem and state variables are determined with exact lines. In some descriptive studies, indirect indirect observation methods can be used to obtain the necessary information and data. Observation can be done by personal or by using some mechanical tools.
Scanning Model
It is a research approach that aims to identify, in the past or at present, an existing situation that does not represent it, as it exists. Whatever is the subject of research, there is no way to change or influence them. The goal is to be able to observe and determine that thing correctly. The main purpose is to observe without changing. In the scanning model, science has made observations, establishing relationships between events, and reaching generalizations on controlled invariant relationships. A researcher working on the scanning model should refer
16
to the pre-recorded records of the thing being searched, as well as to examine directly what he is researching, to refer to the source of the field and to integrate and comment on his / her own observations. In this model, recording events as they are is the primary feature. The scanning model serves two purposes: To know the current terms and to solve the problem, explanation and so on. Gathering and summarizing the necessary information for the works. The scanning model is aimed at gathering a very wide range of information at a certain time.
Survey Techniuqe
Surveys are only one of the tools used to standardize observations in social sciences. The survey can be defined as a systematic data collection technique by directing questions to hypotheses established in a particular subject, or to the source who constitutes a universe or sample, depending on the questions. Questionnaires are also described as written data collection tools. The first thing a researcher will ask himself/herself before using the survey technique is that the required data can not be collected and collected with a more guaranteed technique. Often, the reliability of surveys is not much emphasized. That is why it is difficult to determine the degree of reliability in the questionnaire close to reality. It is easy to reach large masses through a survey and to base research on large groups. The written questionnaires allow respondents to review them repeatedly.
17
CHAPTER 3
Overview of Business Intelligence Structure
In this chapter, business intelligence processes will be explained. This is the theory part of the project. Etl tool are discussed. Besides, various data visualising methods are discussed. The details of validation sets and improving results are discussed for an optimal result.
Business Intelligence
Business intelligence applications can be considered the closest to the business process of the data analyst. Simply, people who do not have any technical knowledge about the computing world, who are responsible for the operation or management information that they can transfer to their information systems and use in their own business processes. It can be thought of as interfaces that communicate with data systems via interfaces. In many cases, business intelligence applications benefit directly from strategic and tactical decision making.
Business Intelligence Components
General components can be listed as follows :
Standardization, labeling and denormalization Statistical significance and probabilistic simulation Multidimensional joining and Allocation
Relationship between Data Warehouse and Business Intelligence
A great deal of business intelligence applications are part of data warehouse projects. Business intelligence transforms into useful information by taking raw data and provides strategic, tactical and operational views.
Extraction, Transformation, And Loading
Extraction, Transformation, and Loading (ETL) procedures are in charge of the operations occurring in the back phase of an information warehouse engineering. In an normal state portrayal of an ETL process, the data are extracted from the source data. After that, the extracted data are spreaded to an area of the warehouse. The last step is that the data are loaded to the data warehouse. ETL process refreshes the data warehouse.
18
Extraction is defined: “ The extraction step is conceptually the simplest task of all, with the goal of identifying the correct subset of source data that has to be submitted to the ETL workflow for further processing. As with the rest of the ETL process, extraction also takes place at idle times of the source system - typically at night. Practically, the task is of considerable difficulty, due to two technical constraints:
•the source must suffer minimum overhead during the extraction, since other administrative activities also take place during that period, and,
•5both for technical and political reasons, administrators are quite reluctant to accept major
interventions to their system’s config “ by In Panos Vassiliadis research .
Transformation can be explained that after extracting data from the data sources, it will be necessary to convert it to a standard form to ensure system compatibility. During this process a number of data cleansing operations will also be performed.
Load is the name given to the process of loading the target on the system.
Visualizing Report Method
Dashboards provide results by extracting value from all the data you collect. It shows that data transparency which a well designed dashboard provides on-demand access of all core metrics inter-departmentally. Also easy to access data with dashboards. That means you can immediately see a detailed overview of your business in one quick glance. Even better yet, it reduces the amount of time it takes to compile reports, saving you time. Business dashboards provide a good starting point for these decisions. Business dashboards can show you exactly where your trouble areas are and arm you with the information you need to improve.It provide interactivity. That means you can get as much or as little detail on specific metrics as you want.
5 Panos Vassiliadis research (2010)
19
CHAPTER 4
Overview of Data Analysis
In the project, firstly raw data was studied. These raw data are Nestle Turkiye Gıda A.Ş ‘data. Nestle Turkiye measured digital kpı since one year. Nestle is doing various activities on social media.Thus, it has a big data for effectiveness of social media. This raw data included about coffe category in beverages business. This raw data contained a lot of redundant information. Meaningful patterns had to be specified and an algorithm for this data had to be made. This algorithm aims to extract meaningful information from raw data. After that business intellegince processes implements and realizes this solution. After this meaningful data is analyzed in excel. Necessary normalizations are made and a training data is created.
Secondly, historical data was studied. Historical data is collected by different source. These are stored at two sources: Social Studio and Social Bakers. The two applications have various data of Twitter, Facebook and YouTube such as followers, likes, comments, time of watching videos and so on. These applications have been used by extracting “csv” file. All historical data of coffe category in beverages business are stored in one folder. Finally, competing company data was studied.Netsle Turkiye invested competing company data that comes from Nielsen Research Company was studied. This data is about only share of voice data. Nielsen investigated consumers comments about all companies and products. Share of Voice is designed to create a mutually beneficial relationship between the advertiser and the web publisher. The advertiser is willing to pay a premium for exclusivity and less competition for their target audience's viewership. The publisher no longer has to rely on volume and can attract advertisers that want to specifically reach the publisher's audience.(sov viki). This strategy guarantees one promotion won't be seen any more than the other three publicists. What's more, since there are regularly a set number of promoters utilizing a Share of Voice model, advertisement presentation is enhanced. Also it was compared with results of research. This was realized by queries and analysis on excel.
20
Data Cleansing
Data cleansing is a difficult yet critical process and requires dedication of committed time and resources. Data cleaning deals with detecting and removing errors and inconsistencies from data in order to improve the quality of data. With reference to social media data, data cleansing is the process of maintaining consistent and accurate customer database through identification & removal of inaccurate data. Before the ETL processes, first data
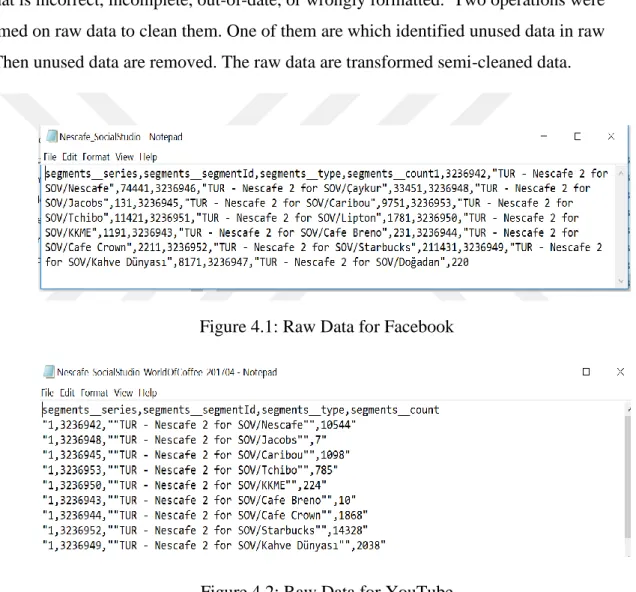
scrubbing process was done on excel. In the raw data that inaccurate data stands for any data that is incorrect, incomplete, out-of-date, or wrongly formatted. Two operations were performed on raw data to clean them. One of them are which identified unused data in raw data. Then unused data are removed. The raw data are transformed semi-cleaned data.
Figure 4.1: Raw Data for Facebook
21
Figure 4.3: Raw Data for Twitter
First cleaning step of data provided that categorized data. After categorized that made easier by making it structured.
22
Figure 4.5: Categorized Twitter Share of Interaction Data
Figure 4.6: Categorized Twitter YouTube Data
23
Second data cleasing process was that data preparation for ETL tool. It provides which in transformation of semi-cleaned data to structural. It is analyzed with excel. 98 excel data source files are sturcutred 3 excel files. Now data structre is standart, simplify and sharable. Four data category will reach the results :
- How many people affected the twitter activities - How many people affected the facebook activities - How many people affected the YouTube activities
- What is share of voice on coffe category in beverages business.
Figure 4.8: Structural KPI Measurement Data Source
24
Figure 4.10: Structural Channel Estimation Data Source
Figure 4.11: Structural Nielsen Data Source
ETL Tool
In the project information for each source was required. After reducing data sources, ETL processes will be started. There are many ready-to-use ETL tools on the technology. In this project, Sql Server Integration Services (SSIS) are used. It is a component of the Microsoft SQL Server database software. It provides a means to implement data transformations easily and consistently across various data sources. This includes filtering, reformatting, sorting, joining, merging, aggregation and other operations ready to use. The tools also support transformation scheduling, version control, monitoring and unified metadata management.
25 There are several ways to perform the extract:
- Update notification - Incremental extract - Full extract
Since the data is converted to structural format, full extract way is the best choice for the project. Systems may not identify which data has been changed at all, so a full extract is the only way one can get the data out of the system. The full extract requires keeping a copy of the last extract in the same format in order to be able to identify changes. It handles deletions as well. All data source ( 3 sources ) are stored in one local folder. Data are extracted and go to directly Staging Table. In this process, there is no changes in data. After copied data to Staging Table, the process of manipulation of the data started. This step is one of the most important as it ensures the quality of the data in the data warehouse. Manipulation performed basic data unification rules:
- Convert null values into standardized Not Available/Not Provided value - Convert hours fields into minutes, seconds and split-seconds
- Convert number fields into decimal a standardized form
After manipulation step, transformation step is started. The transform step applies a set of rules to transform the data from the source to the target. This includes converting any measured data to the same dimension using the same units so that they can later be joined. The transformation step also requires joining data from several sources, generating aggregates, generating surrogate keys, sorting, deriving new calculated values, and applying advanced validation rules. Manipulated data are transformed to Temporary Table at datawarehouse.
The last but not least step is loading. During the load step, it is necessary to ensure that the load is performed correctly and with as little resources as possible. The target of the Load process is often a database. In order to make the load process efficient, it is helpful to disable any constraints and indexes before the load and enable them back only after the load completes.
26
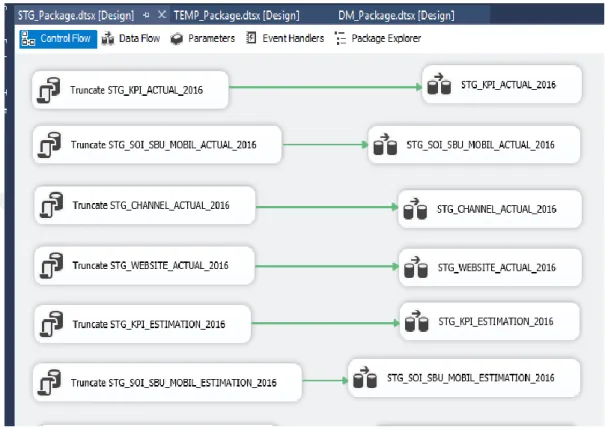
In the project, three packages are created. First one is Stage package. It is direcly extracted full data from folder and to write Staging Table at database. The package has all data , YouTube, Twitter, Facebook and Share of Voice.
27
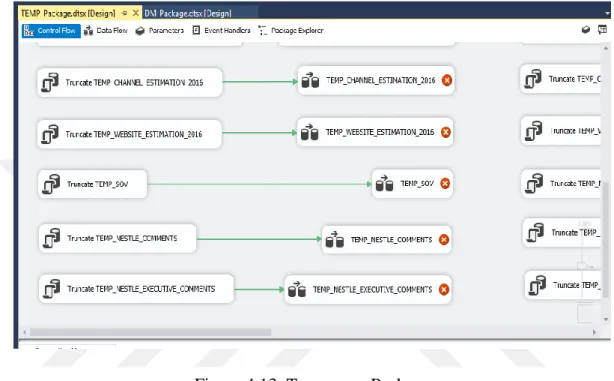
Second package that is Temporary Package. Manupilated data are transformed to Temporary Table at database. Some calculations are completed inthis step, the it goes to directly Temporary Table. It included all data for YouTube, Twitter,Facebook and Share of Voice.
Figure 4.13: Temporary Package
The last package is DM that called defect management package. When the are extracted that includes wrong data, ETL gave an error and the result of error go to directly Error Table. It provides accurancy data for all processes.
28
Figure 4.14: Defect Management Package
When ETL is running , all process is working with parallel. All package worked at the same time. Data flows has database connection to write database tables.
29
30
Figure 4.17: Data Flow in Package
31
Database Structure
In the loading step, databases are feeded from extraction files. Four are three databases that are feeded from extraction data.
Four databases stored as : - Staging Table - Temporary Table - Error Table - Nielsen Table
Staging Table included social media data for coffe category in beverages business.
32
Temporary Table included manipulated social media data for coffe category in beverages business.
Figure 4.20: Temporary Table at Nestle Database
Error Table included error that comes from when ETL is running and got defect for any issues. It has errors of social media data for coffe category in beverages business.
33
CHAPTER 5
Overview of Algorithms and Insights
Project Flowchart
Figure 5.1: ETL Flowchart
Visualize Data
A business knowledge dashboard is a data administration apparatus that is utilized to track KPIs, measurements, and other key information directs important toward a business, office, or particular process. Using information perceptions, dashboards improve complex informational indexes to give clients initially familiarity with current execution. Using information perceptions, dashboards improve complex informational indexes to give initially familiarity with current execution.
In this research, dashoards faciliatated to get insights from data. In business intellegince process, reports are made desicions for strategy. For Nestle project, digital business unit can make desicion to follow with this dashoard. The dashboard provides “Which social media channel is the most effective on marketing ” It is compared between three social
34
media channels. When the unit read this dashboard, they can see which invesment is the true decision on social media.
This dashboard is developed with SAP Business Objects Web Intellegince tool. It is web-based reporting and analysis as part of an integrated BI platform solution. These web-web-based ad hoc reporting and analysis tools make it easy to uncover fast, decision-ready business intelligence (BI) from any data source.
Figure 5.2: Share of Voice Comparison Dashboard
35
Figure 5.4: YouTube Share of Views Comparison Dashboard
36
CHAPTER 6
Overview of Trends and Results
In this section, trends and result of the research question with business intelligence are discussed.
In January 2017, the below table shows that Facebook Performance and Twitter Performance for Nescafe. It can be compared with KPI’s. It showed that Facebook and Twitter return of invesment metrics how measured.
These data are extracted from Social Bakers to “csv” file. Then they are loaded with ETL tool to database. After that data visualizing with Web Intelligence tool to convert dashboard.
37
In February 2017, the below table shows that Facebook Performance and Twitter Performance for Nescafe.It showed that Post Engagment is good.Video Engagement and Amplif are low. It should need create sharable content in order to increase amplify rate. On the video side, needs to check creative,video length.
38
In March 2017, It showed that Post Engagement Rate and Video Engagement Rate are so low on Facebook.The action should be need to produce engaging content whilist considering video content or post content to satisfy basic requirements of their kind. Amplify is low. It should need to prouduce sharable content.
39
Conclusion
In this thesis, return of investment metrics on social media is explained. This research can also help that is figured out how it is measured get back when return of investment metrics on social media.This is realized by using business intellegince processes (self learning, training). Firstly, former related works are investigated. Business intellegince processes are examined. The theory of BI is studied. Different technologies are examined. After that various
implementations are examined.
After that, data analysis theories are examined. This involves creating historical data. Historical data and real-time data are examined. Data cleasing methods are examined. Data manupilations methods are discussed.
Then, extraction method of the base estimation is discussed.
Data collection is discussed next. This is realized by etl tool. Later data is made neat by database applications. The source code of program is also discussed.
Later, etl and datawarehouse implementation of the program is explained. The algorithm and source code of the tool is discussed.
Finally, visualising and results are discussed. A lot of historic data are made in the production of the dashboard. Best results are discussed. Runs in SAP Web Intellegince tool and SSIS are discussed.
41 References
1] Bulusu, Nirupama, John Heidemann, and Deborah Estrin. "GPS-less low-cost outdoor localization for very small devices." Personal Communications, IEEE 7.5 (2000): 28-34. 2] Haenlein, Michael. "A Social Network Analysis of Customer-level Revenue Distribution." Marketing Letters 22, no. 1 (2011): 15-29.
3] Hill, Shawndra, Foster Provost, and Chris Volinsky. "Network-Based Marketing: Identifying Likely Adopters via Consumer Networks." Statistical Science 21, no. 2 (2006): 256-76.M. Hazas, J. Scott, and J. Krumm, “Location-Aware Computing Comes of Age,” Comput., vol. 37, no. 2, pp. 95–97, 2004.
4] "Profiting from friendship." Economist [London, England] 30 Jan. 2010: 10+. The Economist Historical Archive, 1843-2013.
5] Simge Say, Pazarlama Araci Olarak Sosyal Medya Kullanimi: Gida Sektöründe Facebook Örneği
6] Smart Sights Web Site; http://www.smartinsights.com/social-media-marketing/social-media-governance/social-media-marketing-effectiveness-2014/
7] Boom Social Web Site; http://www.boomsocial.com/Facebook/SayfaKarsilastir/. 8] Atasoy, B. (2013). http://sosyalmedya.co/boomsocial/.
9] Ada, S. & Abul, A. (2014). İşletmelerde Sosyal Medya Kullanımı: İşletme Bölümü Öğrencilerinin Algıları Üzerine Bir Araştırma, Kahramanmaraş Sütçü İmam Üniversitesi İktisadi ve İdari Bilimler Fakültesi Dergisi, 4/1, 316-327
10] Olgun, B. (2015). Sosyal Medyanın Tüketici Satın Alma Davranışları Üzerindeki Etkisi, Gümüşhane Üniversitesi Sosyal Bilimler Elektronik Dergisi, 12, 484-507
11] Çelikten, M.O. (2014). Sosyal Medyanın Etkisi – Kozmetik Ürünlerin Satın Alınmasında Bir Uygulama, Yayımlanmamış Yüksek Lisans Tezi, Kayseri: Nuh Naci Yazgan Üniversitesi, Sosyal Bilimler Enstitüsü
12] Türkyılmaz, C. A. & Kocamaz İ. & Uslu A. (2016), Çevrimiçi Kompulsif Satın Alma Davranışının Yönlendirici Unsurları Olarak Materyalizm Ve Marka Rezonansı, The Journal of Academic Social Science Studies, 43, 91-107.
13] Olgun, B. (2015). Sosyal Medyanın Tüketici Satın Alma Davranışları Üzerindeki Etkisi, Gümüşhane Üniversitesi Sosyal Bilimler Elektronik Dergisi, 12, 484-507.
14] Özata, F. Z. (2013). Sosyal Medya, (Editör: F.Z.Özata) içinde, Sosyal Medya ve Pazarlama (ss.26-51), Eskişehir: Anadolu Üniversitesi
42
15] Ting H and Cyril De Run E (2015) Beliefs about the Use of Instagram: An Exploratory Study, Internatıonal Journal Of Busıness Innovatıon and Research, 2(2), 15-31.
43
Curriculum Vitae
Yasemin Cengiz was born on 01 Jan 1991, in Diyarbakır. She received her BS degree in Industrial Engineering in 2014 from Kadir Has University. Also she received her double major BS degree in Computer Engineering in 2014 from Kadir Has University. She worked as a Business Intellegince Analyst at British American Tobacco between 2012 – 2013 years. After BAT experience, she worked as Business Analyst at Garanti Technology , technology of Garanti Bank. She promoted as Senior Business Analyst between 2014-2015 years. Then she started to work as Business Analystics Specialist. During her master education, she has been affiliated with the Business Intellegince processes. Her research interests include data mining, relational databases and BI technologies.
44
Table of Contents
Abstract ...i Özet ... iii Acknowledgements ... v Table of Contents ... viList of Figures ... vii
Introduction ...1
Literature Review ...5
Return of Investment Metrics on Social Media ...8
Overview of Business Intelligence Structure ... 14
Overview of Data Analysis ... 16
Overview of Algorithms and Insights ... 30
