Tar. Bil. Der.
Dergi web sayfası:
www.agri.ankara.edu.tr/dergi
www.agri.ankara.edu.tr/journal
Journal homepage:
TARIM BİLİMLERİ DERGİSİ
—
JOURNAL OF AGRICUL
TURAL SCIENCES
24 (2018) 431-438
Determination of Genotype x Environment Interactions of Some
Chickpea (Cicer arietinum L.) Genotypes by Using Different Stability
Methods
Omer SOZEN
a,
Ufuk KARADAVUT
baAhi Evran University, Faculty of Agriculture, Department of Field Crops, Kirsehir, TURKEY bAhi Evran University, Faculty of Agriculture, Biometry and Genetic Unit, Kirsehir, TURKEY ARTICLE INFO
Research Article
Corresponding Author: Omer SOZEN, E-mail: [email protected], Tel: +90 (536) 632 75 55 Received: 26 July 2017, Received in Revised Form: 29 September 2017, Accepted: 10 October 2017
ABSTRACT
This study was carried out to determine the productive responses of 10 chickpeas (Cicer arietinum L.) genotypes to different places and years. Hasanbey, Aksu, Seckin, Damla 89, Gulumser, Cagatay, Sezenbey, Inci, Gokce and Uzunlu 99 chickpea genotypes were used as plant material. This research was conducted in Yozgat, Kirikkale and Kirsehir Provinces of Turkey in 2014, 2015 and 2016. The experimental design was a randomized block with 4 replicates. Environmental variance, variation coefficient, ecovalance, stability variance, superiority measure, regression coefficient, deviation from regression and coefficient of determination methods were used for stability calculations. Aksu genotype had the highest stability level, whereas Seckin, Damla 89 and Uzunlu 99 chickpea genotypes also successfully grown with respect to stability parameters. Cagatay chickpea genotype showed the highest yield potential, if grown in ideal environmental conditions. To conclude, the ideal yield would be obtained in the event that the requirements of if the genotypes are fulfilled by desired environmental conditions.
Keywords: Chickpea; Genotype; Environment; Location; Stability; Yield
© Ankara Üniversitesi Ziraat Fakültesi
1. Introduction
Chickpea has been an important legume plant for
Turkey, especially in Central Anatolia Region
including Kirikkale, Yozgat and Kirsehir, consisting
of 12.4% of the cultivation area of Turkey. It has
been an important source of dietary protein for
human nutrition. As well known, chickpea is
self-pollinated, diploid annual grain legume crop
(Babagil 2013). Legumes restore soil structure and
fertility through biological nitrogen fixation as well
as conserving, and improving physical properties
of soil via their deep root system and leaving a
quite amount of biomass (i.e., nitrogen) to the soil
from their leaves due to falling from pulse crops,
which will reach to 40 kg N ha
-1(Singh 2016).
Local farmers have used local populations and they
have been reluctant to switch to other populations
for many years. Their local populations can be only
sowing in summer season and are highly susceptible
to anthracnose (Ascochyta rabiei (pass.) Labr.).
Anthracnose emerges especially in heavy spring
rains and causes huge production losses. Although
the studies have shown that sowing chickpeas
during fall season yield successful results, it takes
time to adapt sowing season. Chickpeas do not resist
cold, which is the biggest challenge for fall sowing
(Acikgoz et al 2009). Changes in the environment
have been important determinants in genotypic
performance, identifying the genotypes that can
tolerate the changes in the environment is important
(Singh & Bejiga 1990).
The main production goal in legume production
has been seed yield and, thus, it is desired to get
the sustainable high yield production results with
related agronomic properties. The components
of genotype x environment interaction have been
recommended for commercial cultivation to get
higher yields (Singh et al 2010).
The quantitative properties, such as grain
yield, in different plant genotypes grown in a wide
environment vary from one environment to another
(Altinbas & Sepetoglu 1994). This phenomenon
leads to get different production results from the
genotype x environment interactions in different
cultivation conditions (Kilic 2014). The effects of
genotype x environment interaction at significant
levels reduce the relationship between genotypic
values, preventing the genetic progression expected
in breeding, which aim to breed high-quality
genotypes (Comstock & Moll 1963).
Yadav et al (2014) determined that genotype x
environment interaction was statistically significant
with respect to the studied parameters. High
productivity and adaptability to environment depend
on the physiological responses of cultivars used in
certain environmental conditions (Costa et al 2004).
Atta & Shah (2009) found significant differences in
grain yields among genotypes, attributed to these
differences to the magnitude of genotypes responses
to the environments. According to Farshadfar et al
(2011) found out that the environmental effect on
yield was 86.44%, whereas the effects of genotype
and genotype x environment interaction were
only 2.48% and 11.08%, respectively. Moreover,
breeding genotypes that tolerate environmental
conditions has been the cheapest way to control
possible negative outcomes and minimizes yield
losses (Tsenov et al 2015).
This study was aimed to determine the productive
responses of 10 different chickpea genotypes in 3
different environments during 3 years by using
different stability parameters.
2. Material and Methods
For the current study, 10 registered chickpea
genotypes (Cicer arietinum L.) developed by
Turkish Research Institutes were used. These were
Hasanbey, Seckin, Inci (Eastern Mediterranean
Agricultural Research Institute); Cagatay, Sezenbey,
Damla 89, Gulumser (Black Sea Agricultural
Research Institute); Gokce, Uzunlu 99 (Field
Crops Central Research Institute) and Aksu (East
Mediterranean Transitional Zone Agricultural
Research of Institute) chickpea genotypes. This
study was conducted in the locations of Sarikaya/
Yozgat, Keskin/Kirikkale and Center of Kirsehir
in Turkey during the period of 2014 and 2016.
Altitudes of locations were between 800 and 1300
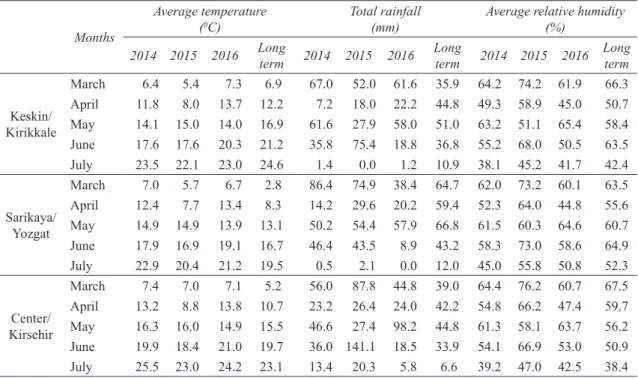
m. Climate data (Table 1) showed that these three
years were similar with respect to the mean monthly
temperature and relative humidity. Total amount
of precipitation in April and March in all three
locations and years was lower than that of rainfall
seasons of all three locations and three years. In
July, it was excessive.
The trials in all three locations were carried out
in a randomized block experimental design with 4
replicates. Seedings were manually performed on
rows determined with markers. The trial parcels were
made up of 4 rows with 45-cm inter-row spacing and
8-cm intra-row spacing and total parcel area was
5 m x 1.8 m= 9 m
-2. Harvest area was determined
to be 4 m x 0.9 m= 3.6 m
2. The sowing processes
were modified according to climate conditions. All
planting processes took place in March. Sowings
were done in March on 17-19 days, on 20-22 days
and on 18-20 days, respective to Yozgat, Kirikkale
and Kirsehir locations. Harvesting times were in
July on 13-15 days, in March on 10-12 days and in
March on 7-9 days, respective to Yozgat, Kirikkale
and Kirsehir locations.
In sowing time at all locations, 25 kg ha
-1pure
nitrogen and 50 kg ha
-1pure phosphorus fertilizers
were used. During the trial, among the stability
parameters, environmental variance (Lin et al
1996), variation coefficient (Francis & Kannenberg
1978), ecovalance (Wricke 1962), stability variance
(Shukla 1972), superiority measure (Lin & Binns
1988), regression coefficient (Eberhart & Russel
1966), deviation from regression (Becker & Leon
1988) and coefficient of determination (Pinthus
1973) methods were used in stability calculations.
From these methods, coefficients and their deviations
from regressions were considered to be stable. In
addition, environmental and genotype indices were
calculated. The results were evaluated by applying
variance analysis in accordance with the different
years and repeated randomized block experimental
design used in the SPSS 17 package program.
3. Results and Discussion
The variance analyses of the experiment are shown
in Table 2, revealing that the differences among the
years, locations and genotypes and their interactions
were statistically significant (P<0.01).
Table 2- Analysis of variance results of chickpea
yield for different location and years
Source Degree of freedom Mean square
Year 2 37,915.84** Location 2 356,415.58** Year x Location 4 319,348.96** Genotype 9 31,677.61** Year x Genotype 18 10,112.34** Location x Genotype 18 9,980.14**
Year x Location x Genotype 36 8,017.56**
Error 244 1,106.11**
Total 360
Coefficient of variation 10.32%
**, P≤0.01
Table 1- Climate data for Keskin, Sarikaya and Kirsehir*
Months
Average temperature
(0C) Total rainfall (mm) Average relative humidity (%)
2014 2015 2016 Long term 2014 2015 2016 Long term 2014 2015 2016 Long term
Keskin/ Kirikkale March 6.4 5.4 7.3 6.9 67.0 52.0 61.6 35.9 64.2 74.2 61.9 66.3 April 11.8 8.0 13.7 12.2 7.2 18.0 22.2 44.8 49.3 58.9 45.0 50.7 May 14.1 15.0 14.0 16.9 61.6 27.9 58.0 51.0 63.2 51.1 65.4 58.4 June 17.6 17.6 20.3 21.2 35.8 75.4 18.8 36.8 55.2 68.0 50.5 63.5 July 23.5 22.1 23.0 24.6 1.4 0.0 1.2 10.9 38.1 45.2 41.7 42.4 Sarikaya/ Yozgat March 7.0 5.7 6.7 2.8 86.4 74.9 38.4 64.7 62.0 73.2 60.1 63.5 April 12.4 7.7 13.4 8.3 14.2 29.6 20.2 59.4 52.3 64.0 44.8 55.6 May 14.9 14.9 13.9 13.1 50.2 54.4 57.9 66.8 61.5 60.3 64.6 60.7 June 17.9 16.9 19.1 16.7 46.4 43.5 8.9 43.2 58.3 73.0 58.6 64.9 July 22.9 20.4 21.2 19.5 0.5 2.1 0.0 12.0 45.0 55.8 50.8 52.3 Center/ Kirsehir March 7.4 7.0 7.1 5.2 56.0 87.8 44.8 39.0 64.4 76.2 60.7 67.5 April 13.2 8.8 13.8 10.7 23.2 26.4 24.0 42.2 54.8 66.2 47.4 59.7 May 16.3 16.0 14.9 15.5 46.6 27.4 98.2 44.8 61.3 58.1 63.7 56.2 June 19.9 18.4 21.0 19.7 36.0 141.1 18.5 33.9 54.1 66.9 53.0 50.9 July 25.5 23.0 24.2 23.1 13.4 20.3 5.8 6.6 39.2 47.0 42.5 38.4
According to Table 2, Year x Location x
Genotype interaction was statistically important.
Also, it is observed that the observed differences
between years seriously affected the properties of
the genotypes by combining with the locational
characteristics. The efficacies of the Year x
Genotype and Location x Genotype interactions
had quite importance, showing that these effects
were very strong. Both the location and the year had
significant impacts on the formation of genotypes,
resulting different productive outputs between
the present cultivated genotypes. The significant
location x genotype interactions with respect to
yield were shown on the efficacy of environment on
the genotypes by affecting the productive yields of
the experimental plants.
This result supports the report of Farshadfar
et al (2011) in which they determined that the
contribution of environment on yield change was
86.44%. This result is also in line with that of
Altınbas & Sepetoglu (1994) in which they stated
that the responses of the characters vary depending
on the environment. The differences among the
cultivars were of great importance because of the
fact that all investigated properties of the cultivars
showed similar behaviors (Sabanduzen & Akcura
2017). The significance of Genotype x Environment
interaction was also determined in the studies of
Arshad et al (2003), Bakhsh et al (2006), Abbas
et al (2008), Ali & Sarwar (2008) and Karasu et al
(2009), on chickpeas, white beans, green peas and
soy beans, respectively.
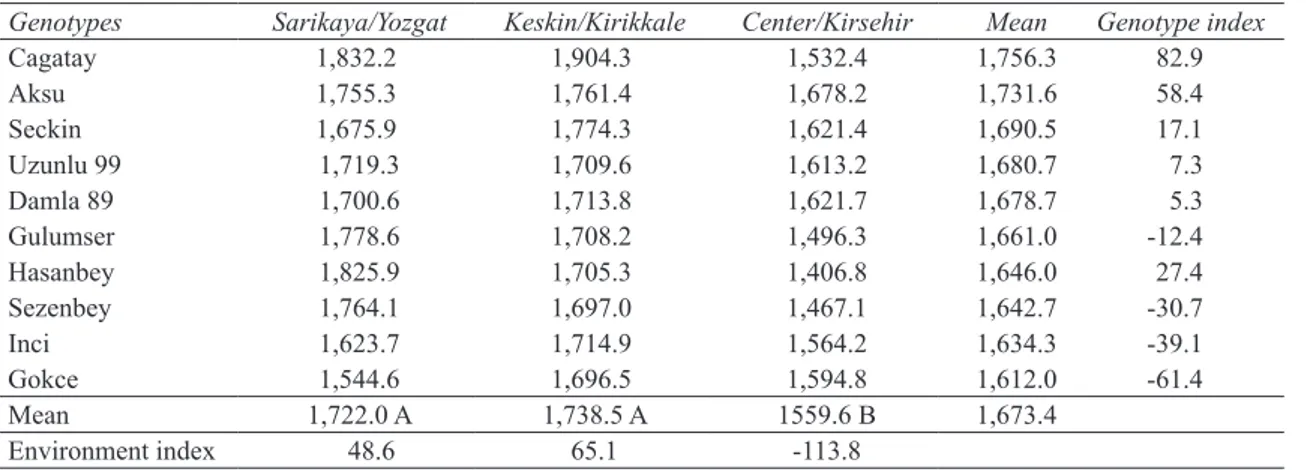
Table 3 shows the yields of the genotypes with
respect to the locations in which they were grown for
3 years. Table 3 reveals that, in the Sarikaya/Yozgat
location, the highest yield was obtained in Cagatay
genotype (1,832.2 kg ha
-1), whereas the lowest yield
was obtained in Gokce genotype (1,544.6 kg ha
-1). In
Keskin/Kirikkale location, Cagatay genotype (1,904.3
kg ha
-1) was the most prominent genotype and showed
the highest yield, while the lowest-yielding genotype
was Gokce genotype (1,696.5 kg ha
-1).
In Kirsehir location, Cagatay genotype did not
reach the performance as reached in the other two
locations. The highest yield was obtained in Aksu
genotype (1,678.2 kg ha
-1). Gokce genotype was
more successful in this location and was among the
highest-ranking genotypes. The lowest yield was
observed in Hasanbey genotype (1,406.8 kg ha
-1).
In general, it can be argued that the genotypes
demonstrated significant differences among each
other and these differences varied depending on
the sowed locations. The comparison between the
average yields of the locations showed that Sarikaya/
Yozgat and Keskin/Kirikkale locations were in the
same group, while Center/Kirsehir location was
different from the other two locations and had the
Table 3- Yield situations of genotypes according to locations (kg ha
-1)
Genotypes Sarikaya/Yozgat Keskin/Kirikkale Center/Kirsehir Mean Genotype index
Cagatay 1,832.2 1,904.3 1,532.4 1,756.3 82.9 Aksu 1,755.3 1,761.4 1,678.2 1,731.6 58.4 Seckin 1,675.9 1,774.3 1,621.4 1,690.5 17.1 Uzunlu 99 1,719.3 1,709.6 1,613.2 1,680.7 7.3 Damla 89 1,700.6 1,713.8 1,621.7 1,678.7 5.3 Gulumser 1,778.6 1,708.2 1,496.3 1,661.0 -12.4 Hasanbey 1,825.9 1,705.3 1,406.8 1,646.0 27.4 Sezenbey 1,764.1 1,697.0 1,467.1 1,642.7 -30.7 Inci 1,623.7 1,714.9 1,564.2 1,634.3 -39.1 Gokce 1,544.6 1,696.5 1,594.8 1,612.0 -61.4 Mean 1,722.0 A 1,738.5 A 1559.6 B 1,673.4 Environment index 48.6 65.1 -113.8
lowest yield. This difference is attributable to the
ecological factors.
Plant physiology is highly susceptible as a result
of their sensitive mechanism of action and it gains
further importance when their yield capacities
are in question. The degree of their reactions is
not only dependent on their genotypic structure
but also is affected by factors interacting with the
environment and environment (Sehirali & Ozgen
1988; Kabak & Akcura 2017). Therefore, different
genotypes in different environments may show
different performances (Acikgoz & Acikgoz 1994;
Altinbas et al 1999). It was reported that the yield
and certain properties of plants showed significant
variations depending upon the environment, most
likely, affecting the yield at significant levels (Silim
& Saxena 1993; Yucel & Mart 2014).
Chickpea can show different phenological
reactions or responses to climate conditions.
This consequently will affect plant growth and
productivity in different way. Additionally,
location effect contributed this efficacy. Climate
changes will affect early growth and flowering
by changing dry matter content, the numbers of
fertile and dropped flowers (Garcia Del Moral et
al 2003). Rainy conditions in different locations
affected the environmental responses of plants. The
difference in adaptation abilities of genotypes plus
rainy conditions both increased the intense of their
environmental responses. However, plants would
have eliminated the negative consequents of climate
changes when they grew up sufficiently (Saidi et al
2008). In our present study, it can be said that the
genotypes affected from environmental factors in
lesser extent, showed the better growth performance
than the others.
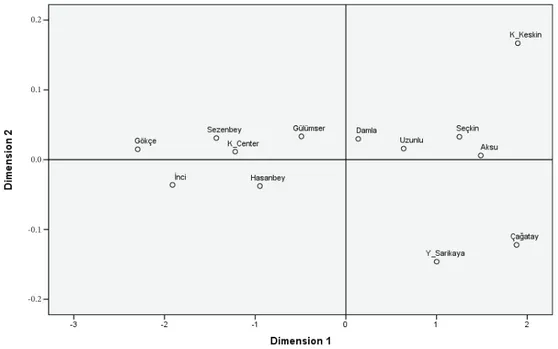
Figure 1 shows the mean yield values of
genotypes for experimental years and locations,
revealing that Hasanbey, Gulumser and Sezenbey
chickpea genotypes showed poor performances in
all environments; Cagatay genotype was different
from the other genotypes and yielded high in good
environments, although its yield decreased in
environments where its physiological requirements
were not met. Aksu, Seckin, Damla 99 and Uzunlu
99 genotypes maintained their yields under all
0.0
-0.1 0.1 0.2
-0.2
Determination of Genotype x Environment Interactions of Some Chickpea (Cicer arietinum L.)..., Sozen & Karadavut
Ta r ı m B i l i m l e r i D e r g i s i – J o u r n a l o f A g r i c u l t u r a l S c i e n c e s
24 (2018) 431-438
436
conditions while Inci and Gokce genotypes
maintained their yields at acceptable levels, even
under unfavorable conditions.
Table 4 shows the results of the different stability
parameters applied to the chickpea genotypes
used in the present study. Table 4 reveals that, in
the view of the investigated parameters, Aksu,
Seckin, Uzunlu 99 and Damla 89 genotypes were
more stable than the other genotypes in terms of all
years and locations, whereas Hasanbey, Gulumser
and Sezenbey genotypes were not stable in any
environment or location and showed significant
changes, depending on their sowed environments
and years.
Regression coefficient and deviation from
regression indicated the stability of a cultivar: the
closer the regression coefficient was to 1 and the
smaller the deviation from regression, the more
stable the cultivar. Furthermore, coefficient of
determination (R
2) shows how much of the variation
in a dependent variable can be explained with the
regression equation and therefore, cultivars with
higher R
2values can be accepted as more stable
cultivars (Unay et al 1990; Aleksoska et al 2015).
Eberhart & Russel (1966) evaluated the
genotypes as stable if their regression coefficients
(b
i) are ‘1.0’ and their deviations from regression
can be statistically accepted as “(
5
Figure 1- Multi dimentional scaling of location, year and genotypes performance (Zeynep hanım dikey olarak verilmiş olan 0,0 yazar düzeltmeyi unutmuş. 0.0 virgülü nokta yapabilir misiniz?)
Table 4- Stability parameters of genotypes for different location and years
Genotypes
X
S
xi2b
iS
di2R
2 2 iW
2 i
CV
iP
i Hasanbey 164.5 4.26 1.65 3.58 0.86 6.38 0.61 32.1 2.58 Aksu 173.1 1.68 1.08 1.14 0.95 2.18 1.10 24.3 1.14 Seckin 169.0 1.88 0.96 1.06 0.94 2.07 1.06 23.8 1.16 Damla 89 167.8 2.61 0.95 0.94 0.94 2.36 1.21 24.4 1.18 Gulumser 166.0 8.36 0.68 4.26 0.76 7.11 3.16 32.6 3.54 Cagatay 177.0 3.22 0.92 1.20 0.89 2.84 1.28 25.1 2.20 Sezenbey 164.2 7.69 0.69 3.91 0.79 6.74 3.37 35.6 3.94 Inci 163.4 3.56 1.10 1.36 0.88 2.66 2.47 27.1 2.21 Gokce 161.1 3.54 1.09 1.42 0.87 2.71 2.64 27.6 1.96 Uzunlu 99 168.0 2.05 0.94 1.14 0.94 2.11 1.18 23.8 1.29Regression coefficient and deviation from regression indicated the stability of a cultivar: the closer the regression coefficient was to 1 and the smaller the deviation from regression, the more stable the cultivar. Furthermore, coefficient of determination (R2) shows how much of the variation in a dependent variable can be explained with the regression equation and therefore, cultivars with higher R2 values can be accepted as more stable cultivars (Unay et al 1990; Aleksoska et al 2015).
Eberhart & Russel (1966) evaluated the genotypes as stable if their regression coefficients (bi) are ‘1.0’ and their deviations from regression can be statistically accepted as "( 2
di
S
0)" and stated that genotypes with higher performances in all environments were desired. Therefore, it can be concluded that the regression coefficient used by Eberhart & Russel (1966) was the same as that of Finlay & Wilkinson (1963).4. Conclusions
The results of the present study showed that, according to the parametric stability tests, the Aksu cultivar had the highest stability level. Seckin, Damla 89 and Uzunlu 99 chickpea genotypes grew up successfully. Cagatay chickpea genotype has the highest yield potential, if it grew up under proper breeding conditions; however, such conditions cannot be continuously provided and, therefore, successful results cannot be expected from this genotype. Inci and Gokce chickpea genotypes should be considered as the potential successful genotypes. The tendency of the higher yields were observed in the Keskin/Kirikkale location without showing any statistical difference between locations.
0.2 0.1 0,0 -0.1 -0.2 -3 -2 -1 0 1 2 =
0)” and
stated that genotypes with higher performances in
all environments were desired. Therefore, it can be
concluded that the regression coefficient used by
Eberhart & Russel (1966) was the same as that of
Finlay & Wilkinson (1963).
Table 4- Stability parameters of genotypes for different location and years
Genotypes
5
Figure 1- Multi dimentional scaling of location, year and genotypes performance (Zeynep hanım dikey olarak verilmiş olan 0,0 yazar düzeltmeyi unutmuş. 0.0 virgülü nokta yapabilir misiniz?)
Table 4- Stability parameters of genotypes for different location and years
Genotypes
X
S
xi2b
iS
di2R
2 2 iW
2 i
CV
iP
i Hasanbey 164.5 4.26 1.65 3.58 0.86 6.38 0.61 32.1 2.58 Aksu 173.1 1.68 1.08 1.14 0.95 2.18 1.10 24.3 1.14 Seckin 169.0 1.88 0.96 1.06 0.94 2.07 1.06 23.8 1.16 Damla 89 167.8 2.61 0.95 0.94 0.94 2.36 1.21 24.4 1.18 Gulumser 166.0 8.36 0.68 4.26 0.76 7.11 3.16 32.6 3.54 Cagatay 177.0 3.22 0.92 1.20 0.89 2.84 1.28 25.1 2.20 Sezenbey 164.2 7.69 0.69 3.91 0.79 6.74 3.37 35.6 3.94 Inci 163.4 3.56 1.10 1.36 0.88 2.66 2.47 27.1 2.21 Gokce 161.1 3.54 1.09 1.42 0.87 2.71 2.64 27.6 1.96 Uzunlu 99 168.0 2.05 0.94 1.14 0.94 2.11 1.18 23.8 1.29Regression coefficient and deviation from regression indicated the stability of a cultivar: the closer the regression coefficient was to 1 and the smaller the deviation from regression, the more stable the cultivar. Furthermore, coefficient of determination (R2) shows how much of the variation in a dependent variable can be explained with the regression equation and therefore, cultivars with higher R2 values can be accepted as more stable cultivars (Unay et al 1990; Aleksoska et al 2015).
Eberhart & Russel (1966) evaluated the genotypes as stable if their regression coefficients (bi) are ‘1.0’ and their deviations from regression can be statistically accepted as "( 2
di
S
0)" and stated that genotypes with higher performances in all environments were desired. Therefore, it can be concluded that the regression coefficient used by Eberhart & Russel (1966) was the same as that of Finlay & Wilkinson (1963).4. Conclusions
The results of the present study showed that, according to the parametric stability tests, the Aksu cultivar had the highest stability level. Seckin, Damla 89 and Uzunlu 99 chickpea genotypes grew up successfully. Cagatay chickpea genotype has the highest yield potential, if it grew up under proper breeding conditions; however, such conditions cannot be continuously provided and, therefore, successful results cannot be expected from this genotype. Inci and Gokce chickpea genotypes should be considered as the potential successful genotypes. The tendency of the higher yields were observed in the Keskin/Kirikkale location without showing any statistical difference between locations.
0.2 0.1 0,0 -0.1 -0.2 -3 -2 -1 0 1 2
5
Figure 1- Multi dimentional scaling of location, year and genotypes performance (Zeynep hanım dikey olarak verilmiş olan 0,0 yazar düzeltmeyi unutmuş. 0.0 virgülü nokta yapabilir misiniz?)
Table 4- Stability parameters of genotypes for different location and years
Genotypes
X
S
2xib
iS
di2R
2 2 iW
2 i
CV
iP
i Hasanbey 164.5 4.26 1.65 3.58 0.86 6.38 0.61 32.1 2.58 Aksu 173.1 1.68 1.08 1.14 0.95 2.18 1.10 24.3 1.14 Seckin 169.0 1.88 0.96 1.06 0.94 2.07 1.06 23.8 1.16 Damla 89 167.8 2.61 0.95 0.94 0.94 2.36 1.21 24.4 1.18 Gulumser 166.0 8.36 0.68 4.26 0.76 7.11 3.16 32.6 3.54 Cagatay 177.0 3.22 0.92 1.20 0.89 2.84 1.28 25.1 2.20 Sezenbey 164.2 7.69 0.69 3.91 0.79 6.74 3.37 35.6 3.94 Inci 163.4 3.56 1.10 1.36 0.88 2.66 2.47 27.1 2.21 Gokce 161.1 3.54 1.09 1.42 0.87 2.71 2.64 27.6 1.96 Uzunlu 99 168.0 2.05 0.94 1.14 0.94 2.11 1.18 23.8 1.29Regression coefficient and deviation from regression indicated the stability of a cultivar: the closer the regression coefficient was to 1 and the smaller the deviation from regression, the more stable the cultivar. Furthermore, coefficient of determination (R2) shows how much of the variation in a dependent variable can be explained with the regression equation and therefore, cultivars with higher R2 values can be accepted as more stable cultivars (Unay et al 1990; Aleksoska et al 2015).
Eberhart & Russel (1966) evaluated the genotypes as stable if their regression coefficients (bi) are ‘1.0’ and their deviations from regression can be statistically accepted as "( 2
di
S
0)" and stated that genotypes with higher performances in all environments were desired. Therefore, it can be concluded that the regression coefficient used by Eberhart & Russel (1966) was the same as that of Finlay & Wilkinson (1963).4. Conclusions
The results of the present study showed that, according to the parametric stability tests, the Aksu cultivar had the highest stability level. Seckin, Damla 89 and Uzunlu 99 chickpea genotypes grew up successfully. Cagatay chickpea genotype has the highest yield potential, if it grew up under proper breeding conditions; however, such conditions cannot be continuously provided and, therefore, successful results cannot be expected from this genotype. Inci and Gokce chickpea genotypes should be considered as the potential successful genotypes. The tendency of the higher yields were observed in the Keskin/Kirikkale location without showing any statistical difference between locations.
0.2 0.1 0,0 -0.1 -0.2 -3 -2 -1 0 1 2
5
Figure 1- Multi dimentional scaling of location, year and genotypes performance (Zeynep hanım dikey olarak verilmiş olan 0,0 yazar düzeltmeyi unutmuş. 0.0 virgülü nokta yapabilir misiniz?)
Table 4- Stability parameters of genotypes for different location and years
Genotypes
X
S
xi2b
iS
di2R
2 2 iW
2 i
CV
iP
i Hasanbey 164.5 4.26 1.65 3.58 0.86 6.38 0.61 32.1 2.58 Aksu 173.1 1.68 1.08 1.14 0.95 2.18 1.10 24.3 1.14 Seckin 169.0 1.88 0.96 1.06 0.94 2.07 1.06 23.8 1.16 Damla 89 167.8 2.61 0.95 0.94 0.94 2.36 1.21 24.4 1.18 Gulumser 166.0 8.36 0.68 4.26 0.76 7.11 3.16 32.6 3.54 Cagatay 177.0 3.22 0.92 1.20 0.89 2.84 1.28 25.1 2.20 Sezenbey 164.2 7.69 0.69 3.91 0.79 6.74 3.37 35.6 3.94 Inci 163.4 3.56 1.10 1.36 0.88 2.66 2.47 27.1 2.21 Gokce 161.1 3.54 1.09 1.42 0.87 2.71 2.64 27.6 1.96 Uzunlu 99 168.0 2.05 0.94 1.14 0.94 2.11 1.18 23.8 1.29Regression coefficient and deviation from regression indicated the stability of a cultivar: the closer the regression coefficient was to 1 and the smaller the deviation from regression, the more stable the cultivar. Furthermore, coefficient of determination (R2) shows how much of the variation in a dependent variable can be explained with the regression equation and therefore, cultivars with higher R2 values can be accepted as more stable cultivars (Unay et al 1990; Aleksoska et al 2015).
Eberhart & Russel (1966) evaluated the genotypes as stable if their regression coefficients (bi) are ‘1.0’ and their deviations from regression can be statistically accepted as "( 2
di
S
0)" and stated that genotypes with higher performances in all environments were desired. Therefore, it can be concluded that the regression coefficient used by Eberhart & Russel (1966) was the same as that of Finlay & Wilkinson (1963).4. Conclusions
The results of the present study showed that, according to the parametric stability tests, the Aksu cultivar had the highest stability level. Seckin, Damla 89 and Uzunlu 99 chickpea genotypes grew up successfully. Cagatay chickpea genotype has the highest yield potential, if it grew up under proper breeding conditions; however, such conditions cannot be continuously provided and, therefore, successful results cannot be expected from this genotype. Inci and Gokce chickpea genotypes should be considered as the potential successful genotypes. The tendency of the higher yields were observed in the Keskin/Kirikkale location without showing any statistical difference between locations.
0.2 0.1 0,0 -0.1 -0.2 -3 -2 -1 0 1 2
5
Figure 1- Multi dimentional scaling of location, year and genotypes performance (Zeynep hanım dikey olarak verilmiş olan 0,0 yazar düzeltmeyi unutmuş. 0.0 virgülü nokta yapabilir misiniz?)
Table 4- Stability parameters of genotypes for different location and years
Genotypes
X
S
2xib
iS
di2R
2 2 iW
2 i
CV
iP
i Hasanbey 164.5 4.26 1.65 3.58 0.86 6.38 0.61 32.1 2.58 Aksu 173.1 1.68 1.08 1.14 0.95 2.18 1.10 24.3 1.14 Seckin 169.0 1.88 0.96 1.06 0.94 2.07 1.06 23.8 1.16 Damla 89 167.8 2.61 0.95 0.94 0.94 2.36 1.21 24.4 1.18 Gulumser 166.0 8.36 0.68 4.26 0.76 7.11 3.16 32.6 3.54 Cagatay 177.0 3.22 0.92 1.20 0.89 2.84 1.28 25.1 2.20 Sezenbey 164.2 7.69 0.69 3.91 0.79 6.74 3.37 35.6 3.94 Inci 163.4 3.56 1.10 1.36 0.88 2.66 2.47 27.1 2.21 Gokce 161.1 3.54 1.09 1.42 0.87 2.71 2.64 27.6 1.96 Uzunlu 99 168.0 2.05 0.94 1.14 0.94 2.11 1.18 23.8 1.29Regression coefficient and deviation from regression indicated the stability of a cultivar: the closer the regression coefficient was to 1 and the smaller the deviation from regression, the more stable the cultivar. Furthermore, coefficient of determination (R2) shows how much of the variation in a dependent variable can be explained with the regression equation and therefore, cultivars with higher R2 values can be accepted as more stable cultivars (Unay et al 1990; Aleksoska et al 2015).
Eberhart & Russel (1966) evaluated the genotypes as stable if their regression coefficients (bi) are ‘1.0’ and their deviations from regression can be statistically accepted as "( 2
di
S
0)" and stated that genotypes with higher performances in all environments were desired. Therefore, it can be concluded that the regression coefficient used by Eberhart & Russel (1966) was the same as that of Finlay & Wilkinson (1963).4. Conclusions
The results of the present study showed that, according to the parametric stability tests, the Aksu cultivar had the highest stability level. Seckin, Damla 89 and Uzunlu 99 chickpea genotypes grew up successfully. Cagatay chickpea genotype has the highest yield potential, if it grew up under proper breeding conditions; however, such conditions cannot be continuously provided and, therefore, successful results cannot be expected from this genotype. Inci and Gokce chickpea genotypes should be considered as the potential successful genotypes. The tendency of the higher yields were observed in the Keskin/Kirikkale location without showing any statistical difference between locations.
0.2 0.1 0,0 -0.1 -0.2 -3 -2 -1 0 1 2
5
Figure 1- Multi dimentional scaling of location, year and genotypes performance (Zeynep hanım dikey olarak verilmiş olan 0,0 yazar düzeltmeyi unutmuş. 0.0 virgülü nokta yapabilir misiniz?)
Table 4- Stability parameters of genotypes for different location and years
Genotypes
X
S
xi2b
iS
di2R
2 2 iW
2 i
CV
iP
i Hasanbey 164.5 4.26 1.65 3.58 0.86 6.38 0.61 32.1 2.58 Aksu 173.1 1.68 1.08 1.14 0.95 2.18 1.10 24.3 1.14 Seckin 169.0 1.88 0.96 1.06 0.94 2.07 1.06 23.8 1.16 Damla 89 167.8 2.61 0.95 0.94 0.94 2.36 1.21 24.4 1.18 Gulumser 166.0 8.36 0.68 4.26 0.76 7.11 3.16 32.6 3.54 Cagatay 177.0 3.22 0.92 1.20 0.89 2.84 1.28 25.1 2.20 Sezenbey 164.2 7.69 0.69 3.91 0.79 6.74 3.37 35.6 3.94 Inci 163.4 3.56 1.10 1.36 0.88 2.66 2.47 27.1 2.21 Gokce 161.1 3.54 1.09 1.42 0.87 2.71 2.64 27.6 1.96 Uzunlu 99 168.0 2.05 0.94 1.14 0.94 2.11 1.18 23.8 1.29Regression coefficient and deviation from regression indicated the stability of a cultivar: the closer the regression coefficient was to 1 and the smaller the deviation from regression, the more stable the cultivar. Furthermore, coefficient of determination (R2) shows how much of the variation in a dependent variable can be explained with the regression equation and therefore, cultivars with higher R2 values can be accepted as more stable cultivars (Unay et al 1990; Aleksoska et al 2015).
Eberhart & Russel (1966) evaluated the genotypes as stable if their regression coefficients (bi) are ‘1.0’ and their deviations from regression can be statistically accepted as "( 2
di
S
0)" and stated that genotypes with higher performances in all environments were desired. Therefore, it can be concluded that the regression coefficient used by Eberhart & Russel (1966) was the same as that of Finlay & Wilkinson (1963).4. Conclusions
The results of the present study showed that, according to the parametric stability tests, the Aksu cultivar had the highest stability level. Seckin, Damla 89 and Uzunlu 99 chickpea genotypes grew up successfully. Cagatay chickpea genotype has the highest yield potential, if it grew up under proper breeding conditions; however, such conditions cannot be continuously provided and, therefore, successful results cannot be expected from this genotype. Inci and Gokce chickpea genotypes should be considered as the potential successful genotypes. The tendency of the higher yields were observed in the Keskin/Kirikkale location without showing any statistical difference between locations.
0.2 0.1 0,0 -0.1 -0.2 -3 -2 -1 0 1 2
5
Figure 1- Multi dimentional scaling of location, year and genotypes performance (Zeynep hanım dikey olarak verilmiş olan 0,0 yazar düzeltmeyi unutmuş. 0.0 virgülü nokta yapabilir misiniz?)
Table 4- Stability parameters of genotypes for different location and years
Genotypes
X
S
xi2b
iS
di2R
2 2 iW
2 i
CV
iP
i Hasanbey 164.5 4.26 1.65 3.58 0.86 6.38 0.61 32.1 2.58 Aksu 173.1 1.68 1.08 1.14 0.95 2.18 1.10 24.3 1.14 Seckin 169.0 1.88 0.96 1.06 0.94 2.07 1.06 23.8 1.16 Damla 89 167.8 2.61 0.95 0.94 0.94 2.36 1.21 24.4 1.18 Gulumser 166.0 8.36 0.68 4.26 0.76 7.11 3.16 32.6 3.54 Cagatay 177.0 3.22 0.92 1.20 0.89 2.84 1.28 25.1 2.20 Sezenbey 164.2 7.69 0.69 3.91 0.79 6.74 3.37 35.6 3.94 Inci 163.4 3.56 1.10 1.36 0.88 2.66 2.47 27.1 2.21 Gokce 161.1 3.54 1.09 1.42 0.87 2.71 2.64 27.6 1.96 Uzunlu 99 168.0 2.05 0.94 1.14 0.94 2.11 1.18 23.8 1.29Regression coefficient and deviation from regression indicated the stability of a cultivar: the closer the regression coefficient was to 1 and the smaller the deviation from regression, the more stable the cultivar. Furthermore, coefficient of determination (R2) shows how much of the variation in a dependent variable can be explained with the regression equation and therefore, cultivars with higher R2 values can be accepted as more stable cultivars (Unay et al 1990; Aleksoska et al 2015).
Eberhart & Russel (1966) evaluated the genotypes as stable if their regression coefficients (bi) are ‘1.0’ and their deviations from regression can be statistically accepted as "( 2
di
S
0)" and stated that genotypes with higher performances in all environments were desired. Therefore, it can be concluded that the regression coefficient used by Eberhart & Russel (1966) was the same as that of Finlay & Wilkinson (1963).4. Conclusions
The results of the present study showed that, according to the parametric stability tests, the Aksu cultivar had the highest stability level. Seckin, Damla 89 and Uzunlu 99 chickpea genotypes grew up successfully. Cagatay chickpea genotype has the highest yield potential, if it grew up under proper breeding conditions; however, such conditions cannot be continuously provided and, therefore, successful results cannot be expected from this genotype. Inci and Gokce chickpea genotypes should be considered as the potential successful genotypes. The tendency of the higher yields were observed in the Keskin/Kirikkale location without showing any statistical difference between locations.
0.2 0.1 0,0 -0.1 -0.2 -3 -2 -1 0 1 2 Hasanbey 164.5 4.26 1.65 3.58 0.86 6.38 0.61 32.1 2.58 Aksu 173.1 1.68 1.08 1.14 0.95 2.18 1.10 24.3 1.14 Seckin 169.0 1.88 0.96 1.06 0.94 2.07 1.06 23.8 1.16 Damla 89 167.8 2.61 0.95 0.94 0.94 2.36 1.21 24.4 1.18 Gulumser 166.0 8.36 0.68 4.26 0.76 7.11 3.16 32.6 3.54 Cagatay 177.0 3.22 0.92 1.20 0.89 2.84 1.28 25.1 2.20 Sezenbey 164.2 7.69 0.69 3.91 0.79 6.74 3.37 35.6 3.94 Inci 163.4 3.56 1.10 1.36 0.88 2.66 2.47 27.1 2.21 Gokce 161.1 3.54 1.09 1.42 0.87 2.71 2.64 27.6 1.96 Uzunlu 99 168.0 2.05 0.94 1.14 0.94 2.11 1.18 23.8 1.29
4. Conclusions
The results of the present study showed that,
according to the parametric stability tests, the Aksu
cultivar had the highest stability level. Seckin,
Damla 89 and Uzunlu 99 chickpea genotypes grew
up successfully. Cagatay chickpea genotype has the
highest yield potential, if it grew up under proper
breeding conditions; however, such conditions
cannot be continuously provided and, therefore,
successful results cannot be expected from this
genotype. Inci and Gokce chickpea genotypes should
be considered as the potential successful genotypes.
The tendency of the higher yields were observed in
the Keskin/Kirikkale location without showing any
statistical difference between locations.
References
Abbas G, Atta B M, Shah T M, Sadiq M S & Haq M A (2008). Stability analysis for seed yield in mungbean (Vigna radiata L.). Wilczek Journal of Agriculture
Research 46: 223-228
Acikgoz N & Acikgoz N (1994). Determination of the effects of different sowing time and varieties on the
formation of yield by path analysis. Field Crops
Congress 1: 121-125
Acikgoz E, Ustun A, Gul I, Anlarsal E, Tekeli A S, Nizam I, Avcioglu R, Geren H, Cakmakci S, Aydinoglu B, Yucel C, Avci M, Acar Z, Ayan I, Uzun A, Bilgili U, Sincik M & Yavuz M (2009). Genotype x Environment interaction and stability analysis for dry matter and seed yield in field pea (Pisum sativum L.). Spanish
Journal of Agriculture Research 7: 96-106
Aleksoska A, Miceska G, Gveroska B, Dimitrieski M & Aleksoski J (2015). Stability of the yield in commercial tobacco varieties in Republic of Macedonia. Turkish
Journal of Agriculture Natural 2: 1391-1395
Ali Y & Sarwar G (2008). Genotype x Environment interaction of cowpea genotypes. International
Journal of Environment Research 2(2): 125-132
Altinbas M & Sepetoglu H (1994). A study on the determination of stability parameters for seed yield and some agronomic properties in lentil (Lens
culinaris Med.). The first Field Crops Congress 4:
116-120
Altinbas M, Sepetoglu H & Karasu A (1999). A Research on fertility effects of chickpea under different environmental conditions. The First Field Crops
Congress, 25-29 April 1994, Izmir 3: 348-353
Arshad M, Bakhsh A, Haqqani A M & Bashir M (2003). Genotype x Environment interaction for grain yield in chickpea (Cicer arietinum L.). Pakistan Journal of
Botany 35: 181-186
Atta B M & Shah T M (2009). Stability analysis of elite chickpea genotypes tested under diverse. Australian
Journal of Crop Science 3: 249-256
Babagil G E (2013). Assessment of effectiveness degrees of the factors affecting the yield of some chickpea (Cicer arietinum L.) genotypes by path analysis.
Indian Journal of Agriculture Science 83: 1205
Bakhsh A, Arshad M & Haqqani A M (2006). Effect of Genotype x Environment interaction on relationship between grain yield and its components in chickpea (Cicer arietinum L.). Pakistan Journal of Botany 38(3): 683-690
Becker H C & Leon J (1988). Stability analysis in plant breeding. Plant Breeding 101: 1-23
Comstock R E & Moll R H (1963). Genotype x Environment Interactions. Statistical Genetics and
Plant Breeding NAS-NRC Publ No: 982, Washington
DC., pp. 164-196
Costa J M, Bollero V S & Pandey P L (2004). Stability for grain yield of barley genotypes under rainfed conditions. Advance in Plant Science 12: 27-30 Eberhart S A & Russel W A (1966). Stabilty parameters
for comparing varieties. Crop Science 6: 36-40 Farshadfar E, Farshadfar M & Kiani M (2011).
Involvement of chromosome 5R carrying the genes controlling yield and yield stability in rye (Secale Cereale cv. Imperial). European Journal of Science
Research 59(3): 352-360
Finlay K M & Wilkinson G N (1963). The analysis of adaptation a plant-breeding programme. Australian
Journal of Agriculture Research 14: 742-754
Francis T R & Kannenberg L W (1978). “Yield stability studies in short season maize 1, A Descriptive method for grouping genotypes”, Canadian Plant Science 58: 1029-1034
Garcia Del Moral L F, Rharrabti Y, Villegas D & Royo C (2003). Evaluation of grain yield and its components in drum wheat under Mediterranean conditions: an ontogenic approach. Agrononomy Journal 95: 266-274
Kabak D & Akcura M (2017). Evaluation of the interrelationship among grain yield traits of rye landraces population collected from Bingol province using biplot analysis. Turkish Journal of Agricultural
and Natural Sciences 4(2): 227-235
Karasu A, Oz M, Goksoy A T & Turan Z M (2009). Genotype by environment interactions stability and heritability of seed yield and certain agronomical traits in soybean (Glycine max (L.) Merr.). African
Journal of Biotechnology 8(4): 580-590
Kilic H (2014). Assessment of advanced durum wheat lines for yield and some quality traits at different environments. Turkish Journal of Agricultural and
Natural Sciences 1(2): 194-201
Lin C C & Binns M R (1988). A superiority measure of cultivar performance for cultivar x location data.
Canadian Journal of Plant Science 68: 193-198
Lin C C, Binns M R & Lefkovitch L P (1996). Stability Analysis: Where Do We Stand? Crop Science 26: 894-900
Pinthus M J (1973). Estimate of genetic value: Proposed methods. Euphytica 22: 121-123
Sabanduzen B & Akcura M (2017). Evaluation of grain yield and yield components of oat genotypes in
Canakkale conditions. Turkish Journal of Agricultural
and Natural Sciences 4(2): 101-108
Saidi A, Ookawa T, Motobayashi T & Hirasawa T (2008). Effects of soil moisture conditions before heading on growth of wheat plants under drought conditions in the ripening stage: insufficient soil moisture conditions before heading render wheat plants more resistant to drought to ripening. Plant Production
Science 11: 403-411
Sehirali S & Ozgen M (1988). Plant Breeding. University of Ankara Faculty of Agricultural Publications 1059, Textbook: 310, Ankara
Shukla G K (1972). “Some statistical aspects of partitioning genotype x environmental components of variability”. Heredity 29: 237-245
Silim S N & Saxena M C (1993). Yield and water use efficiency of faba bean sown at two row spacings and seed densities. Expriment Agriculture 29: 173-181 Singh R (2016). Productivity enhancement of chickpea
(Cicer arietinum L.) through improved production technologies on farmer’s field. Indian Journal of
Agricultural Sciences 86(10): 1357-1360
Singh K B & Bejiga G (1990). Analysis of stability for some characters in kabuli chickpea. Euphytica 49: 223-227
Singh T, Paswan S & Tyag J P (2010). Effect of environmental stresses on certain quality traits in chickpea (Cicer arietinum L.). Indian Journal of
Agricultural Sciences 80(12): 1089-1091
Tsenov N, Gubatov T, Atanasova D, Nankova M & Ivanova A (2015). Genotype x Environment effects on the productivity traits of common wheat (Triticum
aestivum L.) II. Analysis of genotype reaction. Turkish Journal of Agricultural and Natural Sciences
1: 1198-1208
Unay A I, Turgut H, Surek H & Korkut K Z (1990). Stability analysis on some properties in rice. University of
Ankara Faculty of Agricultural Publications 3(1-2):
117-124
Wricke G (1962). On a method of understanding the biolojical diversity in field research. Zoology
Pflanzenzucht 47: 46-92
Yadav A, Yadav I S & Yadav C K (2014). Stability analysis of yield and related traits in chickpea (Cicer arietinum L.). Legume Research 37(6): 641-645
Yucel D & Mart D (2014). Drought tolerance in chıckpea (Cicer arietinum L.) genotypes. Turkish Journal of