İSTANBUL BİLGİ UNIVERSITY INSTITUTE OF SOCIAL SCIENCES FINANCIAL ECONOMICS MASTER’S PROGRAM
AN APPLICATION OF MERGERS AND ACQUISITIONS OF BANKING SECTOR IN TURKEY Dilan DOĞAN 115620014
SUPERVISOR: ASST. PROF. DR. Serda Selin ÖZTÜRK ISTANBUL 2017
i
Table of Contents
1.INTRODUCTION………...……1
2. THE FUNDEMENTAL CONCEPTS OF MERGER AND ACQUISITION………..…3
2.1 Merger and Acquisition…...……….…3
2.2 Merger………4 2.2.1 Forms of Interaction………...……….…...4 2.3 Variety of Merger………..……….……..5 2.3.1 Vertical Merger ……….………5 2.3.2 Horizontal Merger………..5 2.3.3 Conglomerate Merger………...……….……6 2.4Acquisition………..8 2.4.1Types of Acquisition……….……...………….…..8 2.4 1.1Gold Coin………..……….8 2.4.1.2 Poison Pills………..8 2.4.1.3 Green Mail……….…..9
2.4.1.4 Alternation of Main Contract……….……...9
2.4.1.5 White Knight……….………..9
2.5 Reasons of Merger and Acquisition………...…..9
2.5.1 Synergies………..10
2.5.2 Achieving more rapid growth………...………..….11
2.5.3 Increased market power………...………....11
ii
2.5.5 Tax considerations……….………..………12
2.5.6 Unlocking hidden value………...………12
2.6 Financial Assesments of M&A………..….12
2.6.1 Premium on Merger and Acquisition………...12
2.6.1.1 Risk and reward distribution of buyers and target partners……….………13
2.6.1.2 Relative valuation of companies involved………...…....13
2.6.1.3 Changes in capital structure………..13
2.6.2 Synergy ≥ Premium………...………..…………15
2.6.3 0 ≤ Synergy ≤ Premium………...…………...15
2.6.4 Synergy < 0………..………15
2.7 Valuation on M&A………...………..15
2.7.1 Discount Cah Flow (DCF)………...………16
2.7.2 Comparable Company Analaysis………...………..…18
2.7.2.1 Identification of smilar companies that are the smilar to target firm...18
2.7.2.2 Calculation of various relative value measures based on current market prices of the companies question………...………18
2.7.2.3 Calculation of describtive statistic of relative value metrics and applying these measures to target firm………..……19
2.7.2.4 Estimation of Takeover Premium………...………..19
2.7.2.5 Calculation of the target‟s take over cost as the sum of estimated share value based on comparable values and acquisition Premium……….………...20
iii
2.7.3.1 Identification a set of recent takeover transaction………..20
2.7.3.2 Calculation of relative value measures based on compated contract prise for the sample companies………...………...20
2.7.4 Price/Earning Ratio……….…..….21
2.7.5 Price/ Book Value……….…….22
2.7.5.1 Calculate descripting statistic for relative value metrics and apply these measures to the target firm………..……..23
3. MERGER AND ACQUISITION OF BANKING SECTOR IN TURKEY………...23
3.1 Merger and Acquisition of Banking Sector in Turkey………..………..……23
3.2 Bank Acquisitions in Turkish Banking System……...………...…...24
4. METHODOLOGY and DATA………...27
4.1 Factor Analysis………...….27
4.1.1 Analysis of Bank Merging and Purchases by Selected Performance Indicators……….……….36 4.2 Probit Model………42 4.3 Data………..……44 5.CONCLUSION………..…47 6.BIBLIOGRAPHY………...51 7.APPENDIX………55
iv
ABSTRACT
Globalization has affected all systems around the world as well as financial systems. These effects were sometimes positive and sometimes resulted in negative results. In this context, companies in the banking sector have invested in a variety of ways to increase profit margins (acquisitions and mergers) and have begun to play an important role in the global market as a result of globalization. On the other hand, these acquisitions and mergers are not only a result of globalization but also contributed to the development of globalization itself.
Banks' purchasing and merging have increased in recent years. This increase has led to the need for further work on mergers and acquisitions. This work has also emerged as a result of this need.
In this study, between the years of 2002-2016 in Turkey it was also examined 11 banks being subject to mergers and acquisitions. In addition, 66 financial ratios are used from the Banks Association of Turkey recieved. By factor analysis, significant groups were formed from 66 financial indicators and the best representatives were identified. It is aimed to measure the performances of the banks subject to merger or acquisition by establishing the probit model with the most meaningful indicators in the direction of the result of factor analysis.
Key Words: Merger, Acquisition, Banking, Factor Analysis, Probit Model
v
ÖZET
Küreselleşme dünya üzerindeki tüm sistemleri etkilediği gibi finansal sistemleride etkilemiştir. Bu etkiler kimi zaman olumlu, kimi zamansa olumsuz sonuçlar ortaya çıkartmıştır. Bu bağlamda bankacılık sektöründe hizmet veren şirketler kar marjlarını arttırmak için çeşitli yollar ile (satın alma ve birleşmeler) yatırımlarını arttırmış ve küreselleşmenin bir sonucu olarak dünya pazarında önemli roller almaya başlamışlardır. Öte yandan bu satın alma ve birleşmeler küreselleşmenin bir sonucu olmasının yanında bizzat küreselleşmenin gelişmesine de katkı sağlamıştır.
Bankaların satın alma ve birleşmeleri son yıllarda artış göstermektedir. Bu artış birleşme ve satın almalar ile ilgili daha çok çalışma yapılması ihtiyacını ortaya çıkartmıştır. Bu çalışma da bu ihtiyacın bir sonucu olarak ortaya çıkmıştır.
Bu çalışmada 2002-2016 yılları arasında Türkiye‟ de birleşme ve satın almaya konu olman 11 bankalar incelenmiştir. Buna ek olarak Türkiye Bankalar Birliğinden alınan 66 adet finansal rasyo kullanılmıştır. Faktör analizi ile 66 adet finansal gösterge içinden anlamlı gruplar oluşturularak, bu göstergeleri en iyi temsil eden göstergeler belirlenmiştir. Faktör Analizinden çıkan sonuç doğrultusunda en anlamlı göstergeler ile probit model kurularak birleşme veya satın almaya konu olan bankaların performansları ölçülmesi amaçlanmıştır.
Anahtar Kelimeler: Birleşme, Satn Alma, Bankacılık, Faktör Analizi, Probit Model
1
1.INTRODUCTION
The banking sector plays a strategic role in the stability of the economy and the effects of the developments in this sector are felt in the sector as a whole. Therefore, the effects of the developments in the form of purchasing, merger or share transfer in Turkey, and the effects of the banks on the ratios constitute the aim of this research. In the functioning of the economy, the banks that constitute the backbone of the financial system play an important role in mergers and acquisitions, which are more frequent in recent years, in order to keep pace with changing market and competition conditions. Acquisitions in various sectors are carried out as in the whole world, especially in the financial sector in Turkey. Mergers and acquisitions, one of the banks' restructuring methods, have come to the fore in the Turkish Banking Sector as a result of the financial crisis in particular.
The research will firstly explain the definitions of merger and acquisition and illustrate why M&A is important of effect of the banks in banking sector in Turkey. In addition to other M&A applications of in the banking sector in other countries will be examined. It aims to search the different kind of merger and acquisition in terms of primarly objective in banking sector. Fundumental purpose of the banking merger is increasing the yields of shareholders. Moreover the growth of the bank‟s request is pushes to merger for various reasons such as synergy will be achieved through scale economies, administrative earnings and tax considerations. Banks that were subject to mergers and acquisitions between 2002 and 2016 are examined. By applying the Probit Model, performance change differences were determined after the merger date of 11 banks subject to research. It will analayse the data of Banking indicator with using Ewievs program. In this research, intended multiple research methods to explain of effects of M&A. We will comparsion a lot of data about indicator of banking sector. Moreover diffirent
2
measures and indicator will be identified from the privellige articals and study. I will make a study of banking indicator from The Bank Association of Turkey.
The ratios from the Banks Association of Turkey contain all banks operating in Turkey. However The fact that banks do not have a collective data set on mergers, acquisitions or share transfers is one of the difficulties in working. Moreover, these activities do not allow intensive long-term analysis in 2006 and 2007. For this purpose, the subjects such as the interpretation and the statistical significance of the rates which are meaningful in terms of analysts, managers or investors are examined.
The study consists of four parts. In the first part, examine to reason of study, second part of study is the growth strategies of the companies were emphasized; a conceptual framework has been established on mergers and acquisitions that are an external growth option. In this context, the reasons for the company acquisitions and the financial evaluation of mergers and acquisitions have been researched. The third part is the method part of the thesis and statistical and econometric methods are used for the 11 banks merged, bought or transferred to the share transfer process in 2002-2016 period. Using the probit model, the effects of the merger, acquisition or share transfer transactions on the bank balance were investigated using the dummy variable. The impact of acquisitions in this study, the performance of banks; mergers, acquisitions and the values realized before and after the share transfer were analyzed. And the last part you may see conclusion of meaningful bank output which is after the intergation. On the other hand the main prupose of this research is how M&A effected in the banking ratios in banking sector of Turkey.
3
2. THE FUNDEMENTAL CONCEPTS OF MERGER AND ACQUISITION
2.1 Merger and Acquisition
M&A is a term that describes the acquiring of a company or merging of companies (Cho, 2014). Also the term mergers and acquisitions (M&A) refers to the process of merging or acquiring all or part of another company's property right. In addition that an M&A is conducted under certain conditions in order to obtain controlling rights (Song and Chu, 2006). Moreover some research have been mentioned that a merger or acquisition is an important strategic move made by a company to improve its enterprise performance management. Successful mergers can produce many gains, including cost savings, increased profits, upscaling and freeing up abundant resources” (Halkos and Tzeremes, 2013b; Peyrache, 2013). “In many countries, global or multinational banks are extending their operations through mergers and acquisitions with the regional banks in those countries. These mergers and acquisitions are named as cross-border mergers and acquisitions in the banking sector or international mergers and acquisitions in the banking sector. By doing this, global banking corporations are able to place themselves into a dominant position in the banking sector, achieve economies of scale, as well as garner market share”(economywatch, 2010).
Consequently, numerous studies have been conducted in developed economies to examine the potential gains from mergers. However, to decrease the high failure rate of M&As, one of the critical steps a bidder company should take to try to identify suitable target M&A companies is to determine whether the prospective partner can offer synergies and relevant attributes to complement those of the acquiring company.
4
Eventhough they are used in place of each other, merger and acquisition in short, usually refers of two business combinning in some manner. Whereas many companies use M&A activities as way to achive growth, some of them may use to diversify to thier business.
2.2 Merger
Merger is to buy a company from another company or bringing more than one companies together under the same roof. With several reasons companies which is same, different or smilar sector, may merge with each other and they can change their share of market. As a result of unifiaction, they lose their legal personality both acquirer and target companies. Jang et al. (2004) represent that a merger is one of the strongest forms of integration, because it generally results in the complete unification of two companies‟ missions, strategies, and operation systems through combination.
2.2.1 Forms of Interaction
There are three thypes of interaction. They are. statuory, sabsidiary and consolidation. Statuory merge is made result of the acquiring companies acquires all of the assets and liabilities. Subsidary merge the target company becomes a subsidiary of the purchaser. Most of subsidiary merger be formed when target company has well known brand that the acquirer wants to retain. In a Consolidation, Both companies disappear in their previous forms and become an entirely new company. Consolidations come together to form an entirely new company, and tightness in mergers is widespread when both companies have a similar size.
5
2.3 Variety of Merger
Three primarly methodts in merger. These methods shows diversify according to the field of activity in firms.
2.3.1 Vertical Merger
If among the companies wich will be integrated, have buyer-seller relatioship or they will merge with their supplier, this is caled vertical integration. It is a good example of this types of integration is called as bankassurance that being together under the ne roof is bank services and the insurance. With this integration, deployment to customer base of bank and branches of insurance and product services is targeted. However Patrick (2007) mantioned that vertical merger may be done rectoactive with combine production proces that integration of the various inputs such as row meterals and semi products. Additionally for the prupose of more efficient final product distribution can be done looking forward. The primar reason of the vertical merger of big size companies is provide cost advantages in supply chains of row meterial and semi products with increases the integrations of the rectoavtive. Moreover according to Jhonson (1999) vertical merger should be used in scarcity of resource and find intermadiate goods stiuations.
2.3.2 Horizontal Merger
A horizontal merger is when a company merges with industry competitors in order to gain the competitive advantages that come with a larger scale and scope (Hill & Jones, 2004). Such as this mergers consist of between two companies in smilar or same business sector. Also they may often same geographical zone is operated. The underlying prupose of the horizontal merger as follows ;
6
- To ensure effective use of resources
- To ensure specialize in management and saving in prodoction cost
- Gain advantages for spply chain and marketing
- Coorporate to production technology
- Gain advantages against competitors
In horizontal mergers due to negative effeccts on the competitive structure, they may subject to specific regulations from the goverments. Moreover according to Weston (2004) in the case of lack of regulations, the firms of in sector may have gain unjust gain and they may obtain monopolistic power. Also it caused to firms of reduce.
2.3.3 Conglomerate Merger
In a conglomerate merger, the two companies compeletly seperate industries. P&G is a good example for conglomerate merger. It has expanded product range for buying Gillatte due to its initiative which it has not any proficiency before. We can say two good examples of in this integations. First, providing to success for controlling against other firms who needs requires expertise about marketing, production, reseach. Second, diversification for seperad the risks by reducing fluctuitions in earning and sales the. According to Gabrielsen (2003). Moreover Levt& Sarnet caught the attention that the most important purpose of a conglomerate merger is typically the diversification of capital investment (Levy & Sarnat, 1970). In addition, with regard to the relationship this diversification between a firm‟s unrelated variety (i.e., conglomerate mergers) and firm performance, the study of Palich, Cardinal, & Miller (2000) suggests that moderate levels of diversification contribute to higher levels of firm performance than either single or unrelated diversification (i.e., the curvilinear relationship).
7
However, Cho (2013) showa that, in a rapidly changing market environment, a firm's unrelated diversification (e.g., conglomerate mergers, occurring between two extraneous firms with heterogeneous business sectors) can be more positively related to a firm's overall business performance than a firm's related diversification (e.g., horizontal mergers, occurring between two firms with homogeneous business sectors) through a firm's optimized dynamic capabilities.
Many motives has been forwarded in the literature for conglomerate mergers. One part of this literature has to do with tax incentives that propel conglomerate mergers, and difficulties of finding accounting principles to determine the conglomerate‟s profitability. A second set of arguments is that conglomerate mergers may be anticompetitive and therefore should be ruled against by antitrust authorities.
Such conglomerate mergers are in reality vertical mergers in disguise. On the basis of this view, it is shown that the agreements seen as mixed mergers actually fall into the definition of vertical mergers together with the use of the distribution channels of the target firm. Hence, it is stated that the mixed associations are a secret vertical merger.
Conglomerate mergers have three subgroups;
- Poduction extanding: They have no competition amoung the produced products. They show fonctionally resemble to distribution and production department.
- Geographic market extanding: they produce same product but marketing different geograpichal area which already merge. Thus they are able to deliver products to a wider area.
- Pure mixed merger: There is no relationships between the firms about marketing and production area. They are realized between companies engaged in different activities.
8
2.4 Acquisition
Acquisition is the most known definition is to one company buying only part of another company. It is changes to by purpose of buyer firms. An acquisition occurs when an acquiring company achieves the right to manage an acquired company by obtaining the acquired company's assets or stocks. In this case, "the acquiring and acquired companies remain two independent companies from a legal point of view even after the acquisition, although the acquiring company has control over the acquired company" (Jang et al, 2004: 7).
2.4.1Types of Acquisition
They are five most commonly used types of acquisitions
2.4.1.1Gold Coin
The most common method of protection of the target company is the parachute method. The method has evolved to help companies reduce the unemployment problem and reduce the damage created by employees in their interests after the company has taken control. In summary, it is committed that a certain amount of payment will be made to the employees who will be removed from the work after the purchase. This will increase the cost of acquiring the target company, which will increase the cost of the net profit of the activity will decrease and in this case the buyer is thought to create deterrence (Jhonson 2013).
2.4.1.2 Poison Pills
It is the method used to grant rights to ensure that shareholders have additional shares. In the method, shareholders of the target company are provided with a fairly large discount on the share of the target company (flip-in pill) or the buyer (flip-over pill). Therefore, the number of shares of the target and buyer firms is increased to create less cost for the target company shareholders, while for buyers, the cost increase effect is created for the buyer (Sudarsanam, 2000).
9
2.4.1.3 Green Mail
It is the target company to purchase the shares in fairly large blocks with high price from certain shareholders. It is proposed to buy a higher price for the shares held by an associate wanting to increase the ownership rate in the company by collecting stocks from the market. Thus, it is prevent the increases of ownership ratio in the company (Weston, 2003).
2.4.1.4 Alternation of Main Contract
In order to minimize the possibility of purchasing, for example, the members of the board of directors are trying to establish rules for their membership periods and changes. By amending the Articles of Association, the voting rate of the General Assembly for liquidation shall be changed, the number of votes to be used by the shareholders of the class shareholders determined by dividing the share certificates into classes shall be increased to the number of votes to be used for the general meeting. It is possible to recognize certain privileges by means of provisions. (Sarıkamış, 2003:137)
2.4.1.5 White Knight
The white knight method is to prepare a competitive environment between the firm that wants to seize itself by finding the target company more suitable candidate for itself and the company that it finds itself (Gitman vd, 1998:827).
2.5 Reasons of Merger andAcquisition
In the literature they have lots of theories about aims of merger and acquisition. One reason the merge for the banks go the the merge is that after the merger there is expectation that new customer will win. Other reason is the indivicual values find a value above market value with the merger of two firms. Between these two values the difference is be gain of the merger. Accordingly, let us denote the value of X bank by Vx an the value of bank Y by Vy, and value of
10
after this merger by Vxy. In this case the gain is Vxy-(Vx+Vy). If it is Vxy > Vx + Vy, it will be profitable. But this activities is must be does not condrict to antritröst law wich is in valid on other countries. We can line up the elements that encourage for M&A activities.
2.5.1 Synergies
Synergies: The most common cause of union is the idea that if the combined company operates separately, it will create a synergy that both companies will be worth. Generally synergy comes from reducing costs or increasing revenues. If the new unit can reduce combined fixed costs (by eliminating recurring functions), the average cost per unit will be reduced by spreading lower fixed costs. Revenue synergies are often created by increasing prices to take advantage of cross-selling products, increased market share, or lower incentives. Also synergies is expressed as 1+1> 2 in literatur.
We may connect the following reasons of synergies in mergers and acquisitions.
- Reduction of operating expenses and increace of profit margin due to the business efficiency,
- Increase of capital cost due to improvement of company‟s financial structure,
- Increase merket efficenc,
- Advantages of vertically and horizontally merging. may causes of reduce of the capital cost.
11
2.5.2 Achieving more rapid growth
External growth through Mergers and Acquisitions is often much faster than investing internally (organic growth) to increase managers' revenues. Growth through mergers and acquisitions is particularly prevalent in mature industries where organic growth opportunities are limited.
2.5.3 Increased market power
When a horizontal merger occurs in an industry with few competitors, the new merged company will generally leave a greater ability for to increase market share and to influence market prices. Vertical merges may also increase their market power by reducing of the dependency on the externals supliers.
2.5.4 Diversification
Diversification, another reason of diversificsrtion for mergers and acquisitions, may involve the risk of distributing company profits through periodicity or some other factors by buying a firm that is outside the scope of its activity (Horne, 1986).
The idea behind company level diversification is that company may be treated as a potfolio of investment in other companies. If a conglomerate invests in companies from various industries, the variability in conglomerate aggregate cash flows should be reduced, at least to the extent that the industries are unrelated. Altough this may seem like a significant reason, generally it may not be in the best according to the interests of the conglomerate shareholders. In a well function in capital market, investors may diversify their protfolios mose easily and at less expense. In addition the desire of diversification may lead some companies to lose their great compatitive power and to expand into business where they lack comperative advantages.
12
2.5.5 Tax considerations
When we look at the tax considerations, we will see such a important benefits with regard to M&A activities thouhg increases of taxes. However according to amprical studies, it can no be said that the most important factor motivating many merger activities is the tax advantages.
2.5.6 Unlocking hidden value
When a company struggles for a long time, a buyer may think that the company can pay a lower price for the purchase and can turn the secret value by improving management, adding resources, or improving organizational structure. In some cases, a purchase may be combined because the purchaser believes that they are buying at a lower cost than their replacement costs. For example, a manufacturing company may purchase less than the cost to develop the current production process at less cost than developing a process on its own in its own production process.
2.6 Financial Assesments of M&A
The most discussed and the must time conssuming issue related to mergers and acquisitions is the determination of the business value. Whether it is merger or acquisiton, these kind of desicions are long term and high-risk strategic desicions. Such desicions will be made errors for many years is the continue the influance and the company costs are high. For this reason, in this part of the study we will focus on the determination of the premium to be paid and valuatin methods.
2.6.1 Premium on Merger and Acquisition
They have three main methods to considered for method of payment when an acquirer is is negotiating with a target.
13
2.6.1.1 Risk and reward distribution of buyers and target partners
In a stock offer, the shareholders of the target company share the risk of ultimate value arising from the merger at the risk associated with the final value arising from the merger as they receive new shares in the company after the merger. In a bid made in cash, all risk borne with the value of the post-merger company is covered by the acquirer. As a result, the buyer is more inclined to cash offer when they are extremely confident of the synergy and value that will arise from the merger.
2.6.1.2 Relative valuation of companies involved
If the buyer's shares are considered overvalued by the market, we believe that the buyer will want to use the excessively expensive shares in the currency as currency for the merger. In fact, the share of investors interprets the offer, sometimes a stock offer, as a signal that the share values of the acquirers may be overvalued.
2.6.1.3 Changes in capital structure
Different payment structures affect the capital structure of the acquiring company. If the purchaser borrows money to create cash in a cash offer, the associated debt will increase the financial leverage and risk of the acquirer. Issuing new shares for a securities offer may alleviate the ownership interest for existing shareholders of the purchase area.
In most countries there have anti-trust laws which prohibit M&A that inhibit competition. The Herfindahl-Hirschman Index (HHI) is a widely used measure of market power in identifying potential antitrust violations.
14
HHI is calculated as the sum of square market shares (sales or output) for all industries applicable to an industry for an industry:
HHI = ∑ (MSi * 100)2
Regulators initally focus on what the HHI computation would be after the merger takes places. If the post merger HHI is less than 1000, the industry is considered to be competitive and antitrust struggle is not possible. A post-merger HHI value of between 1,000 and 1,800 will place the industry in the "medium intensity" category. In this case, the regulators will compare the pre-merger and post-merger HHI. If the change is above 100 points, it is likely that the union will be challenged by antitrust reasons.
A post-merger HHI calculation greater than 1,800 implies an intense industry. The regulators will again compare pre-merger and post-merger HHI calculations, but in this case, if the change is greater than 50, the merger is likely to be challenged.
The total synergy will also be determinant of the Premium to be paid. There are a number of factors that affect premium payable. Synergy is at the beginning of these factors. Besides, many factors such as the performance of the company in the past, the quality of the management, the position of the target company on the market, the competition environment on the market, the type of payment to be made to the target company, the tax dimension are effective in determining the premium. Each element is shown as a factor in determining the price. However, the synergy factor is one of the most discussed topics. The synergistic gains or losses found in the primin are calculated taking into account possible future situations. The subjective performance expected from the target firm, which is based on the prediction, can be expressed as (Sirower,1997).
Net Present Value: Synergy – Premium.
15
2.6.2 Synergy ≥ Premium
It shows discount pozitive synergy equal to orgreater than prime. This is a indicator of succesfull buying activity. It seems that acquirer company has created value for shareholders.
2.6.3 0 ≤ Synergy ≤ Premium
Discounted synergy is positive shows that the amount less than the Premium which is already paid. It is known that the most common situation in the purchasing activies. Actually it is a failing activity. They have a positive synergy but when they are examined by the purchaser firms, it is clear that the managers overpaid and that the wealthy of the managers is decreasing as a result of this payment.
2.6.4 Synergy < 0
It is shows that the result of the actvity is not economic (negative synergy). There is a decline in value. From the point of view the purchaser firms, it is obvious that the target company transfer of wealthy to the sharesolders. In a good many purchasing activities, it is known that the target firm has a Premium over market value for shareholders. According to the results of Goldberg and Godwin (2001), the shareholders of the target company in mergers and acquisitions are found to have an average of 20% on friendly mergers and 35% on forced seizures. In this case, the primer achieves an accurate and fully calculated value, and the elements of the subjective factors in the accounts reveal the importance of the concept of valuation.
2.7. Valuation on M&A
Valuation is one of the most research on about mergers and acquisitions. If it is known the real value of business and the paid is appropriate to value which is have to be paid, this valuation of integration will be quite succesful. Expectation from good a valuation is the nearist final result is correct. When decision of m&a behalf
16
on restructuring, company book value, the value of functioning enterprises, should be well analyzied to liquidation value, real value, discounted cash flows and profitiability per share.
According to the Eccles(1999), Valuation is among the most important issues in mergers and acquisitions. The methods that are appropriate to the conditions for obtaining a value close to the correct value in merger and acquisition provide data for the decision-making process. It has been found that the successes of mergers and acquisitions in the 1970s have been higher in the research conducted, then this success has fallen. It has been shown that the main causes of this fall are due to overpayments on mergers and acquisitions. For the acquirer firm, projects with pozitive net present value is attractive.
Net Present Value = Earnings – Net Cost
It is the possible to obtain a pozitive net present value if the gain exceed the net cost. Two important factor stand out in this case. First of these determination of the acquirer firm value. and the other is determination of profit to be earned from this activitiy. If the target company is traded in the stock market, it is possible to find market market capitalization value of the marketable securities. Actually, the most important thing is calculated to growing cash flow (net cash flow) of m&a activities. This effect contained within both cash flows and cash outflows. However, due to different risks gorups in these cash flows, different discount rates may need reduced to the present value. The three basic methods that use to valuation methods. Discount cash flows, comparable company analaysis, comparable transaction analaysis.
2.7.1 Discount Cah Flow (DCF)
The basic appraisal approach in merger and acquisition is the discount cash flows method from the capital budget theory. DCF based on the firms performs of the future. Other methods based on the firms performs of the past or current. For
17
this reason we can measure more accurate with DCF methods. When we determine the value which is the most used among of the methods, future expected cash flows shold be estimated. These estimated also known as free cash flow. Free cash flows are founded by deducting the post-tax operating income, the working capital and the increases in fixed assets, by adding depreciation.
The discount rate to be used becomes more important when is calcucated the present value of these cash flows after the cash flow is estimated. When in m&a as approtriate discount rate of business valuation is ued weighted avarage cost of capital (WACC). The weighted average cost of capital (WACC) is the calculation of the cost of capital of a firm, to which each capital category is weighted proportionately. However, when we estimeted the WACC, we can see several complexity depends on wheather it is open to public, wheater stocks are traded frequently.
It is easier to calculate WACC of publicy traded companies in countries with developed markets, the WACC is may calcutating by formulating.
WACC = E/V * Re + D/V * Rd * (1-Tc)
Where:
E: Market value of the firms equity
D: Market value of the firms debt
V: D + E
Re: Cost of equity
Rd: Cost of debt
18
Financail assest valuation model may be determined by cost of equity which is included in equity. Cost of equity is found by adding the operator‟s systematic risk (β) to the risk free securites return ratio multplied by the market risk Premium. The traditioanl formula cost of equity (COE) is:
COE = Rf+[E(Rm)-Rf]*βo
Rf = Risk free
E(Rm) = Expected return of market portfolio E(Rm)-Rf = Market risk free βo = The systematic risk Premium of stock
2.7.2 Comparable Company Analaysis
This approach that investment banking uses the acquisition value is comparable comyany analaysis. It is alsa called relative valuation. Comparable valution analaysis uses relative vaiuation metrrics for smilar companys to forecast market value. Then add a takeover Premium to define a fair price for the acquirer for pay to propose. Relatie valuation involves five steps.
2.7.2.1 Identification of smilar companies that are the smilar to target firm. Preferably, the sample of the other companies will come to the same industry target and have a similar size of capital structure.
2.7.2.2 Calculation of various relative value measures based on current market prices of the companies question.
Some analysts use relative measures based on enterprise value (EV), which is the minus value of the company‟s cash value of the company‟s debt and equity.
19
When we do comparable analaysis for want to compare to company in the same industries in investment banking, we may divide EV into EBITDA.
EBITDA is an indicator of a company's financial performance and is used as a proxy for a potential earning potential, but it also has drawbacks. In addition, EBITDA removes the cost and tax effects of debt capital by adding interest and taxes to earnings. And it is mean Earnings before Interest, Taxes, Depratiations, Amortization.
Simplest form for EBITDA calculate is
EBITDA = Operating profit + Depratiation Expense + Amortization Expense
2.7.2.3 Calculation of describtive statistic of relative value metrics and applying these measures to target firm.
Analysts typically calculate average and median values for selected relative measures and apply them to estimates of the target to determine the value of the target. Preferably, different relative measures of value generate similar estimates for the value of the target in order to gain confidence in the analytical valuation estimate. This appraisal when valuation estimates differ significantly when using different metrics, the analyst is used to decide which estimates are most accurate.
2.7.2.4 Estimation of Takeover Premium.
The objective of this phase is to estimate an acquisition premium, which is the amount that each of the target shares must exceed the market price of the acquisition price in order to persuade its shareholders to approve the merger agreement. This bonus is usually expressed as a percentage of the target stock price. The stock price of the company is subtracted from the deal price per share. The result is divided by the stock price of the company.
20
In order to estimate an appropriate spin-off premium, analysts usually look at the premiums paid in the premiums taken by the companies closest to the target firm.
2.7.2.5 Calculation of the target’s take over cost as the sum of estimated share value based on comparable values and acquisition Premium.
The estimated takeover price is considered a “fair price” to pay for control of the target company. Once the takeover price has been calculated, the acquirer must compare it with the synergies obtained from the merger to make sure the price is economically reasoable.
2.7.3 Comparable Transaction Analyasis
This analaysis use the details of the recent acquisitions of smilar companies. These methodology is very simillar to comparable company analaysis approach, but all of the comparable firms are taken over. However, the biggest challenge in this approach is to find a sufficient number of takeovers for firms that are similar to the target being analyzed. There is noo need calculate trasaction analaysis sepereatly becasue use of the last transaction data means that the acquisation Premium is already included in fee.
This analaysis involves three steps
2.7.3.1 Identification a set of recent takeover transaction.
Preferably, all of the acquisition is relate the companies in the same sector as the target. Such agreements can be difficult to find, so the analyst will have to resort to some dispute that recent merger agreements are the most valid for analysis.
2.7.3.2 Calculation of relative value measures based on compated contract prise for the sample companies.
The measures used are based on the price of complated mergers and acquisitions rhater than a current market. However these measures used here may be the same as those used in comparable company analaysis.
21
We may use two basic value for in this measurement. These are Price/Equity and Price/Book Value.
2.7.4 Price/Earning Ratio
Price earning rate simply shows how many times the net profit of the company's market value has multiplied. In other words, investors express the price they are willing to negotiate for a unit gain provided by the shareholder. Moreover price earning ratio is one of the approaches in fundamental analysis which is based on the calculation of the ratio of share price per share with earnings per share and gives the indication of the timeframe required to return the funds at the level of share prices and company profits in a certain period. Price Earning Ratio is a kind of market appreciation on business performances or prospects of the company in the future. Investors believe that a company that will have good prospects in the future will have the high Price Earning Ratio of companies which is reflected in the share prices in the market.(Lufti,Arsitha, 2016) With this method, the firm‟s equity value is misleading for three reasons. First reason is, this approach which actual P/E ratio is do not change for future term is may not reflect correctly. Second reason, only earnings per share for the next years may not represent the future. Third reason, it is necessary to include the risk that the company has in future periods.
The price /earning ratio may be calculated as:
P/E Ratio = Market Value Per Share/Earnings Per Share
22
2.7.5 Price/ Book Value
According to Pandey (2005) of these financial statement variables, the price to book value ratio is the most common and widely used by investment advisors, fund managers and investors to determine the value of ordinary shares. However Marangu and Jagongo reasearch that he market value of an asset reflects its expected earning power of cash flows. Since the book value of an asset reflects its original cost, it might differ significantly from the market value if the earning power of the asset has increased or decreased significantly since its acquisition.
Book value may be mentioned as enterprise value. But specifying it as enterprise value may also be a disadvantage. This disadvantage can arise from the use of different accounting methods. The difference in accounting methods may make the value different even in the same business. It can be used if the book value is significantly higher than the market value of the operator. It may also be appropriate to use the book value if the acquirer is to acquire assets of the other entity that are intended to be merged or acquired.
Another situation where book value may be important is the fact that a significant portion of assets, such as banks, are monetary assets. In these types of businesses, the assets are considered to be closer to the current value due to their cash or cash equivalents. Market Value / Book Value is a method that is used to show whether the company is underrated or not.This rate also gives you an idea of what you would pay if you paid too much for the company to go bankrupt. The formula of the value is the following expression.
23
2.7.5.1 Calculate descripting statistic for relative value metrics and apply these measures to the target firm.
Analysts also calculate the averages of the selected relative value measures and apply them to the firm's statistics of the target to determine the value of the target.
The bank is also an excellent asset to be able to evaluate mergers, acquisitions or share transfers. It is important to determine the value of the banks most accurately since the economic value of the objective trade in appraisal is closest to reality and expresses the measure of future earnings.
3. MERGER AND ACQUISITION of BANKING SECTOR in TURKEY
3.1 Merger and Acquisition of Banking Sector in Turkey
A parallel development between the mergers and acquisitions experienced among the world's enterprises is also happening in Turkey. Business mergers and acquisitions in Turkey; is started for the prupose of more diffucult situation of business that aims to bring back to economy, afterwards it take places at public institutions and banking sector. The fundamental reson of merger and acquisitions
in banking sector is growth in complience with other sectors and a desire to increase to market share.
24
Table 1.
As shown in Table 1 the amount of the banking sector is considerably above all other sectors. In line with this momentum in the banking sector, it is a suitable market for foraign investor.
3.2 Bank Acquisitions in Turkish Banking System
TEB – BNP Paribas (2005)
Teb started its banking activities in 1927. Teb Has signed a partnership agreement with BNP Paribas. A 42% share of TEB was bought by BNP Paribas in 2005.
25
Koçbank J.S.C. –Yapı and Kredi Bank J.S.C.(2006)
In 2006, Unicredit- Koçbank bought Yapi Kredi Bank's entirety and decided to continue its operations under Yapı Kredi's roof, taking into consideration Yapı Kredi Bank and Worldcard brand values.
Sekerbank T.J.S.C. - Bank Turan Alem Securities JSC (2006)
Sekerbank established with the name of Beet Coorperatif Bnaks J.S.C. on October 12, 1953. In addition to in 2006 Sekerbank sold about 34% of its paid capital to Bank Turanalem, one of the biggest banks in Central Asia.
Akbank T.J.S.C. – Citigroup(2007)
In 2007, Citi Group purchased 20% of Akbank‟s shares and became a partner. Moreover Citi Group ending its retail banking services in June 2013, it transferred its individual customer portfolio to Denizbank.
OYAK Bank J.S.C. – INGBANK J.C.S. (2008)
The Oyak bank, which started operating in 1984, was bought by ING Bank of Holland on May 20, 2008 for about 2 million USD 600.
Turkish Garanti Bank J.S.C. – Banco Bilbao Vizcaya(2011)
Garanti Bank started operating in 1946 in Ankara. In 2011, BBVA started to purchase the shares of Doğuş Group. Last purchase was made in 2017. Therefore the majority of the guarantees are Banco Bilbao Vizcaya.
Denizbank J.S.C – Sberbank (2012)
DenizBank was established in 1938 as a state bank to provide financing for the developing Turkish maritime industry. It joined Dexia in 2006. DenizBank, which has been operating for 6 years with Dexia's main shareholding, has fallen under the Sberbank roof, which is a Russian bank as of September 28, 2012.
26
Tekfenbank J.S.C. – Burganbank (2012)
Tekfen bank was founded in 1989 and has been active in corporate banking and investment banking. In 2006, he entered into an agreement with Eurobank and changed his name to Eurobank Tekfen. On December 21, 2012,
99.26 per cent of shares were purchased by Burgan Bank Group.
Alternatifbank – The Commercial Bank(2013)
It was founded in 1991 under the name of Alternatif Banks and started its banking activities in 1992. In 1996, the Anadolu Group acquired 80% of the Alternatif Bank and entered the finance sector. Commercial Banking (PS.Q.C.), which bought 70.8 percent of the Anadolu Group in July 2013 and then increased to 75 percent of its stock through buybacks of the shares; The remaining 25 percent share on December 19, 2016 was purchased by the Anadolu Group for $ 222.5 million, and the entire bank was the owner.
Tekstil bank- ICBC(2015)
China's ICBC Bank (China Industrial and Commercial Bank) has signed an agreement with ICBC Turkey Bank J.S.C. with a 75.5% share starting from May 22, 2015, to 668.810.011,63 TL.
Finansbank J.S.C. – QNB Group(2016)
Finansbank is started the operating on october 28 1987. In June 2016, Finansbank was acquired by Qatar National Bank S.A.Q (QNB Group), Qatar's largest bank, the leading financial institution in the Middle East and Africa region.
27
4. METHODOLOGY and DATA
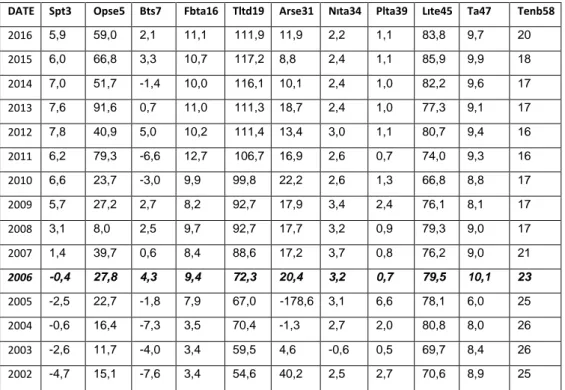
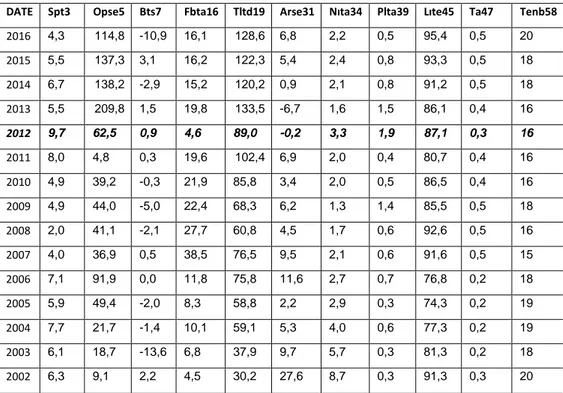
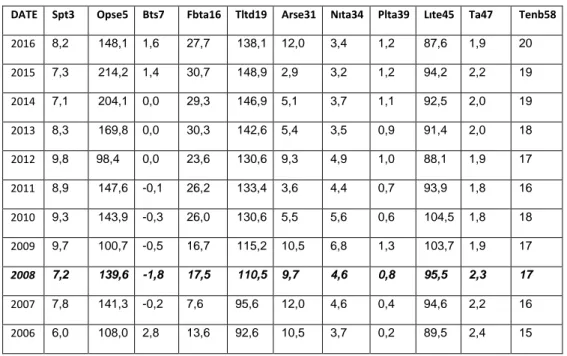
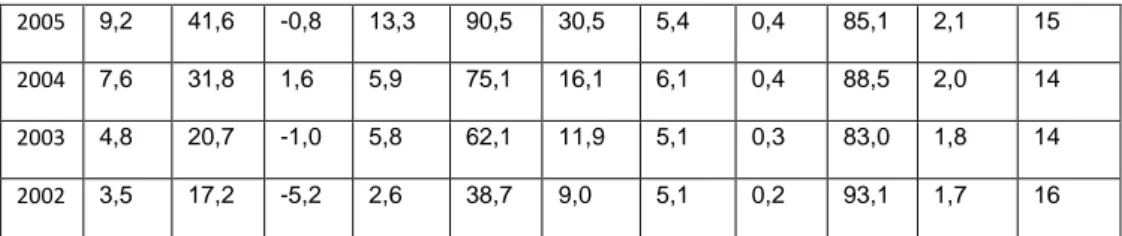
There is a concentration process in national and international banking systems in the light of recent economic and political globalization phenomenon. It is observed that banks are trying to maintain their assets in a strong way, taking advantage of economies of scale, in increasingly competitive conditions, through mergers and acquisitions. The sample group in this study is composed of eleven private and foreign banks subject to purchase, merger or share transfer transactions operating in the Turkish banking sector. Banks in which some or all of their shares are bought by foreigners are included in the study. In the analysis, it was benefited from the dataset titled 'Selected Ransos' (Table 2) published by the Banks Association of Turkey. This analaysis period covers a total of fifteen periods (2002-2016). The banks subject the anlaysis are listed. These are listed as
Turkish Garanti Bank J.S.C., Şekerbank T.J.S.C., Akbank T.J.S.C., INGBANK J.C.S., Denizbank J.S.C, Burgan bank, Alternatif bank, ICBC, QNB Finansbank J.S.C., Yapı and Kredi Bank J.S.C., TEB BNP Paribas.
Factor analysis will be used in this study. The independent values immediately following it will be tested with the probit model. First this terms will be explained in this study after that tha datas we find in Bank Association of Turkey will be analyzed (Table 2). Eventually meaningful varaibles will be examined one by one and which merged banks will be found to be significant.
4.1. Factor Analysis
Factor analysis is a technique that allows a small number of but independent variable sets to be obtained by combining moderately or highly related variables with each other. It is thus possible to reduce many variables to a few clusters or sizes. Each of these dimensions or clusters is called a factor. Factor analysis is a statistical technique that aims to explain the measurement by collecting variables that measure the same or by measuring the quality with a few
28
factors. Factor analysis is also defined as the process of finding new concepts (variables) called factoring or common factor, or obtaining the functional definitions of concepts using the factor loadings of the items. That‟s why we will use the factor anlaysis in this study for finding relation value among of merged banks. After this analaysis is used, variable reduced, no relation between new variables or factor produced and meaningful factors were obtained.
Table2. Ratios are used in factor alayasis
Capital Ratios, % Income-Expenditure Structure, %
1.Capital Adequacy Ratio
34.Net Interest Income After Specific Provisions / Total Assets
2.Shareholders' Equity / Total Assets
35.Net Interest Income After Specific Provisions / Total Operating Income 3.(Shareholders' Equity-
Permanent Assets) / Total Assets
36.Non-Interest Income (Net) / Total Assets
4.Shareholders' Equity /
(Deposits + Non-Deposit Funds)
37.Non-Interest Income (Net) / Other Operating Expenses
5.On Balance-sheet FC Position / Shareholders' Equity
38.Other Operating Expenses / Total Operating Income
6.N(on+off) Balance-sheet Position / Total Shareholders' Equity
39.Provision For Loan or Other Receivables Losses / Total Assets Balance-Sheet Ratios, % 40.Interest Income / Interest Expense
7.TC Assets / Total Assets
41.Non-Interest Income / Non-Interest Expense
8.FC Assets / Total Assets 42.Total Income / Total Expense 9.TC Liabilities / Total
Liabilities 43.Interest Income / Total Assets 10.FC Liabilities / Total 44.Interest Expense / Total Assets
29
Liabilities
11.FC Assets / FC Liabilities 45.Interest Income / Total Expenses 12.TC Deposits / Total Deposits 46.Interest Expense / Total Expenses 13.TC Loans and Receivables* /
Total Loans and Receivables* Share in Sector, % 14.Total Deposits / Total Assets 47.Total Assets 15.Funds Borrowed / Total
Assets 48.Total Loans and Receivables*
Assets Quality, % 49.Total deposits 16.Financial Assets (Net) / Total
Assets Share in Group, %
17.Total Loans and Receivables*
/ Total Assets 50.Total Assets 18.Total Loans and Receivables*
/ Total Deposits 51.Total Loans and Receivables* 19.Loans under follow-up (gross)
/ Total Loans and Receivables* 52.Total Deposits 20.Loans under follow-up (net) /
Total Loans and Receivables* Branch Ratios, %
21.Specific Provisions / Loans 53.Total Assets / No. of Branches under follow-up (gross)
22.Permanent Assets / Total
Assets 54.Total Deposits / No. of Branches
23.Consumer Loans / Total
Loans and Receivables* 55.TRY Deposits / No. of Branches Liquidity, % 56.FX Deposits / No. of Branches
24.Liquid Assets / Total Assets
57.Total Loans and Receivables* / No. of Branches
25.Liquid Assets / Short-term Liabilities
58.Total Employees / No. of Branches (person)
30
26.TC Liquid Assets / Total
Assets 59.'Net Income / No. of Branches
27.Liquid Assets / (Deposits +
Non-Deposit Funds) Activity Ratios, % 28.FC Liquid Assets / FC
Liabilities
60.(Person. Exp. + Res. for Emp. Terminat. Benefit) / Total Assets
Profitability, %
61.(Pers. Exp. + Reser. for Emp.
Terminat. Benefit) / Num. of Per.l (Thous. TRY)
30.Average Return on Assets
62.Reserve for Emp. Termin. Benefit / Num. of Per. (Thous TRY)
31.Average Return on Shareholders‟ Equity
63.Personnel Expenses / Other Operating Expenses
32.Income Before Taxes / Total Assets
64.Other Operating Expenses / Total Asset
33.Net Profit (Losses) / Paid-in
Capital 65.Total Operating Income / Total Assets
66.Net Operating Income(Loss) / Total Assets
Source: The Bank Association of Turkey “Selected Ratio”
31
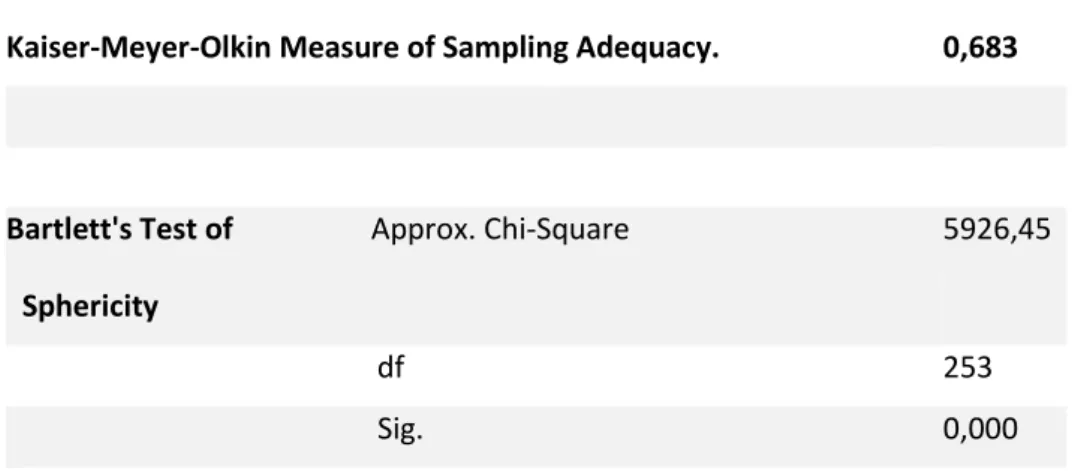
Table 3. KMO-Bartlett Statictic Test
Kaiser-Meyer-Olkin Measure of Sampling Adequacy. 0,683
Bartlett's Test of Approx. Chi-Square Sphericity
5926,45
df 253
Sig. 0,000
First, the Kaiser Meyer-Olkin statistic and the Barlett sphericity test statistic, which are developed for consistency of variable values, are examined.
Bartlett statistic have χ² variabel. This variabel measure the level of relationship between variables. The Table 3. Shows that p-value is < 0,05 that the variabels are significant. There is a relatioship structure for factor analysis. Then, we need the look KMO statistic value to see if there is a enough sample. Due tho table 3 shows that, 0,683 > 0,67 which means the sample size is enough for factor analysis. Because For the fit to factor analysis, the condition of p value is to be bigger by 0.67 degrees. In this study seems to have provided this condition.
As shown in Table (4), Eigenvalues indicating the correlation between two variables were found to be more than eleven factors. This eleven factors account for about 90 % of the total variance. The maşn goal of using factor analysis inthis study is that 66 of the financial indicator were used in our study are related to each other. Another reason is that multivariate analysis such as probit, logit will cause multiple linear dependence. Therefore it is aimed to choose an objective method that might explain the majority of the 66 variables.
32
Table 4. Total Variance Explained
Component
Initial Eigenvalues
Extraction Sums of Squared Loadings Total % of Variance Cumulative % Total % of Variance Cumulative % 1 14,085 21,341 21,341 14,085 21,341 21,341 2 12,437 18,844 40,185 12,437 18,844 40,185 3 7,615 11,539 51,724 7,615 11,539 51,724 4 5,041 7,637 59,361 5,041 7,637 59,361 5 3,840 5,818 65,180 3,840 5,818 65,180 6 3,360 5,090 70,270 3,360 5,090 70,270 7 3,179 4,816 75,086 3,179 4,816 75,086 8 2,270 3,439 78,525 2,270 3,439 78,525 9 2,119 3,210 81,735 2,119 3,210 81,735 10 1,670 2,530 84,265 1,670 2,530 84,265 11 1,509 2,286 86,551 1,509 2,286 86,551 12 1,112 1,685 88,235 1,112 1,685 88,235 13 1,025 1,553 89,789 1,025 1,553 89,789 14 ,966 1,463 91,252 15 ,744 1,128 92,380 16 ,714 1,082 93,462 17 ,579 ,877 94,339 18 ,552 ,836 95,175 19 ,446 ,677 95,852 20 ,424 ,642 96,494 21 ,333 ,505 96,999 22 ,288 ,436 97,435 23 ,255 ,387 97,821 24 ,202 ,306 98,128 25 ,174 ,263 98,391 26 ,143 ,217 98,608 27 ,121 ,183 98,790 28 ,109 ,166 98,956 29 ,094 ,142 99,098 30 ,089 ,135 99,233 31 ,077 ,116 99,349 32 ,066 ,100 99,449 33 ,048 ,073 99,521 34 ,046 ,069 99,591 35 ,041 ,062 99,653 36 ,037 ,056 99,709 37 ,032 ,049 99,757 38 ,025 ,037 99,795 39 ,021 ,032 99,827
33 40 ,019 ,029 99,855 41 ,018 ,028 99,883 42 ,014 ,022 99,905 43 ,010 ,015 99,920 44 ,009 ,014 99,935 45 ,008 ,013 99,947 46 ,007 ,011 99,958 47 ,005 ,008 99,966 48 ,005 ,007 99,974 49 ,004 ,007 99,980 50 ,003 ,005 99,985 51 ,002 ,003 99,988 52 ,002 ,003 99,992 53 ,002 ,002 99,994 54 ,001 ,002 99,996 55 ,001 ,002 99,998 56 ,001 ,001 99,999 57 ,000 ,001 100,000 58 ,000 ,000 100,000 59 ,000 ,000 100,000 60 ,000 ,000 100,000 61 ,000 ,000 100,000 62 ,000 ,000 100,000 63 ,000 ,000 100,000 64 ,000 ,000 100,000 65 ,000 ,000 100,000 66 ,000 ,000 100,000
Extraction Method: Principal Component Analysis.
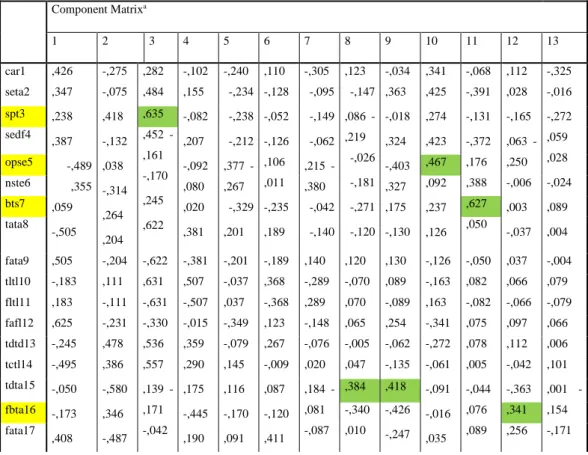
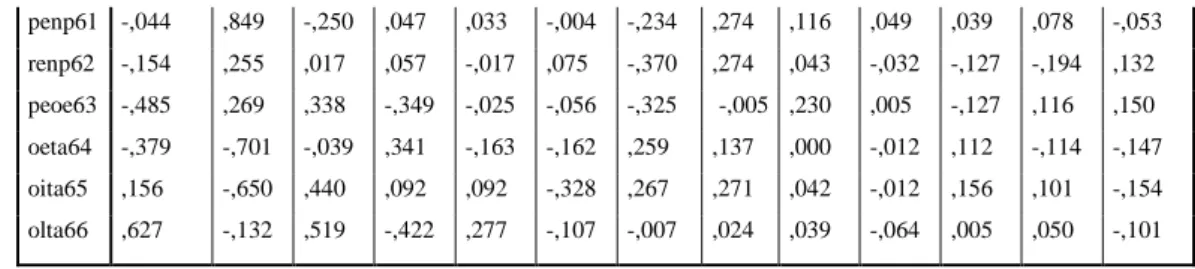
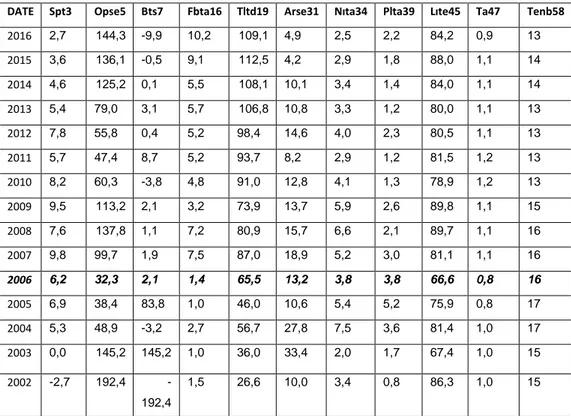
As a result, 11 definable, meaningful variables were obtained from 66 rations given in Table (4). The abbreviations in the first column are abbreviations for the 66 data from The Bank Association of Turkey. The data names marked in yellow are the data that will be used in the probit model. In this table, the ratios that represent the most relationship within each dimenson are chosen.
34
The names of the variabels in the table are as follows.
spt3: (Shareholders' Equity-Permanent Assets) / Total Assets opse5: On Balance-sheet FC Position / Shareholders' Equity
bts7: N(on+off) Balance-sheet Position / Total Shareholders' Equity fbta16: Funds Borrowed / Total Assets
tltd19: Total Loans and Receivables* / Total Deposits arse31: Average Return on Shareholders‟ Equity
nita34: Net Interest Income After Specific Provisions / Total Assets plta39: Provision For Loan or Other Receivables Losses / Total Assets
lite45: Interest Income / Total Expenses ta47: Total Assets
tenb58: Total Employees / No. of Branches (person)
Table 5. Component Factor Analaysis
Component Matrixa 1 2 3 4 5 6 7 8 9 10 11 12 13 car1 ,426 -,275 ,282 -,102 -,240 ,110 -,305 ,123 -,034 ,341 -,068 ,112 -,325 seta2 ,347 ,238 ,387 -,489 ,355 ,059 -,505 -,075 ,418 -,132 ,038 -,314 ,264 ,204 ,484 ,155 -,082 ,207 -,092 ,080 ,020 ,381 -,234 -,238 -,212 ,377 -,267 -,329 ,201 -,128 -,052 -,126 ,106 ,011 -,235 ,189 -,095 -,149 -,062 ,215 -,380 -,042 -,140 -,147 ,086 -,219 -,026 -,181 -,271 -,120 ,363 -,018 ,324 -,403 ,327 ,175 -,130 ,425 ,274 ,423 -,391 -,131 -,372 ,176 ,388 ,028 -,165 ,063 -,250 -,006 ,003 -,037 -,016 -,272 ,059 ,028 -,024 ,089 ,004 spt3 ,635 sedf4 ,452 -,161 -,170 ,245 ,622 opse5 ,467 nste6 ,092 ,237 ,126 bts7 ,627 tata8 ,050 fata9 ,505 -,204 -,622 -,381 -,201 -,189 ,140 ,120 ,130 -,126 -,050 ,037 -,004 tltl10 -,183 ,111 ,631 ,507 -,037 ,368 -,289 -,070 ,089 -,163 ,082 ,066 ,079 fltl11 ,183 -,111 -,631 -,507 ,037 -,368 ,289 ,070 -,089 ,163 -,082 -,066 -,079 fafl12 ,625 -,231 -,330 -,015 -,349 ,123 -,148 ,065 ,254 -,341 ,075 ,097 ,066 tdtd13 -,245 ,478 ,536 ,359 -,079 ,267 -,076 -,005 -,062 -,272 ,078 ,112 ,006 tctl14 tdta15 -,495 -,050 -,173 ,408 ,386 -,580 ,346 -,487 ,557 ,139 -,171 -,042 ,290 ,175 -,445 ,190 ,145 ,116 -,170 ,091 -,009 ,087 -,120 ,411 ,020 ,184 -,081 -,087 ,047 -,135 -,061 -,091 -,016 ,035 ,005 -,044 ,076 ,089 -,042 -,363 ,101 ,001 -,154 -,171 ,384 ,418 fbta16 -,340 ,010 -,426 -,247 ,341 fata17 ,256
35 trta18 -,306 -,257 -,264 ,817 ,223 ,068 -,117 ,025 -,111 ,389 ,066 -,008 ,287 -,240 -,228 ,174 ,104 ,027 ,031 -,046 -,147 ,389 ,157 -,097 -,107 -,070 -,037 ,319 -,088 -,074 ,054 -,111 ,107 ,246 -,030 -,046 ,261 tltd19 ,865 lutl20 -,387 lntl21 -,398 -,264 -,362 ,180 ,477 ,336 -,050 ,114 -,125 ,205 -,170 ,121 ,057 splf22 ,529 ,047 ,285 ,117 -,244 -,159 ,155 ,289 -,191 ,228 ,068 ,076 ,128 pata23 ,009 -,575 -,356 ,234 ,088 -,048 ,100 -,232 ,336 ,033 -,179 ,227 ,318 cltr24 ,351 ,252 ,270 ,335 -,093 ,186 ,533 -,069 -,159 -,169 -,152 -,095 ,078 lata25 ,453 -,453 ,112 -,323 -,498 ,090 -,213 ,133 -,263 ,049 ,054 -,106 ,163 lasl26 ,264 -,359 -,160 -,246 -,132 ,234 -,107 ,341 -,332 -,087 -,480 ,088 ,012 tclta27 ,246 -,310 ,458 -,011 -,320 ,354 -,326 -,058 -,238 ,101 ,082 -,140 ,060 ladf28 ,474 -,472 ,120 -,282 -,489 ,054 -,187 ,095 -,251 ,088 ,021 -,114 ,199 fafl29 ,391 -,334 -,024 -,212 -,463 -,051 -,155 ,300 -,106 -,108 ,116 ,037 ,291 V33 ,548 ,396 ,633 -,106 -,063 -,093 ,446 ,369 ,503 -,397 -,481 -,388 ,504 ,035 ,089 -,089 ,047 -,016 ,001 -,046 -,050 -,025 ,051 ,041 ,029 ,011 -,009 -,044 ,098 ,109 ,021 -,003 -,031 ,048 ,103 ,164 ,007 arse31 ,604 ibta32 ,383 nppc33 ,598 -,038 ,062 -,244 ,318 ,541 -,391 -,369 ,414 -,226 ,068 ,121 -,030 ,052 ,172 -,011 ,193 -,054 -,043 ,029 ,114 -,127 ,076 ,230 -,132 nita34 ,529 nito35 -,279 ,336 ,176 -,517 -,276 ,435 ,395 ,009 ,080 ,062 ,080 -,088 -,044 nita36 ,305 -,635 -,005 ,328 ,257 -,454 -,167 ,038 -,119 -,057 ,037 -,076 -,132 nioe37 ,733 -,320 -,011 ,286 ,251 -,301 -,259 -,038 -,138 -,032 ,016 -,036 -,070 oeto38 -,575 -,266 ,013 -,246 -,099 ,530 -,447 ,074 ,525 ,193 -,154 -,067 -,163 ,249 -,310 -,169 ,123 ,225 ,402 -,092 ,390 ,257 -,140 ,022 -,136 ,256 ,128 ,019 ,098 ,184 -,036 -,263 ,358 ,112 ,049 ,092 ,066 plta39 ,525 iiie40 -,048 nine41 ,734 -,315 -,009 ,289 ,249 -,292 -,264 -,036 -,140 -,033 ,013 -,037 -,067 tite42 ,664 ,289 ,468 -,034 ,151 -,170 ,146 ,227 -,102 ,071 ,052 ,134 -,021 iita43 -,167 -,767 ,092 -,141 ,125 ,297 ,261 ,145 ,205 ,065 ,122 ,090 -,155 ieta44 -,139 -,478 ,279 -,795 ,348 -,247 ,189 ,137 -,189 ,031 -,260 -,095 -,089 -,054 -,433 -,281 ,282 ,294 ,220 -,178 ,299 -,064 -,055 ,328 ,040 ,257 -,267 ,223 ,282 ,008 ,033 -,138 -,109 -,167 ,150 ,160 ,211 -,028 -,006 ,054 ,116 ,106 ,002 -,022 ,058 -,014 ,061 -,011 -,020 -,001 ,166 ,166 -,021 -,004 -,147 ,024 -,072 -,019 ,004 iite45 ,518 iete46 ,493 ,208 ,171 ta47 ,861 tlr48 ,849 td49 ,856 ,187 -,113 ,299 -,057 ,206 ,232 -,085 -,009 -,011 -,007 -,034 -,017 ta50 ,861 ,192 -,098 ,281 -,063 ,208 ,222 -,106 -,027 ,003 -,011 -,021 -,018 tlr51 ,853 ,124 -,098 ,290 -,053 ,168 ,282 -,166 -,002 -,018 -,024 ,000 ,005 td52 ,856 ,187 -,113 ,299 -,057 ,206 ,232 -,085 -,009 -,011 -,007 -,034 -,017 tanb53 ,337 ,772 -,404 ,028 ,033 ,037 -,121 ,226 ,056 ,099 ,080 ,038 -,020 tdnb54 ,361 ,751 -,388 ,078 ,063 ,045 -,089 ,255 ,140 ,112 ,076 -,042 -,007 trnb55 ,297 ,824 -,216 ,177 ,045 ,111 -,089 ,229 ,058 ,016 ,081 ,008 ,010 fxnb56 ,385 ,581 -,527 -,038 ,074 -,032 -,078 ,252 ,211 ,202 ,060 -,090 -,025 trnb57 ,212 ,035 ,736 ,827 -,188 ,396 -,357 -,251 ,157 -,006 -,138 -,151 ,052 -,021 ,369 -,033 -,388 ,126 -,088 ,341 -,003 ,261 -,406 ,042 ,111 -,020 ,041 ,073 ,229 ,088 ,045 -,012 ,080 -,005 ,046 -,051 -,042 tenb58 ,282 ninb59 ,113 peta60 -,537 -,556 ,358 -,024 -,068 -,147 ,009 ,178 ,190 -,053 -,004 -,053 ,035