INVESTORS’ REACTION TO LITIGATION ANNOUNCEMENTS BY CAPITAL MARKETS BOARD OF TURKEY
A Master’s Thesis
by
MAHMUT MUSTAFA ÖZÇİÇEK
Department of Management
İhsan Doğramacı Bilkent University Ankara September 2019 M AHMUT M USTA FA ÖZÇ İÇ EK INV EST OR S’ REAC TION T O B ilk en t Un iversi ty 2 01 9 LITIGATIO N AN N OU N C EM EN TS
III
INVESTORS’ REACTION TO LITIGATION ANNOUNCEMENTS BY CAPITAL
MARKETS BOARD OF TURKEY
The Graduate School of Economics and Social Sciences of
İhsan Doğramacı Bilkent University by
MAHMUT MUSTAFA ÖZÇİÇEK
In Partial Fulfillment of the Requirements for the Degree of MASTER OF SCIENCE
THE DEPARTMENT OF MANAGEMENT
İHSAN DOĞRAMACI BİLKENT UNIVERSITY ANKARA
V
ABSTRACT
INVESTORS’ REACTION TO LITIGATION ANNOUNCEMENTS BY CAPITAL MARKETS BOARD OF TURKEY
Özçiçek, Mahmut Mustafa
M.S., Department of Management
Supervisor: Asst. Prof. Dr. Ayşe Başak Tanyeri
September 2019
I empirically investigate investors’ reaction to the litigations announcements published by Turkish Capital Markets Board (CMB). I use event study to analyze daily abnormal returns for significant market reactions. I compile a litigation announcements sample that spans 202 events of 145 unique stocks between January 20, 2012 and January 3, 2019. My findings show that investors perceive litigations announcements as bad news. Statistically significant negative responses happen both on event day and two days after, hinting difference in investor behavior. I find that the negative reaction to the news are significantly higher for corporations announcements than they are for individual announcements. The negative reaction is significantly higher for indictments announcements than they are for administrative fees.
Keywords: Cross-sectional study, Event Study, Insider Trading, Litigation, Manipulation
VI
ÖZET
SERMAYE PİYASALARI KURULU’NUN İDARİ PARA CEZALARINA VE SUÇ DUYURULARINA YATIRIMCILARIN TEPKİSİ
Özçiçek, Mahmut Mustafa
Yüksek Lisans, İşletme Bölümü
Danışman: Dr. Öğr. Üyesi Ayşe Başak Tanyeri
Eylül 2019
Bu tezde Sermaye Piyasaları Kurulu (SPK) tarafından yayınlanan idari para cezası ve suç duyurusu bildirilerine yatırımcıların tepkisini ampirik olarak inceliyorum. Olay incelemesi metoduyla günlük anormal getirileri bildiri günleri etrafında analiz
ediyorum. Örnekj küme, 20 Ocak 2012 ile 3 Ocak 2019 arasında 145 hisseye dair 202 olayı kapsayan SPK bildirilerinden oluşuyor. Sonuçlara göre yatırımcılar bu ilanları kötü haber olarak algılıyor. Olay günü ve iki gün sonrasında bulduğum istatistiksel olarak anlamlı negatif anormal getiriler yatırımcı davranışında farklılığa işaret ediyor. Şirketlere verilen cezaların bildirilerinin, kişilere verilen cezaların bildirilerine göre daha büyük negatif piyasa tepkisi yarattığını buldum. Piyasanın suç duyurularına verdiği negatif tepki de idari para cezalarına verdiği negatif tepkiden anlamlı derecede daha büyük.
Anahtar Kelimeler: Bilgi Suistimali, Enine-kesit Çalışma, Manipülasyon, Olay Çalışması, Regülasyon Cezaları.
VII
ACKNOWLEDGEMENTS
First and foremost, I want to take mother, Aynur Özçiçek, and my father, Ahmet Özçiçek, for their unconditional support and love.
I would like to thank Asst. Prof. Dr. Ayşe Başak Tanyeri for her patience, support, and invaluable guidance in the course of my study.
I am grateful to Assoc. Prof. Dr. Süheyla Özyıldırım and Asst. Prof. Dr. İlkay Şendeniz Yüncü as my thesis committe members for their insightful comments and
suggestions.
I want to express my deepest sympathy for Asst. Prof. Dr. Tarık Kara, Assoc. Prof. Dr. Selin Sayek Böke, and Assoc. Prof. Dr. Zeynep Önder. They are paragon
academicians who always cast a spark of brilliance into my heart.
I would also like to extend my gratitude to our Graduate Programs Coordinator, Remin Tantoğlu. Her selfless behavior and exceptional sympathy always put a smile on my face and gave me the motivation and hope to get back on my track when I needed it the most.
Finally, I want to thank Özal Çapar and Merve Mallı for their valuable help with my work.
VIII
TABLE OF CONTENTS
ABSTRACT ... IV ÖZET ... VI ACKNOWLEDGEMENTS ... VII TABLE OF CONTENTS ... VIII LIST OF TABLES ... X LIST OF FIGURES ... XI
CHAPTER 1: INTRODUCTION ... 1
CHAPTER 2: LITERATURE REVIEW ... 5
2.1 Securities Enforcement Literature ... 5
2.2 Manipulation Theory Literature ... 10
2.3 Parametric Event Study Literature ... 17
CHAPTER 3: SAMPLING STRATEGY AND METHOD ... 21
3.1 Sampling Strategy ... 21
3.1.1 The Sample of Turkish Stock Market Litigation Announcements ... 21
3.1.2 Sample Summary ... 23 3.1.3 Returns Data... 26 3.2 Method ... 26 3.2.1 Event Study ... 26 3.2.2 Abnormal Returns ... 26 3.2.3 Tests ... 28
CHAPTER 4: TESTABLE HYPOTHESES ... 32
4.1 Main Hypothesis ... 32
4.2 Hypothesis 2 ... 33
IX
4.4 Hypothesis 4 ... 34
4.5 Hypothesis 5 ... 35
4.6 Hypothesis 6 ... 35
CHAPTER 5: EMPIRICAL RESULTS ... 37
5.1 The Tests of Hypotheses ... 37
5.1.1 Main Hypothesis ... 37
5.1.2 Hypotheses 2 and 3 ... 47
5.1.3 Difference in Means Tests ... 53
5.2 Implications ... 59
CHAPTER 6: CONCLUSION ... 61
X
LIST OF TABLES
Table 1: Subsample Descriptions ... 25
Table 2: Cross-distribution of Subsample Observations ... 25
Table 3: Total Sample Abnormal Returns and Test Statistics ... 38
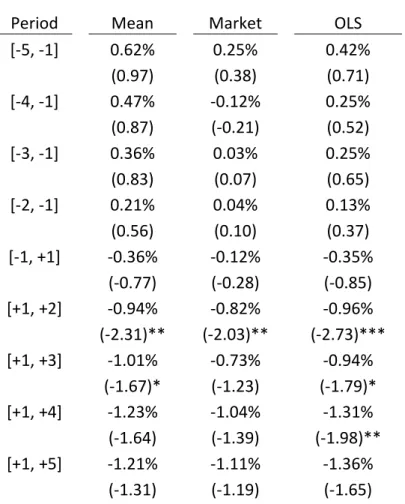
Table 4: Total Sample Cumulative Abnormal Returns Around Event Day ... 42
Table 5: Mean Adjusted Model Abnormal Returns and Test Statistics ... 44
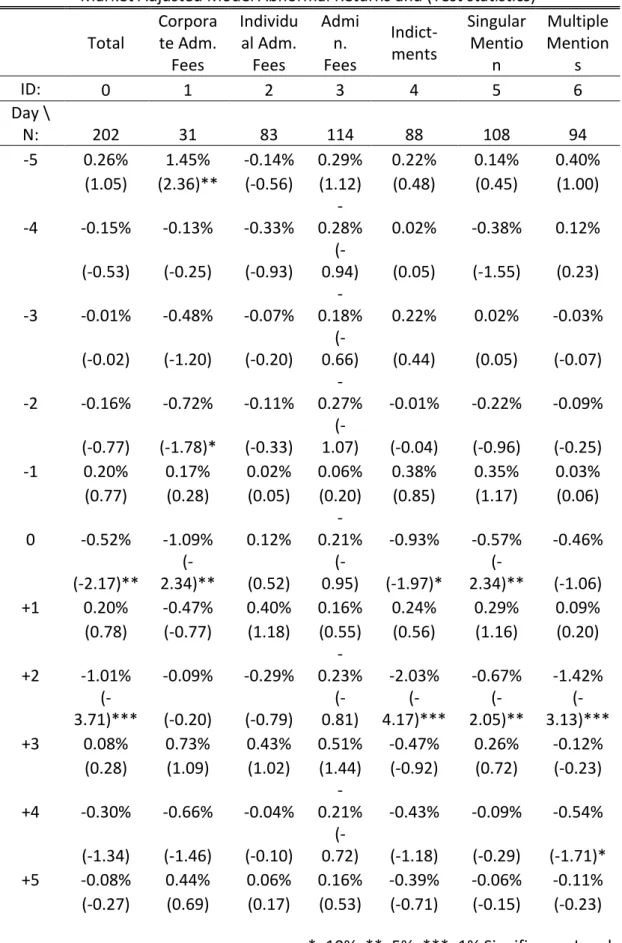
Table 6: Market Adjusted Model Abnormal Returns and Test Statistics ... 45
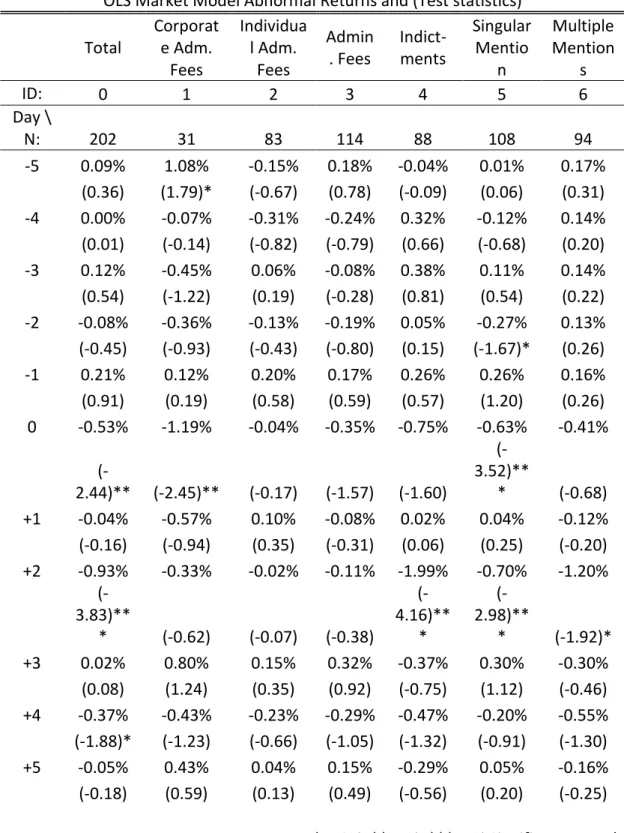
Table 7: OLS Market Model Abnormal Returns and Test Statistics ... 46
Table 8: Total Sample Cumulative Abnormal Returns and Test Statistics ... 48
Table 9: Corporations Subsample Cumulative Abnormal Returns and T-statistics ... 49
Table 10: Mean Adjusted Cumulative Abnormal Returns and Test Statistics ... 50
Table 11: Market Adjusted Cumulative Abnormal Returns and Test Statistics ... 51
Table 12: OLS Adjusted Cumulative Abnormal Returns and Test Statistics ... 52
Table 13: Test Statistics (AR) for Hypothesis Test 4 ... 54
Table 14: Test Statistics (CAR) for Hypothesis Test 4 ... 54
Table 15: Test Statistics (AR) for Hypothesis Test 5 ... 56
Table 16: Test Statistics (CAR) for Hypothesis Test 5 ... 57
Table 17: Test Statistics (AR) for Hypothesis Test 6 ... 58
XI
LIST OF FIGURES
LIST OF FIGURES
Figure 1: Total Sample Abnormal Returns plot ... 39 Figure 2: Total Sample Cumulative Abnormal Returns plot ... 39
1
CHAPTER 1
INTRODUCTION
This thesis investigates how investors in the stock market react to announcements that Capital Markets Board of Turkey is opening litigations and levying
administrative fines against traders and/or firms for manipulative and abusive actions. I compile a unique dataset of 202 events (relating to 145 stocks) based on announcements of administrative fees against market abuse actions (see Turkish Capital Market Law (Turkish CML), Article 104 and 105 at
http://www.cmb.gov.tr/Sayfa/Dosya/87) and indictments against insider trading (see Turkish CML, A106) and manipulation (see Turkish CML, A107). The
announcements sample span the period between January 20, 2012 and January 3, 2019.
Capital Markets Board of Turkey defines transactions seeking monetary gains based on information unavailable to public as insider trading. Any market activity with purpose of deception regarding price, return, demand, and supply of capital market instruments is defined as manipulation. Administrative fees are charged for cases when a market participant fails to comply with the rules with no support for ill-content.
Indictments are announced against actions listed by Article 106 and 107 of Turkish Capital Market Law, defining “insider trading” and “manipulation, respectively. Insider trading is defined as giving, changing, or cancelling purchase or sale orders
2
of stocks for monetary gains based on information that is not declared to public. Those who commit these actions are sentenced to prison from 2 years up to 5 years, or punished by a judicial fee (Capital Market Law, Article 106). Manipulation is defined as market activity that have the purpose of creating wrong information or deception regarding the prices of capital market instruments, their returns, or their supplies and demands. Manipulation punishment is imprisonment from 2 years up to 5 years with judicial fines from five thousand days up to ten thousand days, while the amount of fines are to be imposed so that it exceeds the benefit obtained from the crime (Capital Market Law, Article 107).
I measure how investors react to litigation announcements using event study method (Brown & Warner, 1985). Event study method benchmarks realized returns against expected returns to calculate abnormal returns. I use three returns
generating models to measure abnormal returns: 1) Mean Adjusted Model, 2) Market Adjusted Model, 3) OLS Market Model. I study how investors react in the stock market to litigation and administrative fees announcements in three dimensions. First, I test whether the investors’ reaction is statistically significant. This lets me deduce if the investors change their mind about their valuation of the asset in question. Second, I examine the direction of these reactions, whether the announcements are perceived as bad or good news. Third, I measure cumulative abnormal returns to see how long the reactions last and see if the investors can immediately price the news.
My main results show two distinct investor reactions. First, negative abnormal returns for stocks mentioned in litigation announcements happen on the event day
3
with a mean adjusted abnormal return of -0.6% (statistically significant at 5%). The five-day cumulative abnormal returns average -1.33% (statistically significant at 5%). The markets perceive CMB announcements as bad news.
I also analyze whether investors’ reaction differs based on the identity of the defendant (corporation or individual), type of the enforcement action
(administrative fees or indictments), and whether the litigated stock faced litigation once or multiple times in the period my sample covers. Announcements of
indictments are only targeted at individuals. A difference in investor reactions to the announcements of indictments and administrative fees would then introduce a bias to the analysis of the reactions based on the type of defendant. To examine the difference in investors’ reaction to the CMB announcements based on the identity of the defendant, I restrict corporations (31 observations) and individuals (83 observations) subsamples to the announcements of administrative fees (114 observations).
Indictments subsample event day abnormal returns are not statistically significant on the event day. However, day 2 mean adjusted abnormal return is -2.04% and significant at 1% level, consistent for three benchmark abnormal returns models. On the contrary, I observe no consistent statistically significant abnormal returns for the administrative fees subsample on any event window day. I divide the
administrative fees subsample into two subsets based on the identity of the
defendant: corporations subsample and individuals subsample. Announcements of administrative fees levied to corporations yield a mean adjusted return of -1.52% (significant at 1%) on the event day whilst announcements of individual
4
administrative fees do not cause significant abnormal returns on any event window day. Investors’ reaction to CMB announcements that feature stocks that show up only once in the period my sample covers corresponds to mean adjusted abnormal return of -0.82% (significant at 1%). Announcements featuring stocks that are mentioned multiple times in the sample do not evoke any statistically significant abnormal returns on the event day. However, on day 2, I find a mean adjusted abnormal return of -1.20% (significant at 1%).
The difference in means tests I run yield two lateral findings. First, investors’
immediate reactions to announcements of administrative fees against corporations are statistically significant and more severe than for the announcements individuals charged. Second, the delayed response (on day 2) is significantly different and more severe for announcements of indictments than they are for announcements of administrative fees. I detect no significant deviance in investor reactions to stocks that are mentioned multiple times in the sample and those who are mentioned only once. This means I find no evidence that investors price the probability of
misconduct of a stock.
The rest of the thesis is as organized as follows: Chapter II summarizes event study and litigations literatures, Chapter III describes my sampling strategy and method, Chapter IV states testable hypotheses, Chapter V reports empirical results, and Chapter VI concludes the thesis.
5
CHAPTER 2
LITERATURE REVIEW
I study the how the investors react to the announcements of litigations
(indictments) and administrative fees published by the Capital Markets Board of Turkey. I utilize the event study method. Event study method is used to asses the impact of an event (mergers, earnings announcements, death of insiders, etc.) on the value of securities. The method has been a tool of analysis in finance and economics; as well as it has been for other disciplines, related (e.g., accounting) or not (e.g., medicine). In the literature, one way researchers utilize event study is to determine market and investor reaction to announcements by regulatory bodies, mainly for American, Canadian, and European exchanges. These papers study how the investors’ reaction to litigation announcements differ based on sources of information; whether the reactions differ based on the properties of the
enforcement action (such as violation type, party charged, length of punishment); as well as examining market efficiency by looking at how long these reactions last. I highlight these studies that open the path before my study, before I present my analysis of similar nature in the Turkish stock exchange.
2.1 Securities Enforcement Literature
The impact of the enforcement actions taken by Securities and Exchange Commission of United States (SEC) and other equivalent regulatory bodies have been scrutinized in the financial literature (Howe & Schlarbaum, 1986; Huskey & Muradoglu, 2008; Kryzanowski, 1978; Kryzanowski, 1979; Nourayi, 1994; Persons,
6
1997). The regulation intends to ensure market efficiency, trust that investors have for the market mechanisms, information equality, and prevention of manipulative activities. As such, corporations are bound to register corporate events such as financial statements, bulk sales or repurchases of their own equity. Failing to register or publish such information is punishable by regulatory bodies (see Turkish Capital Market Law, Articles 103 through 112). On top of these, regulatory bodies also directly punish insider trading and detected manipulation, as defined in Turkish Capital Market Law, Article 106 and 107 respectively. These actions or misconducts are unwanted and regulated by the Capital Markets Board of Turkey as they disrupt the market mechanisms and asset valuation. Litigations against these actions have been the subject of numerous studies, most of which revolve around the SEC
litigations. Below I summarize the findings of such studies that are closely related to my research.
Kryzanowski (1978) analyzes the the effect of regulatory actions, more specifically temporary suspension punishments charged against alleged manipulations in the Canadian Capital Markets empirically. Analysis focuses on four major stock
exchanges of Canada: Canadian Stock Exchange (CSE), the Montreal Stock Exchange (MSE), the Toronto Stock Exchange (TSE), and the Vancouver Stock Exchange (VSE). The paper uses event study method with Fama-Fisher-Jensen-Roll test and single-factor market model portfolio test. Author calculates weekly returns from weekly closing prices reported by the exchanges. The paper’s hypotheses focus on the information content of trade suspensions and whether the information is disseminated by the time suspensions end. Empirical results suggest that the market regulators have monopolistic access to information. Secondly, the
7
persistence of the reaction shows inefficiency in semi-strong form. Lastly, extreme positive abnormal returns in the pre-suspension period support the manipulation allegations. Kryzanowski (1979) examines the same stock exchanges and finds that while these stock markets are inefficient in semi-strong form for unfavorable new information, they are semi-strongly efficient for favorable new information. Author attributes this asymmetry in behavior to the asymmetrical risk and regulations on selling short and buying long. These are the mechanisms by which such information can be reflected in the stock prices following the events.
Howe and Schlarbaum (1986) study the effect of temporary SEC suspensions on stock returns, in the spirit of Kryzanowski (1978). Event study method uses both weekly and daily returns data. They find that suspensions cause significant negative abnormal returns, and the effect is greater for longer suspension periods. This shows violation of semi-strong form market efficiency. Even though the regulatory actions help the dissemination of information and improve trust and provision, market reaction is not fast enough to support these benefits.
Nourayi (1994), a research very similar to this thesis, studies the effect of SEC litigations between 1977 and 1984, using single factor market model to calculate the abnormal performances and Patell (1976) standardization to calculate the test statistics. The author conducts the analysis based on the source of announcement, type of violation, type of enforcement action taken, and the party charged with the action. The ANOVA results suggest that the price reaction is significant but only the source of initial information (whether it was SEC or another party) produces
8
Huskey and Muradoglu (2008) compile an SEC litigations sample for the time period between 1995 and 2004 to test the same hypotheses as Nourayi (1994) using a recent time period as internet might affect the information environment and investors’ access to timely and relevant information. The authors study the impact of litigations on the stock price based on the type of violation; the medium by which they are announced first, i.e., source of initial information (SEC litigations releases, Wall Street Journal, etc.); and the status or stated outcome of the enforcement actions. Huskey and Muradoglu (2008) conduct the analysis using event periods of 2 days (day 0, day 1) and 41 days (from -20 to +20) to account for immediate and drifting responses. They find significant abnormal returns of -0.17% with a test statistic of 2.84% on the event day, the announcements are perceived as bad news. In addition, market punishes insider trading the most severe out of all the SEC violations. The announcements that are only published by SEC also have significantly worse market response than those that are published in multiple outlets, meaning that the market prices towards transparency.
Jaffe (1974) studies the effect of changes in the regulatory environment, more specifically precedent decisions, on the profitability and volume of insider trading. SEC’s authority over insider trading, granted with Securities and Exchange Act of 1934, is exercised first time on November, 1961. The Cady, Roberts decision (1961) punished a brokerage firm for insider trading. SEC indicted Texas Gulf Suphur officials for hiding information related to discovery of new mineral veins on April, 1965. On August, 1966, court upheld majority of claims of the 1965 indictment. The author points these events as major changes in the regulatory climate, and tests whether these changes cause statistically significant changes in the profitability and
9
volume of insider trading, to examine in proxy the effectiveness or insider trading regulation. Jaffe (1974) uses SEC’s Official Summary of Insider Trading releases to list insider trading activity around the precedents and forms monthly portfolios to test the significance of monthly abnormal returns. The author tests for differences in sample means before and after event months using standardized abnormal returns. Jaffe (1974) cannot reject the hypothesis that these precedents have an effect on the characteristics of insider trading.
Persons (1997) examines the effect of SEC’s insider trading enforcements on target firms’ stock values using event study method. The author compiles a sample with period and size of 22 years from 1972 through 1993 and 95 announcements published on SEC litigation releases and Wall Street Journal (WSJ). Persons (1997) first tests for negative abnormal returns reactions to the announcements. The expectation of negative reactions arises from two arguments. First, SEC enforcements are costly for corporations and affect their cash flows. If the
enforcement action provides justification for stockholder lawsuits, the disruption to future earnings and cash flows is bigger. Second, the enforcement can affect the firms’ reputation as insider trading signals agency conflict between managers and investors. A reputation of agency conflict can increase cost of capital and lower stock prices. Using OLS Market Model expected returns, the author finds
standardized abnormal returns (Patell, 1976) of -0.56 on day 0 and -0.25 on day -1 (significant at 1%). SEC enforcements indeed induce a negative shock in the stock value of target firms.
10
Paper also tests for association between market reaction to the insider trading enforcement and six variables: (a) profit relative to firm size (profit/size), (b) size (value), (c) whether a firm is facing ongoing investigations, (d) target of
enforcement (employee or firm itself), source of announcement (SEC litigation releases or WSJ), and whether enforcement action takes place after the passage of Insider Trading Sanctions Act of 1984 (ITSA) or Insider Trading and Securities Fraud Enforcement Act of 1988 (ITSFEA). Results suggest that larger enforcement actions and smaller target firms cause worse reaction. The author attributes the results to the anticipated cash flow disturbances and reputation loss by violations. Negative reactions to enforcement actions after the passage of ITSA and ITSFEA are also significantly higher. These results do not refute those of Jaffe (1974), as Persons (1997) examines changes in reactions only to the enforcement actions against insider trading events where the former studies all reported insider trading events around the time of precedents.
2.2 Manipulation Theory Literature
Examining investors’ reaction to the announcements of stock market litigations requires insight about the effects of manipulative actions in a stock market. Especially since investors’ perception of the announcements will depend on the current understanding of the effect of manipulation in the underlying value of an asset. For example, short-sale restrictions make it harder for manipulators to profit by reducing prices (Aggarwal & Wu, 2006). Thus, an investor may believe that an allegedly manipulated stock have a higher chance of being overvalued. In this section, I present studies that have important impact on how investors perceive the implications of manipulative behavior.
11
Allen and Gale (1992) propose a classification for stock market manipulations based on three categories. First are action-based manipulations. As the actions of
corporations directly affect the value of their assets, executives could profit from this using short-sales. In 1901, American Steel and Wire Company managers shorted their own stocks and closed their steel mills to buy their assets back at a decreased price and realize profits by opening their mills again. Second are information-based manipulations. Before the passage of Securities Exchange Act, “trading pool”s took place in 1920s where some investors would come together and relay false rumors to generate profits. In early 20th century, the Great Crash of 1929 brought a lot of attention to manipulative activities. With the Securities Exchange Act of 1934, it was made illegal for managers to short their own stocks and it became mandatory for companies to issue information to the public regularly. These restrictions and
requirements were set to prevent and illegalize action-based and information-based manipulations. However, Allen and Gale (1992) propose a third category: trade-based manipulation.
Trade-based manipulation occurs when an uninformed investor realizes profits by simply buying and selling. Authors propose a model to show the theoretical possibility of profitable trade-based manipulation. They propose a simple setting where there are large traders and risk-averse small traders. When a large trader buys, there is a possibility that the trader is informed and is buying on information that the asset is undervalued. Even though the arrival of an informed trader signals expected good news, it is possible that the anticipated event may never occur or the trader might be a manipulator. Risk-averseness plays a key role in the model as some investors sell at inflated prices in every stage of manipulation based on these
12
possibilities. This limits the price increase. Through this model, Allen and Gale (1992) show that if investors price the probability that a large trader is informed, an uninformed manipulator can pose as an informed trader to realize gains. Without the information asymmetry or possibility of informed trader presence, the model does not hold.
Kyle (1985) builds a dynamic model of insider trading with sequential auctions to examine how quickly private information is incorporated into prices. The model consists of three players: an insider with access to private information, a noise trader, and a market-maker who sets prices semi-efficienctly. Investors trade a risky and a riskless asset. In this setting, market makers only have information about total quantity of orders. This enables insider to partially hide some of the information revealed by the trade with the noise and profit. Kyle (1985) finds that a unique linear equilibrium exists where insider trades in the direction of the private information, i.e., does not create noise. The trading strategy of the insider trader depends on liquidity characteristics of the market. The liquidity characteristics in question are tightness (cost of changing positions), depth (change in order flow needed to change prices), and resiliency (how quickly prices recover from noise shocks). A liquid market is infinitely tight, is not infinitely deep, and resilient so that prices converge to underlying value. In the linear equilibrium, the insider has to incorporate these liquidity characteristics into his strategy to realize profit.
Accounting for these characteristics, informed trader limits his trades per period so that the information is released gradually. Information is completely incorporated with the end of the trading strategy.
13
Kumar and Seppi (1992) investigates the possibility of uninformed manipulation in the futures market. Authors build a two-period model with asymmetric information, a modification of Kyle (1985) model. The model features a riskless bond with no interest, a stock and a futures contract of that stock. The first period marks the futures market and the second period the spot market. The markets consist of a strategic informed trader, noise traders, specialists, and an uninformed
manipulator. In this framework, Kumar and Seppi (1992) demonstrates that an uninformed manipulator can profit by trading on both futures and spot markets knowing that informed trades take place in the spot market: the futures market described in the model is susceptible to manipulation given asymmetric
information. The potential profits decrease with the arrival of new manipulators. However, welfare implications persist.
Benabou and Laroque (1992) examine information-based manipulation in a reputational framework. Authors form a model where there is no cost of relaying information, trades are undetected, and the process by which prices update is independent of underlying asset value. In this setting, players who are deemed to have private information such as corporate executives, journalists, and “gurus” people follow based on reputation can profit from relaying false information. The ability of these information agents to realize profits is limited only by their
reputation in the long-run as their credibility is reevaluated by the investors
continuously. However, in a case where a relayed information or forecast turns out to be false, it is not possible to fully differentiate between an honest mistake and a manipulative behavior as private information holds some risk. In an environment where truthfulness is not fully transparent, Benabou and Laroque (1992) show that
14
insiders can profit by relaying false information by capitalizing on this imperfection. Furthermore, when these agents collaborate, they impede the learning mechanism by which reputation is assessed.
Jarrow (1992) examines bubbles, corners, and squeezes where large traders, whose position is large enough to affect prices, are the manipulators. The author
constructs a model with two assets (a stock and a riskless asset), and two types of traders: large trader and atomistic traders who react to the changes induced by the large traders. The analysis revolves around the possibility of “market manipulation trading strategy”, a strategy that yields positive gains with zero initial investment and with zero risk, under 4 assumptions. First, market is assumed to be frictionless. Second, large traders are not price takers, prices occur as a function of large
trader’s trades. Third, prices increase with rises in the large traders’ demands. The large trader is a speculator. Lastly, no arbitrage opportunities exist. In this
framework, in contrast to the preceding papers, Jarrow (1992) investigate
conditions to establish a market structure where manipulation does not exist. Paper shows that if price function is time symmetric in terms of sensitivity to the large trader’s trades. The author excludes squeezes and corners from this framework however, because “market manipulation trading strategies” always exist for these tactics regardless of the propositions and assumptions about market
micromechanisms.
Huddart, Hughes, and Levine (2001), investigate how ex-post public disclosure of insider trades affect the equilibrium strategy of an insider in their rational
N-15
period Kyle (1985) model to incorporate public reporting of insider trades. The first major finding of the study is that producing noise activity clouds the market maker’s judgement on the information content of the trades, this mechanic is called
dissimulation. Dissumilation is an optimal behavior for insider traders. Second, compared to Kyle (1985), addition of disclosure requirement causes trading costs to decrease, accelerates the price discovery process, and diminishes insider profits. These findings justify the regulatory actions against manipulative activities. However, as the profits are halved in the N-period model, it is still optimal for insiders to trade on private information.
Aggarwal and Wu (2006) is one of the first papers to test stock market manipulation models with a large sample. Authors state a model with three types of investors: an insider which can be both truthful or manipulator based on the private information; information seekers or arbitrageurs; and uninformed traders. An insider is truthful is private information signals higher future values as it is clearly profitable to trade in the direction of the information, or an insider can choose to manipulate in the opposite case. Aggarwal and Wu (2006) examine the two opposing cases and deduce how each type of player affect price discovery, volume, volatility, and efficiency. Information seekers drive the market to efficiency when there is no manipulator. However, when there is a possibility that a manipulator exists, the effect is reversed and increasing number of information seekers hurt efficiency. Probability of a manipulator being present in the market also increases with the number of arbitrageurs. Based on this model, authors draw three predictions. First, prices increase during the manipulation period and decrease after private
16
information seekers. Third, manipulator realizes greater returns when price variation, i.e., disagreement about prices is greater.
To test these predictions, Aggarwal and Wu (2006) compile a unique sample of 142 manipulation cases from SEC litigation releases that cover the period from January, 1990 through December, 2001. The sample reveals that in 85% of the recorded cases, manipulators try to inflate the prices. Manipulators are generally informed parties and inefficient markets have a higher chance of undergoing manipulation. Attempts to decrease stock prices only account for 1% of the cases. Using daily price, volume, and capitalization data obtained for 51 of the cases, Authors test their predictions and confirm them. First, manipulation increases variation, liquidity, and returns. Prices rise during manipulation and fall when manipulator leaves. Second, greater disagreement regarding the true value of the stocks increases the manipulator returns. Third, higher liquidity and variation information seekers and noise traders bring increase manipulator’s profits. It becomes evident that the contribution of information seekers to market efficiency is reversed in the presence of manipulators. This finding suggests the necessity of regulation for efficient markets.
In an empirical study that yields consistent results with Aggarwal and Wu (2006), Imisiker and Tas (2013) examine what firm and stock-specific characteristics have an effect on the probability of manipulation of a stock in the Istanbul Stock Exchange (ISE). The authors compile a unique manipulations sample much similar to that of this thesis, based on manipulation cases detected by Capital Markets Board of Turkey during the period 1998-2006. The sample consists of 306 cases of
17
manipulation. To determine what characteristics affect the probability of manipulation, Imisiker and Tas (2013) use free float ratio, market capitalization, return on equity ratio, leverage, current ratio, and a dummy to account for whether a stock has been subject to manipulation before in their empirical analysis. With this dummy variable as the dependent variable, random effects probit regressions and dynamic probit regressions yield similar results to Aggarwal and Wu (2006). Random effects probit regression shows that free float ratio and market
capitalization are inversely related with the probability of undergoing manipulation, while leverage ratio increases the exposure. Based on the results of the dynamic panel, authors suggest that a stock that has been manipulated before is more likely to be manipulated. Finally, Imisiker and Tas (2013) propose a monitoring scheme where stocks are grouped by their probability of exposure to manipulation, in order to put the scarce resources of regulators into better use.
2.3 Parametric Event Study Literature
Fama, Fisher, Jensen, & Roll (1969), in their pioneer paper of event study method, analyzes markets reaction to announcements of stock splits. To look for market efficiency in a long horizon, Fama et al. (1969) propose a new method to study the effect that let them generalize the information impact of stock splits, instead of individual analysis. Authors take the effective stock split dates to be the event date and test the significance of monthly abnormal returns surrounding the event month.
Brown and Warner (1980), tests the power (probability of rejecting the null hypothesis when it is false, when abnormal performance is present in this case) of
18
widely-used performance measures (abnormal return measures) and parametric and non-parametric hypothesis tests using simulation. The authors determine an event period surrounding the event date and an estimation period prior to the event date. Abnormal returns can be calculated by benchmarking against the expected return models: 1) Mean Adjusted abnormal returns, 2)Market Adjusted abnormal returns, and 3) Ordinary Least Squares (OLS) abnormal returns. Expected returns are formed, respectively, using security estimation period mean returns, market index event period returns, and OLS coefficients that regressing security estimation period returns over market index estimation period returns yield.
This method allows for the systematic testing of event study methods in the literature. The authors introduce different levels of abnormal returns and calculate the probability of Type I and Type II Errors using a large number of randomly generated samples. Paper also tests how potential statistical problems that arise from the differences in sample properties and the methodologies affect the power of test statistics. Overall, there is no benefit to using any specific method and even the simplest measures, e.g. mean adjusted returns, which do not account for risk parameters, yield similar results. Thus, even though the OLS model and parametric tests are well-defined under some assumptions, the performance measure
technique should be chosen according to the specific study and the more complex methods can even hurt the power of the tests.
Brown and Warner (1985) builds upon the earlier work by extending the method for the use of daily returns. Using daily returns as opposed to monthly returns is
19
returns. Second, daily returns pose a potential autocorrelation problem and the variances are likely to increase during event periods which may cause
misspecification. Lastly, tests using daily returns are more prone to the effect of non-synchronous trading on the parameter estimates. Brown and Warner (1985) tests the power of the event study method using simulations similar to Brown and Warner (1980). The authors report that even though OLS estimates are often biased and misspecified due to the difficulties with daily returns, there is no clear-cut benefit to using any other method.
Patell (1976) analyzes information content of corporate earnings forecast announcements (voluntary disclosures) using event study method and the OLS market model (Sharpe, 1964) as the expected returns model to rule out market-wide effects. Patell (1976) introduces a standardization method and test where a variance correction takes place due to forecast errors (abnormal returns) being used to estimate out of sample returns. Patell t-statistic sums the standardized abnormal returns and standardized cumulative abnormal returns cross-sectionally which are then divided by individual variance estimates that solely depend on the observations counts.
Event induced volatility causes severe increases in Type I Error probability for the most common tests, meaning it forces rejection too often when the null hypothesis is true. Both Brown and Warner test and Patell test assume the event induced volatility to be insignificant. An option is to use cross-sectional variance that is constant across sample for a given period. Boehmer, Musumeci, & Poulsen (1990) builds upon Patell’s (1976) standardization methodology by using a variance of
20
standardized abnormal return values to account for event induced volatility, which they call “Standardized Cross-Sectional Test”. By doing this, they show that their new statistics yield proper rejection rates. Kolari and Pynnonen (2010) make a further adjustment, where a correlation-correction term is incorporated into the test statistics to negate the effects (overrejection of correct null) of cross-sectional correlation on event studies, which is especially severe for samples with clustered event dates. I expect some of my subsamples, especially the indictments
subsample, to be prone to this effect because Capital Markets Board (CMB) of Turkey announces these in bulks.
Basdas and Oran (2014) conduct a review of event studies in Turkey. The paper first introduces event study method and the different specifications and models adopted thus far in the literature. Subsequently, authors review Turkish event studies under 11 categories: 1) Gossips and security recommendations; 2) IPOs, stock splits, rights issues, and cross listing; 3) mergers and acquisitions; 4) dividend announcements; 5) audit reports and ratings; 6) insider trading; 7) financial statements; 8) investment strategies, index revisions, and other corporate announcements; 9) macroeconomic announcements; 10) political events; and 11) other events like anticipated football games or natural disasters. Lastly, the paper discusses the method and design of Turkish event studies. Authors do not record any examination of the effects of litigation announcements in the Turkish stock market.
21
CHAPTER 3
SAMPLING STRATEGY AND METHOD
3.1 Sampling Strategy3.1.1 The Sample of Turkish Stock Market Litigation Announcements
I compile a unique dataset of stock manipulation-related announcements using CMB publications between January 2012 and January 2019. The CMB of Turkey publishes these announcements in two categories grouped by the enforcement action taken, which depends on the Capital Market Law article that is violated. First are the administrative fees. Administrative fees are charged against “Market abuse actions”. These actions are defined as actions and transactions that hold no
economical or financial meaning, are hurtful for the functioning of exhanges and organized markets in terms of stability, security, and openness, and are not deemed criminal by law. Administrative fees range from twenty thousand Turkish Liras up to five hundred thousand Turkish Liras depending on the action, and are bound to be at least twice the monetary benefit of the abuser if there are any (Turkish Capital Market Law, Article 104). Turkish CMB also reports the delayed or non-performed but required information release events from corporations, unless they constitute crime, since they are possible cases of and openings for information-based
manipulation and insider trading, violating information equity. These cases are charged with administrative fees unless they constitute a crime, and are included in the administrative fees sample for violating information equity. Second are
22
to have participated in insider trading or manipulation of stocks. Indictments are announced against actions listed by Article 106 and 107 of Turkish Capital Market Law, defining “insider trading” and “manipulation”, respectively. Insider trading is defined as giving, changing, or cancelling purchase or sale orders of stocks for monetary gains based on information that is not declared to public. Those who commit these actions are sentenced to prison from 2 years up to 5 years, or
punished by a judicial fee (Capital Market Law, Article 106). Manipulation is defined as market activity that have the purpose of creating wrong information or
deception regarding the prices of capital market instruments, their returns, or their supplies and demands. Manipulation punishment is imprisonment from 2 years up to 5 years with judicial fines from five thousand days up to ten thousand days, while the amount of fines are to be imposed so that it exceeds the benefit obtained from the crime (Capital Market Law, Article 107). I also collect the announcement dates (publishing dates of the journals), manipulated/abused stock, the subject of the enforcement action (individuals, legal entities, or markets for precaution
announcements), enforcement action taken (as described above), the specific action that is punished and the corresponding Capital Markets Law article it violates.
To compile the unique litigations announcements sample from the CMB journals, I choose enforcement announcement events that are related to the violation of three specific articles described above: Article 104 – Market abuse actions, Article 106 – Insider trading, and Article 107 – Manipulation. These articles aim to protect information equity and market eficiency.
23
Other capital market crimes defined by the law are listed as follows: Improper public offer and unauthorised capital market activity (Article 109), abuse of confidence and forgery (Article 110), witholding information and document, preventing the auditing (Article 111), irregularities in legal books, accounting records and financial statements and reports (Article 112). When activity related to the definitions provided by these articles do not constitute crime (no support for or evidence of ill intent or benefit-seeking), they are charged with administrative fees under “market abusing actions” and are included in the announcements sample as discussed above, except for cases related to improper public offer and unauthorised capital market activity.
The sample consists of 202 unique events ranging from January 20, 2012 to January 3, 2019. I choose the starting point to be 2012 because of three reasons: 1) The journal undergoes a change in reporting format of the announcements which makes it harder to store consistent information, 2) Turkish Capital Market Law changed in 2012, 3) I want to conduct my analysis for the recent financial climate of Turkey.
3.1.2 Sample Summary
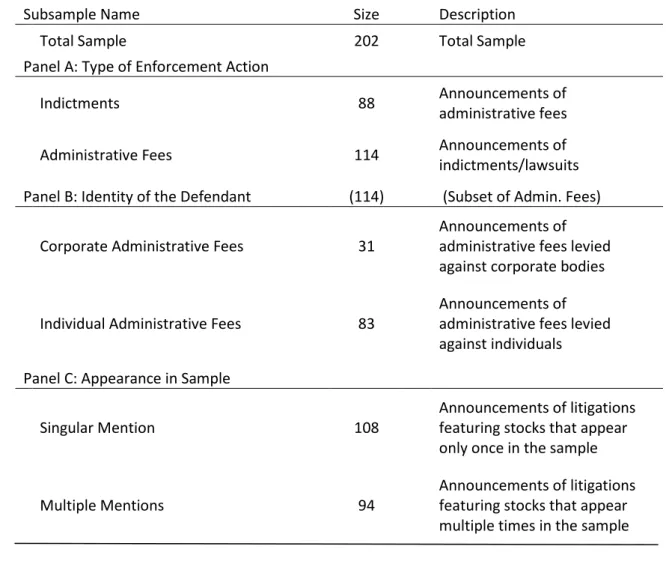
Manipulation announcements sample covers 202 litigation events on 145 unique stocks, I omit 25 events because their event period price data were missing, and I omit 2 events on a particular stock because of the overlapping event periods. Of these 202 events, 114 are of administrative fees announcements, and 88 are of indictment announcements.
I divide the sample with respect to the party charged: corporations or individuals. However, these two subsamples are subsamples of Administrative Fees subsample.
24
Indictments are done solely against individuals by nature and I expect them to have a different market reaction than administrative fees. Thus, for testing whether the market reaction to announcements aimed at corporations and individuals are different, I have to exclude them from my corresponding subsamples. Corporations subsample cover 31 announcements of corporate punishments by CMB. 83 events are the announcements of penal action against individuals I cover in the individuals subsample. Cases where there were penal action against both corporations and individuals are included only in the corporations subsample (11 events).
Finally, I divide the sample for events of the stocks that have been subject to the announcements multiple times (94 events, 37 stocks), and only a single time (108) in the period my dataset spans. These subsamples let me have a better
understanding of my total sample and the results that stem from it, as well as enabling me to conduct difference in means analyses for testing my hypotheses. Subsample descriptions and cross-distributions are shown in Table 1 and Table 2.
25 Table 1: Subsample Descriptions
Subsample Name Size Description
Total Sample 202 Total Sample
Panel A: Type of Enforcement Action
Indictments 88 Announcements of
administrative fees
Administrative Fees 114 Announcements of
indictments/lawsuits Panel B: Identity of the Defendant (114) (Subset of Admin. Fees)
Corporate Administrative Fees 31
Announcements of administrative fees levied against corporate bodies
Individual Administrative Fees 83
Announcements of administrative fees levied against individuals
Panel C: Appearance in Sample
Singular Mention 108
Announcements of litigations featuring stocks that appear only once in the sample
Multiple Mentions 94
Announcements of litigations featuring stocks that appear multiple times in the sample
Table 2: Cross-distribution of Subsample Observations
Cross-Distribution of Subsamples Sample Total (0) Administrative Fees Indictments Singular Mention Multiple Mentions Total 202 114 88 108 94
Individual Adm. Fees 83 83 0 47 36
Corporation Adm. Fees 31 31 0 20 11
Indivs. + Corps. 11 11 0 8 3
Singular Mention 108 67 41 108 0
26 3.1.3 Returns Data
I calculate the returns for both XU100 index and the stocks in my sample using last price data I obtain from Bloomberg Database. Last price is the last on-market price reported by the exchange.
3.2 Method
3.2.1 Event Study
I use event study method with daily returns, as described in Brown and Warner (1985). For each event, event day, day 0, is the date the announcement is
published. I use an event period of 11 days, spanning from 5 days before the event to 5 days after the event. The estimation period for each event starts from day -244 and ends at day -6. From the estimation period, I derive a mean expected return 𝐸[𝑅𝑖] by calculating the arithmetic average of returns for each event as shown in Equation (2) to be used in the calculation of the mean adjusted abnormal returns.
3.2.2 Abnormal Returns
I calculate the the abnormal return for a given day and stock by substracting the expected return for that day and stock from the observed return. The cumulative abnormal returns are equal to the sum of abnormal returns for a period.
𝐴𝑅𝑖,𝑡 = 𝑅𝑖,𝑡− 𝐸[𝑅𝑖,𝑡], 𝐶𝐴𝑅𝑖,𝑡 = ∑ 𝐴𝑅𝑇𝑇43 𝑖,𝑡 (1)
where 𝐴𝑅𝑖,𝑡 shows abnormal returns of day t for the stock mentioned in the ith event. 𝑅𝑖,𝑡 is the corresponding observed return and 𝐸[𝑅𝑖,𝑡]the expected return of the stock. 𝐶𝐴𝑅𝑖,𝑡 is the cumulative abnormal return value for the period [T3, T4].
27
Mean Adjusted Abnormal Returns: The average return value is calculated from the
estimation period returns to be used as the expected return for the event period for each event (Equation (2)). Mean Adjusted Returns Model is consistent with Capital Asset Pricing Model (CAPM) assuming that the securities have constant systematic risk over the horizon of the estimation and event periods (Brown & Warner, 1980).
𝐸[𝑅𝑖,𝑡] = 𝑅𝑖 = ∑−6𝑡=−244𝑅𝑖,𝑡 (2)
Market Adjusted Abnormal Returns: For each event day, assuming XU100/BIST100
index is representative of the capital market, market index return for that day is used as the expected return. This method accounts for the market-wide events or movements that coincide with the time of the event. In this model, the expected returns are not constant over the event period but constant cross-sectionally.
𝐸[𝑅𝑖,𝑡] = 𝑅𝑚,𝑡 (3)
Ordinary Least Squares (OLS) Market Model: Expected returns for each day are
constructed using Capital Asset Pricing Model (CAPM). I use two-parameter model used in Black (1972). Alpha and beta parameters are calculated using Eviews 7 for each stock for the given period of time by regressing the daily returns over the market returns for the estimation periods, I calculate 𝛼̂𝑖 and 𝛽̂𝑖 coefficients which I then use to calculate event period expected returns as shown in Equation (4).
𝐸[𝑅𝑖,𝑡] = 𝛼̂𝑖 + 𝛽̂𝑖 ∗ 𝑅𝑚,𝑡+ 𝜀𝑖,𝑡, , 𝐸[𝜀𝑖,𝑡] = 0 , 𝑉𝑎𝑟(𝜀𝑖,𝑡) = 𝜎𝜀𝑖
2 (4),
where 𝛽̂𝑖 is price sensitivity of stock mentioned in ith event to the market index, 𝑅𝑚,𝑡 is the market index’s return for day t, and 𝜀𝑖,𝑡 is the ordinary least squares residual value.
28 3.2.3 Tests
Brown and Warner (1985) tests the power and sensitivity of different test statistics and ways of abnormal return calculations against each other through simulation for daily returns, taking into account the sample sizes, event period durations, non-synchronous trading, and clustering. They also show that the power of tests differ little whether mean adjusted, market adjusted, or market model abnormal returns are used except for one case: Using mean adjusted abnormal returns suffer a significant increase in the Type I error chance when a multi-day interval is used. So I expect my results to be consistent among different calculations of abnormal
returns.
A potential serious problem comes from non-synchronous trading while using OLS expected returns in the abnormal return calculations. Securities with different trading frequencies yield biased β parameters as the price movements are either undermined or amplified relative to the market portfolio. However, Brown and Warner (1985) shows that using OLS procedure in calculating β parameters do not cause increases in Type I and Type II errors. Clustering is not an issue with the sample as the instances where event periods of different events collide are not numerous, and not wide cross-sectionally. I do not expect industry correlations to be effective in this sample either because of the same reason, no clustering. Thus, I assume cross-sectional independence.
3.2.3.1 Cross-Sectional Test
I use cross-sectional two-tailed t test to test my hypotheses. I assume day 0 abnormal returns are independent and identically distributed (i.i.d.). The main
29
motivation behind using this test is the fact that it accounts for event-induced variance as each day’s variances are accounted for seperately and are estimated from event period returns. This is important for my sample as it consists of events related to various Turkish stocks that are quite different in trading frequencies (non-synchronous) throughout the sample. Thus, for some of these stocks, the litigation announcements may be the most influential event on their activity and price volatility. This means these securities’ price and return variances may drastically increase during the event. This means using estimation period standard deviations would not be able to account for the variation increase, undermining its effect. This amplifies the test-statistics and thus reject my null hypotheses more often than expected if I calculated standard deviations from the estimation periods. However, calculating across-sample deviations for each event day denies this downside.
Non-synchronous trading also poses another threat, autocorrelation in the estimation period returns series. This then causes the variances to be
underestimated and the hypotheses to be overrejected as well, as in the event-induced volatility case. Cross-sectional variance estimation under the given assumptions gets rid of this hurdle.
Cross-sectional test suffers greatly from cross-sectional dependence which does not pose a problem for the litigations sample since the event periods do not coincide.
I construct abnormal returns of 3 types (Mean Adjusted, Market Adjusted, and OLS Abnormal Returns) as vectors of 11 values (event period returns ranging from 5 days before the event to 5 days after the event) for 202 events. I also construct cumulative abnormal returns of 3 types based on different abnormal returns
30
calculations, as vectors of 9 values (varying pre- and post-announcement
cumulative abnormal returns). I use these returns then to calculate (Equations 5-7) cross-sectional abnormal returns (ARs) and cumulative abnormal returns (CARs) for each event day and each designated event window by simply calculating their cross-sectional arithmetic average, while using announcement dates as origin points to standardize the data.
𝐴𝑅𝑡= 1 𝑁∑ 𝐴𝑅𝑖,𝑡 𝑁 𝑖=1 (5) 𝐶𝐴𝑅𝑇 = 1 𝑁∑ 𝐶𝐴𝑅𝑖,𝑇 𝑁 𝑖=1 (6)
Using these values, I calculate my test statistics shown below (Equations 8 & 9). I calculate these values for total sample and each subsample. I use two-tailed t-test at five percent significance level to test my hypotheses. The equations for the test statistics are given below, where 𝑠𝐴𝑅𝑡 is the standard deviation of abnormal returns across firms for time t and 𝑠𝐶𝐴𝑅𝑇 is the standard deviation of cumulative abnormal returns across firms for the time window T. I use the t-statistics presented below for hypothesis testing of the format "𝐻0: 𝐴𝑅𝑡 = 0".
𝑡𝐴𝑅𝑡 = √𝑁 𝐴𝑅𝑡 𝑠(𝐴𝑅𝑡) , 𝑠𝐴𝑅𝑡 = √ 1 𝑁−1∑ (𝐴𝑅𝑖,𝑡 − 𝑁 𝑖=1 𝐴𝑅𝑡)2 (7) 𝑡𝐶𝐴𝑅𝑡 = √𝑁 𝐶𝐴𝑅𝑡 𝑠(𝐶𝐴𝑅𝑇) , 𝑠𝐶𝐴𝑅𝑇 = √ 1 𝑁−1∑ (𝐶𝐴𝑅𝑖,𝑇 − 𝑁 𝑖=1 𝐶𝐴𝑅𝑇)2 (8) 3.2.3.2 Difference in Means
For the hypothesis tests in the form of unpaired difference in means, I use the following criteria to calculate the t-statistics:
31 𝑡𝐴−𝐵 = 𝐴𝑅𝐴−𝐴𝑅𝐵 𝑠(𝐴𝑅𝐴−𝐴𝑅𝐵) , 𝑠(𝐴𝑅𝐴 − 𝐴𝑅𝐵) = √ 𝑠2(𝐴𝑅 𝐴) 𝑁𝐴 + 𝑠2(𝐴𝑅 𝐵) 𝑁𝐵 (9) 𝐷𝑜𝐹 = ( 𝑠2(𝐴𝑅𝐴) 𝑁𝐴 + 𝑠2(𝐴𝑅𝐵) 𝑁𝐵 ) 2 1 𝑁𝐴−1( 𝑠2(𝐴𝑅𝐴) 𝑁𝐴 ) 2 + 1 𝑁𝐵−1(𝑠2(𝐴𝑅𝐵)𝑁𝐵 ) 2 , (10)
where A and B are denote subsamples, 𝑁𝐴 and 𝑁𝐵 denote subsample sizes, and DoF is the Satterthwaite’s unpaired degrees of freedom I calculate for the test.
Testing my hypotheses using three different expected returns models for calculating abnormal returns for each event (mean adjusted, market adjusted, and OLS
32
CHAPTER 4
TESTABLE HYPOTHESES
To determine the investor reactions to the litigation announcements of the Capital Markets Board of Turkey, I test the hypotheses I present below for each of the mean adjusted, market adjusted, and OLS abnormal returns values. In addition to testing for the event day returns, I perform these tests for the whole of the event window, as well as pre-announcement ([-5, 1]), post-announcement ([1, +5]) and other partial time windows by calculating the cumulative abnormal returns (CARs).
4.1 Main Hypothesis: Investors do not react to CMB announcements. Investors perceive the litigation announcements to be arbitrary.
𝐻0: 𝐴𝑅𝑡= 0, t = (-5, -4, … , 4, 5)
where 𝐴𝑅𝑡 is the cross-sectionel abnormal return throughout the sample for day t. All hypotheses are tested for all days in the event period, and for all
subsamples.
If the null hypothesis is true, either the information content of the announcement is already priced, or investors perceive the litigation announcements to be arbitrary in the pricing of the stocks. However, I presume market lacks the information to price them because full information regarding the transactions is not available publicly, regulators use sophisticated technology and methods, and regulation incurs costs for detection.
33
I expect the reaction to the announcements to be reflected as significant negative abnormal returns over the event period. Since the announced information is not available market-wide, receiving litigation news regarding a stock would suggest that the price of the stock is different than the implied value (Kryzanowski, 1978; Persons, 1997). Furthermore, short-sale restrictions and information dissimulation makes it less probably that a manipulator will strategize to decrease the prices (Huddart, Hughes, & Levine, 2001; Aggarwal & Wu, 2006).
𝐻𝐴: 𝐴𝑅𝑡 ≤ 0, t = (-5, -4, … , 4, 5)
4.2 Hypothesis 2: News of litigations are not anticipated by the investors.
𝐻0: 𝐶𝐴𝑅[−𝐴,−1] = 0 , A = (-5, -4, -3, -2)
I expect this hypothesis to hold as these announcement events are the first public disclosure of the information in question. Release of any information prior to the announcement dates are protected by Capital Market Law, Article 113; and is punishable by sentence in prison. If there is significant returns response prior to the event, either there is information leakage or my model is not robust.
4.3 Hypothesis 3: News of litigations are fully incorporated into prices immediately.
𝐻0: 𝐶𝐴𝑅[+1,+𝐵] = 0 , B = (2, 3, 4, 5)
Early empirical work show that the response to litigations announcements from regulatory bodies significantly violate semi-strong form efficiency (Kryzanowski 1978; Kryzanowski, 1979; Howe & Schlarbaum, 1986), meaning that prices do not
34
adjust to new information quickly. Even though these studies analyze exchanges of financially developed countries (U.S. and Canada exchanges), my sample might report quicker dissemination of information because of the technological gap between today and the late 80s. Means to reach financial information immediately is widely available and the technological advances enable us to communicate information almost immediately. Also, as a result of these advancements, financial awareness increased. In any case, the duration of the abnormal returns are an important aspect of investor reaction to the announcements. To study this aspect, I test Hypotheses 4, 5, and 6, explained below.
4.4 Hypothesis 4: Investors’ reaction to the announcements are the same whether an individual or a firm is accused.
𝐻0: 𝐴𝑅𝑡,𝑐𝑜𝑟𝑝= 𝐴𝑅𝑡,𝑖𝑛𝑑𝑣, t = (-5, -4, … , 4, 5),
where 𝐴𝑅𝑡,𝑐𝑜𝑟𝑝 is the day t abnormal return for the corporations subsample and 𝐴𝑅𝑡,𝑖𝑛𝑑𝑣 is the day t abnormal return for the individuals subsample. These subsamples only cover administrative fees. I exclude announcements of indictments (lawsuits) because they are done only against individuals which would introduce a bias in this test.
Nourayi (1994), in his SEC enforcement actions sample, finds that the reaction against the litigations of corporations are significant but those against the litigations of corporate insiders (corresponds to my Individuals subsample which consists solely of administrative fees) is not significant. Author attributes this to the
possibility that the individuals involved might have resigned or dismissed before the litigation release became public. This is also possible for my sample. Either way, I
35
expect a different reaction against fees charged for corporations and individuals because I expect the market to perceive the news of the litigations against violations in the name of legal entities more severe.
4.5 Hypothesis 5: Investors’ reaction to announcements of administrative fees and indictments do not differ.
𝐻0: 𝐴𝑅𝑡,𝑎𝑑𝑚= 𝐴𝑅𝑡,𝑖𝑛𝑑𝑖𝑐𝑡 , t = (-5, -4, … , 4, 5),
where 𝐴𝑅𝑡,𝑎𝑑𝑚 is the day t abnormal return for the administrative fees subsample and 𝐴𝑅𝑡,𝑖𝑛𝑑𝑖𝑐𝑡 is the day t abnormal return for the indictments subsample.
I expect indictment announcements to create larger negative abnormal returns responses than administrative fees. As these punishments are exercised for more severe violations (manipulation and insider trading for indictments versus market abusing actions for administrative fees), the market should also price them
accordingly. As the short-sale restrictions make it harder to profit from downward manipulation (Aggarwal & Wu, 2006), the stock in question is more probably to be perceived as overpriced by the investors after indictments are declared. Whereas administrative fees do not imply direct misconduct.
4.6 Hypothesis 6: Investors’ reaction to the announcements about stocks that are subject to multiple mentions in these announcements and stocks of singular mention do not differ.
36
𝐻0: 𝐴𝑅𝑡,𝑠= 𝐴𝑅𝑡,𝑚 , t = (-5, -4, … , 4, 5),
where 𝐴𝑅𝑡,𝑚 is the abnormal return on day t for multiple mentions subsample and 𝐴𝑅𝑡,𝑠 the single mention subsample parameter on the same day.
Since the announcements sample span between 2012 and early 2019, distinction of multiple mentions versus single mention in this sample is only representative. However, 7 years-long announcements record should still be a good representation of a stock’s tendency or probability of being pronounced in a litigation
announcement. Forming expected results for this hypothesis is hard direction-wise because I can refer to two opposite effects. First, stocks that undergo multiple manipulation announcements should evoke a smaller reaction in returns because their information risk should be better priced, or rather, have a higher probability of being incorporated in the prices. Thus, market would be less surprised of such events. Alternatively, investors might look out for the events of stocks that undergo multiple announcements. Even though individual investors don’t exercise conscious caution towards these stocks, a higher tendency or probability of a stock being called out in an allegation can be priced. This would then evoke a more efficient response in the market, i.e. quicker incorporation of the information released with the event, and thus denser informational difference and abnormal returns
measures leading to higher test statistics. In both cases, I expect statistical significance of the alternate hypothesis.
37
CHAPTER 5
EMPIRICAL RESULTS
In this chapter, I discuss my findings and their implications. First, I analyze the full sample daily abnormal returns for my whole event period [-5, 5] and cumulative abnormal returns for varying event windows corresponding to the time before, after, and around the event day. Second, I repeat the analysis for my subsamples. I form my subsamples based on parties charged with administrative fees
(corporations or individuals), type of enforcement action (indictment or administrative fees), and whether the stocks mentioned in the litigation
announcements appear once or multiple times in my total sample. This analysis covers Hypotheses 1 to 3. Third, I conduct difference in means tests to test Hypotheses 4 to 6. The difference in means tests tell me whether the investors react to the announcements differently based on parties charged, type of
enforcement action, and number of mentiones in the sample. Finally, I discuss the implications of my results.
5.1 The Tests of Hypotheses
5.1.1 Main Hypothesis
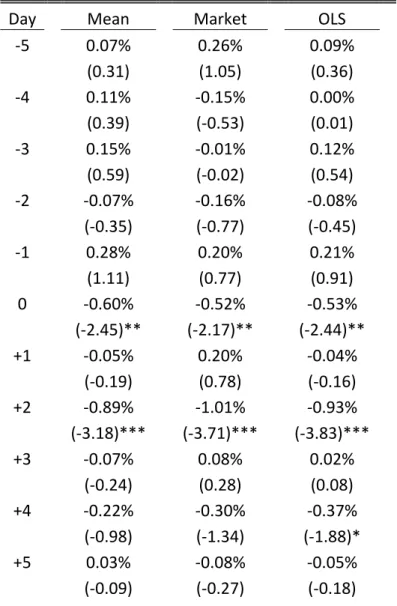
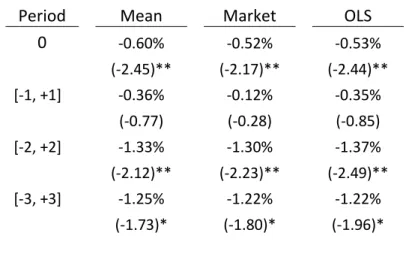
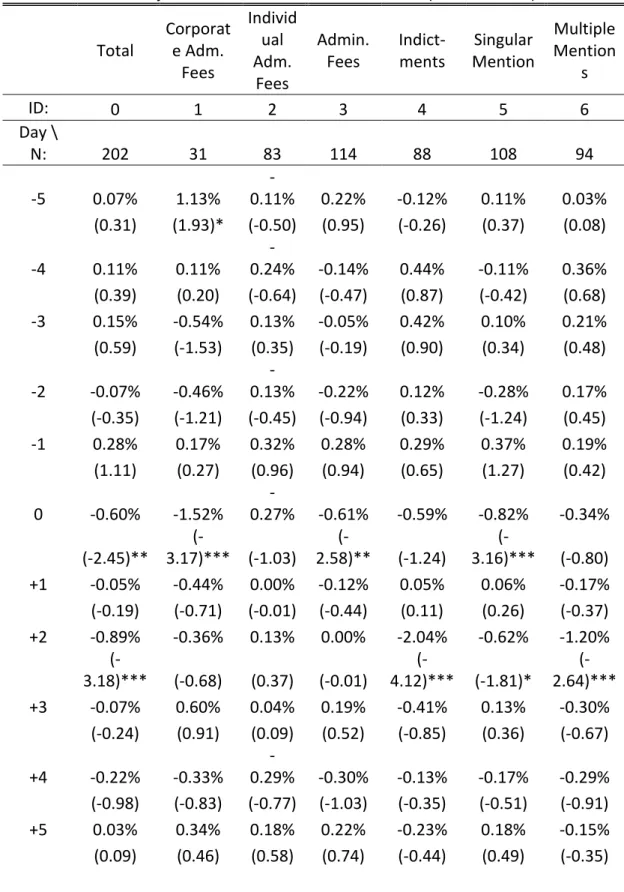
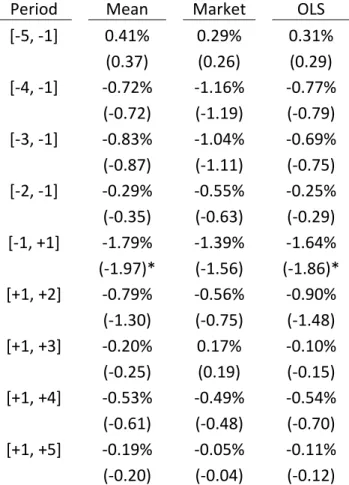
For the total sample, I find statistically significant abnormal returns on two instances: The event day (day 0), and day 2. Event day mean adjusted abnormal return is -0.6% (significant at 5%). The market adjusted and OLS abnormal returns are consistently negative and significant: -0.52% (5% significance), -0.53% (5% significance). The day 2 mean adjusted abnormal return is -0.89% (significant at 1%
38
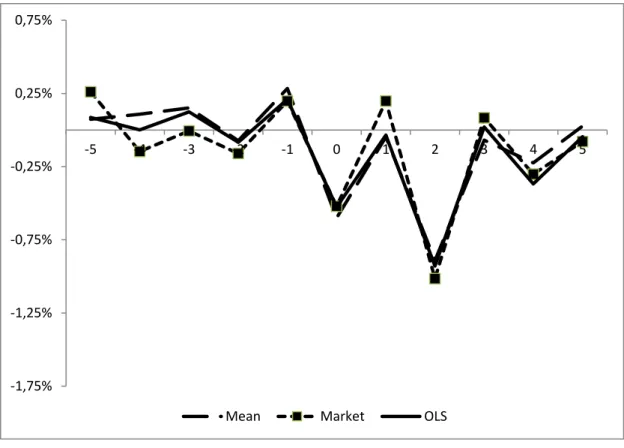
). Significant on the same level, market adjusted and OLS abnormal returns are -1.01% and -0.93% respectively. Abnormal returns for total sample I find using three benchmark models are given on Table 3. I plot abnormal returns (AR) and
cumulative abnormal returns (CAR) in Figures 1 and 2.
Table 3: Total Sample Abnormal Returns and Test Statistics Total Sample Abnormal Returns and (Test Statistics)
Day Mean Market OLS
-5 0.07% 0.26% 0.09% (0.31) (1.05) (0.36) -4 0.11% -0.15% 0.00% (0.39) (-0.53) (0.01) -3 0.15% -0.01% 0.12% (0.59) (-0.02) (0.54) -2 -0.07% -0.16% -0.08% (-0.35) (-0.77) (-0.45) -1 0.28% 0.20% 0.21% (1.11) (0.77) (0.91) 0 -0.60% -0.52% -0.53% (-2.45)** (-2.17)** (-2.44)** +1 -0.05% 0.20% -0.04% (-0.19) (0.78) (-0.16) +2 -0.89% -1.01% -0.93% (-3.18)*** (-3.71)*** (-3.83)*** +3 -0.07% 0.08% 0.02% (-0.24) (0.28) (0.08) +4 -0.22% -0.30% -0.37% (-0.98) (-1.34) (-1.88)* +5 0.03% -0.08% -0.05% (-0.09) (-0.27) (-0.18) *: 10%, **: 5%, ***: 1% Significance Level
39 Figure 1: Total Sample Abnormal Returns plot
Figure 2: Total Sample Cumulative Abnormal Returns plot -1,75% -1,25% -0,75% -0,25% 0,25% 0,75% -5 -4 -3 -2 -1 0 1 2 3 4 5
Mean Market OLS
-1,75% -1,25% -0,75% -0,25% 0,25% 0,75% -5 -4 -3 -2 -1 0 1 2 3 4 5
40
Since I detect abnormal returns that are significantly different from 0, I reject the main hypothesis that the litigation announcements published by Capital Markets Board of Turkey release no new information to the stock market. Investors perceive these announcements as signals to reevaluate the value of the said stocks or that the underlying value of these assets are not fully reflected on their
pre-announcement prices.
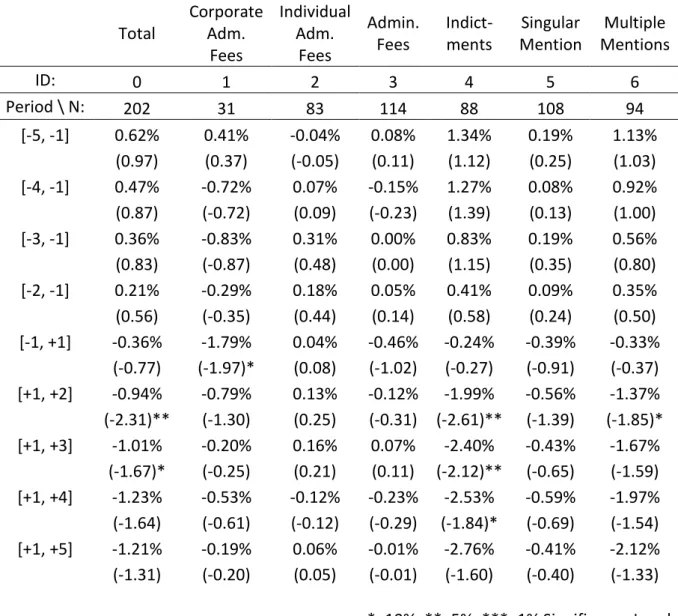
The abnormal returns are negative and highly significant; investors perceive the announcements as bad news. The announcements relay the news that either the companies failed to adhere to the regulations (charged with administrative fees) or their stock values were manipulated (indictments to the manipulators). Investors may see the indictment announcements as bad news for two reasons. First, short-sale restrictions make it harder to profit by manipulating the prices downwards (Aggarwal & Wu, 2006). Second, the investors’ perception of the information risk surrounding the mentioned stocks change with the announcements. To see whether investors see administrative fees announcements as bad news, I address subsample abnormal returns. Administrative fees subsample, spans Corporations subsample (corporate administrative fees) and individuals subsample (individual administrative fees). Administrative fees subsample abnormal returns show no consistent statistical significance. However, the results differ for its subsets. For announcements of corporate administrative fees, the mean adjusted abnormal return on the event day is -1.52% at 1% significance level. The market adjusted and OLS abnormal returns are also negative and significant at -1.09% and -1.19% (at 1% significance) respectively. The reaction to corporate administrative fees is