Molecular and Continuum Perspectives on Intermediate and Flow
Reversal Regimes in Electroosmotic Transport
Alper Tunga Celebi,
†Barbaros Cetin,
*
,†,‡and Ali Beskok
††Lyle School of Engineering, Southern Methodist University, 3101 Dyer Street, Dallas, Texas 75205, United States
‡Mechanical Engineering Department Microfluidics & Lab-on-a-chip Research Group, Bilkent University, Bilkent, Ankara 06800,
Turkey
ABSTRACT: Electroosmotic slipflows in the Debye−Hückel regime were previously investigated using molecular dynamics and continuum transport perspectives (J. Phys. Chem. C 2018, 122, 9699). This continuing work focuses on distinct electrostatic coupling regimes, where the variations in electroosmotic flows are elucidated based on Poisson−Fermi and Stokes equations and molecular dynamics simulations. In particular, aqueous NaCl solution in silicon nanochannels are considered under realistic electrochemical conditions, exhibit-ing intermediateflow and flow reversal regimes with increased surface charge density. Electroosmoticflow exhibits plug flow behavior in the bulk region for channel heights as small as 5 nm. With increased surface charge density, constant bulk
electroosmoticflow velocity first increases and then it begins to gradually decrease until flow reversal is observed. In order to capture the flow physics and discrete motions within electric double layer accurately, the continuum model includes overscreening and crowding effects as well as slip contribution and local variations of enhanced viscosity. After extraction of the continuum parameters based on molecular dynamics simulations, good agreement between simulation results and continuum predictions are obtained for surface charges as large as−0.37 C/m2.
1. INTRODUCTION
Electrokinetic effects are of great importance for precise control of liquid, ion, or (bio)particle transport in micro/nanoscale systems, and they exhibit a wide array of applications spanning from engineering to biology, chemistry, and geoscience.1−4 Transport in such small scale systems can be established by external electricfields or pressure gradients. Electroosmotic flow (EOF) is the motion of ionic liquids by an externally applied electricfield acting on the net charge within the electric double layer (EDL). When an ionic solution is in contact with static charges on a dielectric surface, the surface is rapidly charged due to its protonation/deprotonation reactions with ionic liquid, and EDL with a net charge is formed by the counterions.5An excess of dissolved ions in the diffuse part of the EDL flows with or against the applied electricfield and drag surrounding the water molecules. In practical applications, EDL thicknesses typically range from 1 to 100 nm for high-conductivity solutions and deionized water, respectively.6 This makes electroosmosis a nanoscale-induced transport phenomenon that can generate flows in micro/nanoscale applications. Clearly, electroosmosis and the double layer characteristics are greatly affected by the induced surface charge, which is an electrochemical property controlled by the ionic concentration, pH of the solution, and the surface chemistry.7
Well-known continuum-based analytical models are em-ployed to acquire an accurate and simple description of
electroosmotic flows in micro/nanoscale channels. Recently, we showed that the solution of Poisson−Boltzmann and Stokes (PB-S) equations with slip correction can correctly predict the electroosmotic velocity profiles obtained from molecular dynamics (MD) simulations in nano-/microchannels.8 Electro-chemical conditions were specifically chosen within the validity region of Debye−Hückel (DH) approximation, so that well-defined analytical solutions were applicable.8As surface charge progressively increases, nonclassical phenomena are encoun-tered in EDL, where conventional mean-field theories need to include new concepts like overscreening (charge inversion) and/or crowding. Overscreening was shown in experiments conducted using a high concentration of divalent and multi-valent ionic solutions in silicon nanochannels,9,10 while molecular origins of this intriguing phenomenon were elaborated using MD simulations.11Overscreening is induced by excessive adsorption of counterions at the Stern layer, where it exceeds the net charge of the surface. To reach a charge equilibrium, a larger number of co-ions assemble in the diffuse layer than the counterions, where overall effect changes the polarity of EDL. Crowding refers to more than one layer of counterions shielding the surface, which dominates
over-Received: March 18, 2019
Revised: April 25, 2019
Published: May 13, 2019
pubs.acs.org/JPCC Cite This:J. Phys. Chem. C 2019, 123, 14024−14035
screening and results in co-ion excess outside these layers.12 These anomalies appearing in the double layer generically lead to variations in flow characteristics, where the PB-S model cannot accurately predict EOFs. For example, Qiao and Aluru13 reported electroosmotic flow reversal of monovalent ionic solutions in slit-like nanopores at high surface charge densities using MD simulations. Due to sign inversion in EDL, co-ions induce the liquid flow in an opposite direction than the one obtained in classical continuum theory. Furthermore, charge inversion and flow reversal phenomena are also observed in simulation of divalent and multivalent ionic solutions in nanochannels.11,14 Using nonequilibrium MD simulations (NEMD), Prakash et al.14 showed that addition of divalent ions to a monovalent electrolyte escalate theflow reversal. In an interesting study, Yoshida et al.15showedflow reversal both by use of velocity profiles from classical NEMD simulation and by means of transport coefficients obtained from Green−Kubo formulation. Hartkamp et al.16 reported a study that flow reversal can be predicted using continuum theory by accounting for viscosity enhancement in Stern layer. Although this approach is suitable for predicting the influence of electric field strength at fixed surface charge density, this approach is not practical for predicting the influence of surface charge density. Rezaei et al.17 studied electroosmoticflows of monovalent aqueous solution in silicon channels as a function of surface charge density and identified different electrostatic coupling regimes. Overall, EOF velocity monotonically increases with increased surface charge within Debye−Hückel region, and then it decreases despite the increasing surface charge density. This intermediate zone holds until the electroosmoticflow reversal occurs.
Modeling of electrokinetic effects has been relied on mean-field approximation, which can only capture the exponential nature (i.e., monotonic decrease) of the charge distribution and does not take into account discrete nature of ions and variations in dielectric permittivity.18 Thus, classical PB theory cannot predict the anomalous nature of overscreening and/or crowding accurately. Nonetheless, these effects may be integrated into a model by relaxing the mean-field approximation with a local density approximation, so that a better estimation of ion distributions and charge densities can be made.19Bazant et al.12 proposed a semiphenomenological model to modify PB equation and derived a Poisson−Fermi (PF) equation to take into account crowding and overscreening effects. In the literature, the oscillatory nature of ion and charge distributions were described using a multiscale quasi-continuum modeling, where weighted-density approximations were typically consid-ered.19,20However, even simple forms of such models require solutions of intricate nonlinear integrals and/or integro-partial differential equations. Developing a continuum model based on mean-field and local approximations can provide relatively simple mathematical descriptions, which can be treated with conventional methods enabling solutions of relatively simple partial differential equations.
Molecular and continuum transport perspectives on electro-osmoticflows was well-described using the variations in viscosity and slip length enhancements within DH region in our previous work.8 In this study, we present an improved picture on all electroosmoticflow regimes that encapsulate intermediate flow and flow reversal regions. Aqueous NaCl solution in silicon nanochannels are investigated considering equal ionic concen-tration at a fixed thermodynamic state. MD simulations are performed to obtain the EOF velocity profiles as well as ion velocity profiles. To predict the flow physics in the intermediate
and flow reversal regimes, we have developed a continuum model based on Poisson−Fermi and Stokes (PF-S) equations together with overscreening, crowding effect, local variation of the viscosity, and slip lengths at various surface charge densities.
2. THEORY
Continuum models for EOFs require information on electro-kinetic potential within EDL and the solution offlow equations under an applied electrical body force. The present study considers a steady EOFs of monovalent NaCl solution between parallel plates. This assumes that the EDL values from both walls do not overlap, such that a bulkflow in the center of the channel is obtained. For such systems, the Poisson−Boltzmann (PB) equation determines the electrokinetic potential (φ) within EDL. We start with classical Boltzmann distribution of the ions (n±) n N Ze k T exp o B i k jjjjj y{zzzzzφ = ± ± (1)
where Z is the valence, e is the electron charge, kB is the Boltzmann constant, T is the temperature, and Nois the bulk ion concentration at the surface. For a symmetric and monovalent electrolyte that is in equilibrium with the charged surface, the PB equation is given by
ZeN
2 osinh( )
2φ φ
ϵ∇ = ̅ (2)
whereϵ is the relative permittivity and normalized electrokinetic potential is given byφ̅ = Zeφ/kBT. This derivation requires the assumption of dilute solution of point ions together with mean-field approximation.21,22
For concentrated solutions, additional concerns must be taken into consideration that constitute crowding (steric) effect and specific adsorption and ion−ion correlations. In addition, a reduced mobility is expected for modeling offluid flow at relatively high voltages at the wall (i.e., higher surface charge). The local viscosity at the vicinity of the wall may also increase with the presence of the finite-sized hydrated ions near the charged wall, which is referred to as the charge-induced thickening model.19Furthermore, inclusion of slip contribution in the momentum equation is essential to detect enhancement in electroosmoticflows.8
2.1. Crowding Effect. The dilute solution approach (i.e., PB equation) inherently assumes point-like ions together with mean-field approximation. The validity of this approach is questionable as the size of ions becomes comparable with the screening length or when a large voltage (compared to thermal voltage, kBT/e = 25 mV at room temperature) is applied on a polarizable surface. This large voltage typically attracts excess amount of ions, and eventually this generates a concentrated solution in the diffuse layer even if the bulk solution is dilute.19,23 Moreover, the dilute solution approach also can permit unrealistic overcharging of the diffuse layer at high voltages. Inclusion of crowding of finite-size ions corrects this phenomenon and predicts the experimentally observed “camel-shaped curve” of the capacitance of the EDL with an increasing voltage.19,24Although the discussion of steric effects is mainly for electrode surfaces at large voltages, it is also valid for surfaces with a largeζ potential. The crowding effect can be introduced using a modified PB equation (MPB) given by21
ZeN v 2 sinh( ) 1 2 sinh ( ) o 2 2 φ φ φ ϵ∇ = ̅ + ̅ (3)
where v = 2a3N
ois the bulk volume fraction of the ions and a is the effective size of the ion. One can observe that the PB equation is recovered for v = 0.
2.2. Overscreening. Nonlocal Coulomb correlations (i.e., electrostatic interactions between discrete ions) are not included in dilute solution approach, which requires the relaxation of mean-field approximation. For ionic liquids, charges near the electrode surface are configured in the form of layers leading to overscreening of the electrode potential. Although this phenomenon was first observed for electrode surfaces, a similar behavior was also observed in the case of ionic liquids in a confinement with large surface charge rather than large applied voltage.25 In addition, overscreening considers electrostatic correlations not only for ionic liquids but also for concentrated ionic solutions with multivalent ions.26Bazant et al.12 proposed a semiphenomenological model to introduce overscreening effect, and derived a Poisson-Fermi (PF) equation as follows l ZeN v (1 ) 2 sinh( ) 1 2 sinh ( ) c2 2 2φ o 2 φ φ ϵ − ∇ ∇ = ̅ + ̅ (4)
where lc is the electrostatic correlation length. One can notice the resemblance betweeneqs 3and4, where the left-hand side of
eq 4introduces a modified form of dielectric coefficient, given by
l
(1 c2 2φ)
ϵ̂ = ϵ − ∇ (5)
This approach accounts for the variation of spatial dielectric permittivity due to excess ion polarizability.27 Electrostatic correlation length (lc) is a length scale to measure the strength of electrostatic interactions in case of overscreening. If the distance between charged species is below lc, ions experience a strong electrostatic interaction, whereas if the distance is larger than lc, thermal energy and many-body interactions dominate the electrostatic contribution. Therefore, for concentrated solutions (e.g., Co> 0.1 M) or ionic liquids, the correlation length can be taken as the ion size including the solvent shell if applicable. However, lcis on the order of the Bjerrum length that defines the separation distance for dilute solutions, such that the thermal energy dominates the electrostatic effects.26With the inclusion of the electrostatic interactions, the charge layering at the interface becomes segregated, meaning that there form alternating layers of cations and anions, which lead to decaying oscillations (i.e., nonmonotonic behavior) in charge density as opposed to the monotonic decrease predicted by PB. Storey and Bazant26 reported that flow reversal for DC electro-osmotic flows may be explained using a continuum model that constitutes the overscreening effect.
2.3. Viscosity Variation near Charged Wall. At high surface charge density, ions experience reduced mobility due to strong electrostatic interactions, which manifest a local increase in liquid viscosity near the wall. Two common electro-rheological models which account for viscosity variations are viscoelectric effect28 and charge-induced thickening.19 The former includes an electricfield-squared viscosity (μ) correction in PB theory, given by E f (1 ) b 2 μ=μ + (6)
whereμbis the bulk viscosity,E is the electric field vector, and f is the viscoelectric coefficient. The viscoelectric effect attributes viscosity variation to the solvent and overlooks any potential dependence on charge density. To include the effect of charge density (ρe) on the local viscosity variation, a charge-induced
thickening model is proposed together with the steric effects as follows19,23 a Ze 1 1 b b e e n m b b e n m ,max 3 Ä Ç ÅÅÅÅÅ ÅÅÅÅÅ ÅÅ i k jjjjj j y { zzzzz z É Ö ÑÑÑÑÑ ÑÑÑÑÑ ÑÑ Ä Ç ÅÅÅÅÅ ÅÅÅÅÅ ÅÅ i k jjjjj j y { zzzzz z É Ö ÑÑÑÑÑ ÑÑÑÑÑ ÑÑ μ μ ρ ρ ε μ ρ ϵ = ϵ − | | = − | | (7)
where n and m are viscosity parameters. ρe, max is the steric constraint coming from the MPB model and corresponds to net electrical charge density at the maximum ion concentration and is equal to Ze/a3, where a is the effective size parameter. Note thateq 7postulates the dependence of permittivity and viscosity on the charge density. However, PF equation includes variation of dielectric permittivity via an operator. Since the variation of dielectric permittivity is included in the PF equation, the charge-induced thickening model,eq 7, can be simplified assuming a pure viscosity variation by lettingϵ = ϵb.19For an enhanced description, one can obtain a hybrid model by combining the viscoelectric effect and charge-induced thickening viscosity models as follows E f 1 (1 ) b e e m n ,max 2 2 Ä Ç ÅÅÅÅÅ ÅÅÅÅÅ ÅÅÅ i k jjjjj j y { zzzzz z É Ö ÑÑÑÑÑ ÑÑÑÑÑ ÑÑÑ μ μ ρ ρ = − | | + − (8)
2.4. Flow Model with Slip Contribution. To obtain electroosmotic velocity profiles in nanochannels together with overscreening and steric effects, we need the solution of PF equation given ineq 4for the EDL potential and Stokes equation for the velocity field. For a steady, incompressible, fully developed electroosmoticflow in absence of pressure gradients, 1D solution of the Navier−Stokes equations in the streamwise (x-) direction is reduced to y u y E d d d d e x i k jjjjjμ y{zzzzz= −ρ (9)
where u(x) and Exare the streaming velocity profile and applied electric field in the x-direction, respectively. Moreover, the Navier−Stokes equation without convection and pressure terms is reduced to Poisson’s equation and can be written as follows
y u y E y d d d d d d x 2 2 i k jjjjjμ y{zzzzz= ϵ φ (10)
Note that, the viscosity term on the left-hand-side is kept within the divergence term to take into account its local variations. Assuming constant viscosity,eqs 9 and 10 can be further simplified, and an analytical solution for EOF can be obtained.8Next, steric and overscreening effects are embedded in the model. The equations are nondimensionalized using the following notations y y H l H u u U zE k T , c c , , , D D HS B δ λ κ λ ζ ζ ̅ = = = ̅ = ̅ = (11)
where H is nanochannel height,ζ is the zeta potential, δcis the nondimensional correlation length, κ is the electrokinetic separation distance, u̅ is the velocity field normalized by well-known Helmholtz-Smoluchowski velocity given as
UHS= − μE
ϵ ζ
, andfinally λDis the Debye-Length to determine the EDL thickness given by
k T Z e N 2 D o B 2 2 λ = ϵ (12)
By further pursuit of a 1D analysis using the charged-induced thickening viscosity model as given ineq 7, the nondimensional governing equations for EDL potential and fluid flow can be respectively written as y y v d d d d sinh( ) 1 2 sinh ( ) c2 2 4 4 2 2 2 2 δ κ φ φ κ φ φ ̅ ̅ − ̅ ̅ = − ̅ + ̅ (13) and y v v u y v d d 1 sinh( ) 1 2 sinh ( ) d d sinh( ) 1 2 sinh ( ) 0 n m 2 2 2 l m ooo n ooo Ä Ç ÅÅÅÅÅ ÅÅÅÅÅÅ ikjjjjj y { zzzzz ÉÖÑÑÑÑÑÑÑÑÑÑÑ |}ooo ~ ooo φ φ κ ζ φ φ ̅ + | ̅ | + ̅ ̅ ̅ + ̅ ̅ + ̅ = − (14)
In this model, we include charge-induced thickening model to capture theflow physics with the increasing surface charge. A hybrid model in the form ofeq 8may be more accurate, but it introduces manyfitting parameters, which defeats the purpose of an elegant and practical model. In the current approach, we have only n and m as free parameters for viscosity, and the latter is fixed for all cases. Solution ofeqs 13and14requires boundary conditions. For electrokinetic potential, four individual boun-dary conditions are needed since PF equation is a fourth-order equation. Two boundary conditions are assigned at the walls while the other two conditions are assigned at the bulk region.12 These boundary conditions are written in nondimensional form as follows y H ZE k T y y d d and d d 0 at 0 B 3 3 i k jjjjj y{zzzzz φ σ σ φ ̅ ̅ = − ϵ = ̅ ̅ ̅ = ̅ = (15) and y y 0 and d d 0 at 1/2 2 2 φ̅ = φ̅ ̅ = ̅ = (16)
where σ and σ̅ are the surface charge density and its nondimensional form. The third-order boundary condition was introduced as a consequence of the semiphenomenological model, and it implies that the mean-field charge density is flat near the surface.12 The boundary conditions at the channel center imply zero potential and symmetry. Boundary conditions for EOF in a nanochannel consider velocity slip at the liquid− solid interface, which can be described by Navier-type slip conditions.8The nondimensional form is given by
u H u y d d β ̅ = ̅ ̅ (17)
whereβ is the slip length. Additionally, a symmetry condition at the channel center is imposed as du̅/dy̅ = 0.
The solutions of electrokinetic potential and velocity profiles are obtained using the General Mathematics module of COMSOL Multiphysics commercial finite element package (COMSOL AB, Stockholm, Sweden). The PF equation is written in terms of two coupled second-order equations (following a transformation, ψ = d2φ̅/dy̅229
). Following the computation of the EDL potential, the equation forfluid flow is solved with the corresponding source term. After a convergence test for mesh independency, a total of 500 elements are used,
which are densely distributed near the wall. To obtain convergence, fourth-order quartic Lagrange elements are employed for the PF equation while second-order quadratic Lagrange elements are employed for thefluid flow.
3. COMPUTATIONAL DETAILS
We consider a three-dimensional model system consisting of aqueous NaCl solution confined between two parallel silicon walls. A schematic representation is shown in Figure 1. The
lateral dimensions of the simulation domain are 4.61 and 4.66 nm in x- and z -directions, respectively, while the channel height is 5 nm in the y-direction. This channel height was carefully chosen to avoid any electric double layer (EDL) overlap at specified ionic and electrochemical conditions. Furthermore, water density profiles can exhibit a layering region near walls due to wall force-field and an apparent bulk region is observed at the channel center. This channel height is large enough to show a continuum-like behavior. Several earlier studies reported that continuum transport theory can hold up to channel sizes of 2−3 nm.30−32 For smaller scales, the local thermodynamic equilibrium is inaccurate, and continuum variables like density, velocity and viscosity may become irrelevant.
Each solid wall is made up of four layers of silicon atoms oriented in a⟨111⟩ lattice configuration. The silicon atoms are constrained at their initial positions to obtain a cold wall behavior, whereas the rest of the atomic species are free to move. Pure silicon in nature rapidly reacts with oxygen and forms silica.33MD simulations of silica are computationally expensive, and the simulation parameters for oxygen and hydrogen atoms in the silinol groups are not well-defined. To address this difficulty, we model silicon surfaces with realistic surface charges based on the protonation/deprotonation reactions of silanol groups for a silica surface at specified ionic condition, pH, and temperature.34−36 The surface charges are induced by homogeneously distributing point charges on the silicon atoms at the innermost layer of each wall.37,38Total negative charges on the walls are balanced with an excess of counterions to satisfy the electric neutrality of the MD simulations. The total
Figure 1.Schematic of the simulation domain.
number of ions is carefully selected to maintain a constant bulk ionic concentration of 1.0 M for all surface charge densities. Furthermore, the number of water molecules for each surface charge density is varied to ensure a constant bulk water density at 997 kg/m3at T = 300 K, which induce afixed thermodynamic state.
Intermolecular forces between all atomic particles are modeled using Lennard-Jones (LJ) and Coulomb potentials given by r r r q q r ( ) 4 1 4 ij ij ij ij ij i a j b i j ij 12 6 0 Ä Ç ÅÅÅÅÅ ÅÅÅÅÅ ÅÅÅ i k jjjjj j y { zzzzz z i k jjjjj j y { zzzzz z É Ö ÑÑÑÑÑ ÑÑÑÑÑ ÑÑÑ
∑ ∑
ε σ σ π Φ = − + ϵ (18)where ε and σij are the well-depth and molecular diameter, respectively.ϵ0is the dielectric constant for vacuum, qi is the partial charge of atom i, and rij is the distance between two particles. The extended simple point charge (SPC/E) water model is used to describe the interaction between water molecules. This water model exhibits good performance in predicting hydrodynamic properties of bulk water at various thermodynamic conditions, and it is a commonly for aqueous NaCl solution.39,40 Water molecules are kept rigid by maintaining constant bond lengths and angles using SHAKE algorithm.41 The interaction parameters of silicon atoms are taken from Qiao and Aluru.30GROMACS forcefield is used for sodium (Na+) and chloride (Cl−) ions.42 To describe the potential parameters between dissimilar atoms, we consider Lorentz−Berthelot combination. The interaction parameters of each atomic species are listed inTable 1.
MD simulations are performed using large-scale atomic/ molecular massively parallel simulator (LAMMPS).43Periodic boundary conditions are applied in the lateral directions, while a slab modification is applied to calculate the electrostatic interactions for the reduced periodicity due to the confinement in z-direction.44 Long-range electrostatic interactions are handled using particle−particle−particle−mesh (PPPM) algo-rithm with a root mean accuracy of 10−5.45This accuracy defines the relative root-mean-square error in per-atom force that is explicitly computed by the long-range algorithm.43 A cutoff distance of 1.1 nm is considered in short-range contribution of LJ and Coulomb potentials. We integrate Newton’s equation of motion using the Verlet algorithm with 1 fs timesteps. First, MD simulations are performed to reach thermal equilibrium without any external force for 2 ns. Initial velocities on each water molecule are randomly set using a Gaussian distribution at specified temperature.
Electroosmotic flow is induced by external electric field applied on thefluid in the x-direction. Solution temperature, volume, and total number of particles are maintained by using the canonical ensemble (NVT) tofix the temperature at 300 K. The Nosé−Hoover thermostat is applied on the degrees of freedom perpendicular to theflow direction. The lectric field
(0.25 V/nm) is specifically chosen to create maximum velocities lower than 20 m/s. This is important to avoid any nonlinear response on the transport properties due to the high-speed flows.46,47
It should be also noted that such high electricfield strengths are experimentally difficult because of dielectical breakdown, but it is essential in MD research to obtain an enhanced velocity signal-to-noise ratio.48 The time scale for momentum diffusion is tD = H2/v, where ν is the kinematic viscosity and H is channel height.49Wefirst run 20 ns to ensure that a steady-state is reached, then an additional 100 ns was executed for collecting data and statistical averaging. This longer averaging time is particularly required to obtain better statistics in ionic velocities.
4. RESULTS
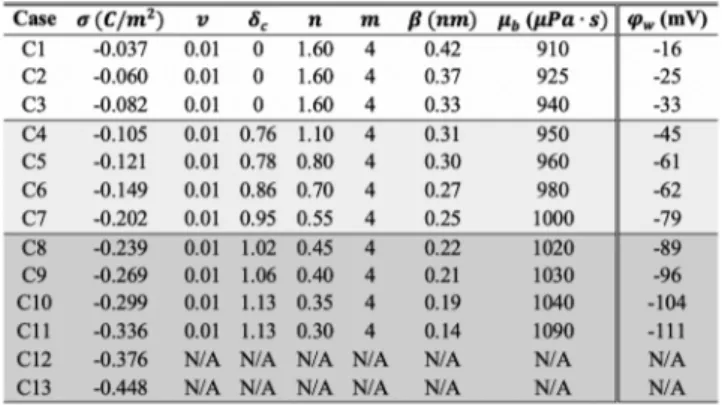
4.1. Parameter Selection. The continuum model for EOF at various surface charge densities requires knowledge of six independent parameters such as bulk volume fraction (v), nondimensional correlation length (δc), slip length (β), enhanced bulk viscosity (μb), and charge-induced thickening model parameters (n and m). The definitions of all these parameters rely on physical reasoning and observation. A list of these parameters as a function of surface charge densities is given inTable 2. First, the slip length (β) and enhanced bulk viscosity
(μb) are determined based on force-driven nanochannel flow simulations from our earlier studies.8,50,51 Selection of the remaining parameters are as follows:
Bulk Volume Fraction (ν). v mainly controls the EDL potential near the wall and the locations of charge reversal at the intermediate andflow reversal regime. Bulk volume fraction is commonly calculated using the 2a3No relation, where a is the effective size parameter correlated to spherical ion diameter d as a3= 0.83d3.26However, definition of the effective value of ion size is still debatable.19It is somewhere between the bare ion diameter and a value slightly larger than the hydrated ion diameter.19Considering the bare diameter of the Na+ion as 0.19 nm and the hydrated diameter as typically 0.72 nm, ν corresponds to a value in the range 0.007−0.35, respectively. Assessing the behavior of the charge density in the intermediate andflow reversal regimes, we set this parameter as 0.01. This parameter is a function of effective ion size and bulk ionic concentration. Our study considers a constant v, since we use a constant bulk ionic concentration (1.0 M) for all cases. Table 1. Interaction Parameters for Atomic Species
atom σ (nm) ε (kJ/mol) q(e̅)
O 0.3165 0.6507 −0.848
H 0 0 0.424
Na+ 0.2575 0.0625 1
Cl− 0.4448 0.4445 −1
Si 0.3385 2.4491 −0.0655
Table 2. Parameters for the Continuum Model and the Corresponding Wall Potentials at Various Surface Chargesa
aThe parameters are derived from MD simulations, and the bestfit to
atomistic results as described insection 4.1.
Nondimensional Correlation Length (δc= lc/λD).δccontrols the electrostatic correlation effect near the charged wall. In the DH region (i.e., for low surface charges),δcis assumed to be zero so that the model reduces to the MPB model, while it increases from 0.76 to 1.13 with increasing surface charge beyond the DH regime. In the intermediate region, MD simulations predict a velocity overshoot in the vicinity of the wall followed by a valley which means the bulk solution has a lower velocity than thefluid
molecules near the wall. This behavior is mainly due to overscreening (which means that the charge density goes below zero locally) with increased surface charge.
Viscosity Parameters (n and m). Through charged-induced thickening, the viscosity variations are controlled by charge density. Parameters of n and m are introduced to correctly approximate local nonlinear variation of the viscosity as a function of surface charge. Tuning these parameters can amplify
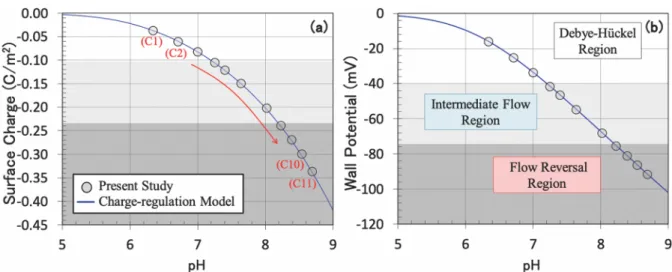
Figure 2.Variation of (a) surface charge density and (b) wall potential of 1.0 M NaCl solution on silica-based surface as a function of pH of the solution. The data for each case can be found inTable 2.
Figure 3.Comparison of continuum-based and MD-predicted ionic concentrations at various surface charges: (a) DH region, (b) intermediateflow region, and (c and d)flow reversal regions.
or diminish the viscosity. Instead of varying the two parameters by considering all cases, we set parameter m as 4.0, and then, we vary the parameter n to match the velocity profiles obtained by MD simulations. We observed that the reduced velocity can be modeled accurately by decreasing parameter n with increased surface charge.
4.2. Electrochemical Conditions. Current study considers 13 different electrochemical condition cases (C1−C13), where different electrostatic coupling regimes are observed as illustrated in Figure 2. Electrochemical conditions such as surface charge density and related wall potential cannot be chosen arbitrarily where they strongly depend on the ionic and thermodynamic conditions.8 In a recent review paper by Hartkamp et al.,52 an advanced discussion on experimental characterization and molecular modeling of charged interfaces is provided, where a reliable characterization of surface charge is significant since it controls many static and dynamic properties of micro-/nanofluidic systems. This study considers a charge-regulation model to theoretically estimate the surface charge density and wall potential considering association/dissociation reactions of the surface at known ionic concentration, pH of the solution, and temperature.5,53 In Figure 2a, we show the variation of surface charge densities for 1.0 M of NaCl solution confined in planar silica channels using charge-regulation model. Note that the shape of nanostructure (i.e., planar or spherical) which is in contact with solution is important and it can alter the electrochemical properties.7In addition, surface charge densities used in the present study (shown with circle) consider a reasonable range of pH values. More importantly, as shown in
Figure 2b, wall potentials calculated based on PF equation given ineq 14of this study perfectly agree with those of calculated from charge-regulation model at various surface charge densities. It is imperative to know that charge-regulation model implicitly calculate wall potential considering surface reactions of silica (please see eqs 14 and 20 reported in Yeh et al.53), while the PF equation is only based on the input surface charge density as given ineq 15of the present study. InFigure 2, we found that the DH region is valid up to case C4, where the surface charge is lower than−0.105 C/m2, which corresponds to a wall potential of−45 mV. This is the point that intermediate flow region starts, and it is still observable between cases C4 through C7, up to a surface charge density of−0.239 C/m2and wall potential of−89 mV. At this point, flow reversal regions are observed. Herein, one interesting outcome is that the flow reversalfirst increases (cases C8−C10), and then it saturates as the surface charge is further increased to more than−0.336 C/ m2. Beyond this value, flow reversal decreases with surface charge as shown in C12 and C13. For such cases, we do not present continuum predictions, since it is outside the validity region of the current PF-S model. It should be also noted that this study does not model any hydronium (H+) or hydroxyl (OH−) ions in the electrolyte solution. For given pH values (pH = −log([H+]), the numbers of H+ and OH− are very low compared with the other species in the solution in the nanosized channel. Furthermore, NaCl is a neutral salt, and it will not dissociate in water to result in H+or OH−to change the pH of the solution.
Figure 4.MD-predicted water density profiles: (a) DH region, (b) intermediate flow region, and (c and d) flow reversal regions.
4.3. Electroosmotic Flow Simulations and Continuum Predictions. Water density profiles and ion concentrations exhibit layering near solid walls due to the governing interface phenomena and a constant density is obtained away from the solid walls. As surface charge increases, more ions are absorbed to the charged surface. This clearly alters the ion and water distributions near the wall. In Figure 3, we show the ionic concentrations of Na+ and Cl− for half channel height at different surface charge densities in each electrostatic coupling regime, and we compare MD predictions with the solution of continuum model based oneq 14. For clarity, only four cases are presented in thefigure. MD simulations clearly show that first Na+ion peak increases approximately from 4 to 90 M for surface charges of−0.082 to −0.376 C/m2, respectively. In the DH regime, the counterion concentration is larger than that of co-ions within the double layer obeying the classical Gouy− Chapman theory. However, in intermediate andflow reversal regions, the population of Na+near surface becomes very large due to strong electrostatic interactions, and the cumulative charge exceeds the surface charge. For such cases, co-ions in double layer compensate for this excess charge by creating a
larger Cl−distribution than that of Na+, as can be better seen in the inset ofFigure 3b. This net charge difference become more observable from the intermediateflow region toward the flow reversal region. Continuum predictions of ion distributions exhibit a good agreement with MD results for cases C1 through C8 while it shows a reasonable agreement for cases C9−C11. It can be noticed that oscillatory behavior of ion distribution cannot be fully captured even with the presence of the overscreening correction. In addition, our model fails to predict ion distributions when the surface charge becomes larger than −0.376 C/m2, cases C12 and C13. This is mainly due to the net charge density peak showing drastic oscillations from positive to negative, which cannot be predicted by the current continuum modeling based on mean-field and local approximations. Furthermore, MD results show that Na+ peaks get slightly closer to the wall with increased surface charge. Due to the hydration of ions, the location of thefirst water density peaks get closer to the walls. We define a slip plane at the location of first water density peak, and the wall is defined at this location for the continuum model.8,31,50
Figure 5.Water and ion velocities as a function of surface charge density.
In Figure 4, the water density profiles predicted by MD simulations are shown for different regions. In the DH regime,
Figure 4a, the density profiles are slightly different which exhibits
thefirst peak around 2500 kg/m3. This is followed by a reduced second peak and saturation to the bulk value after a minute third peak. The density profile has a diffusive nature. In the intermediateflow region,Figure 4b, thefirst and second peaks gradually increase with the increasing surface charge, which indicates strong attraction of water molecules toward the wall. Although the location of thefirst peaks more or less is the same,
the second peaks get closer to the wall with the increase in the surface charge. As we proceed to theflow reversal region,Figure 4c, thefirst peaks continue to increase and reach as high as 6000 kg/m3. The second peaks also increase with increased surface charge, and distinguishable third peaks are obtained. When the surface charge further increases, the first and second density peaks start to decrease as shown inFigure 4d. In conjunction withFigure 3d, this extended region of theflow reversal regime (which we callflow reversal region-II hereafter) shows distinct monolayers of Na+, water and Cl−. Unlike for the cases in parts
Figure 6.Velocity profiles at various surface charge densities illustrated in each electrostatic coupling region.
a−c ofFigure 3, a monolayer of Na+ion is formed at a location closer than thefirst water density peak, which is followed by a Cl− monolayer. Then, the Cl− peak is followed by two Na+ peaks, and then, co-ions dominate the rest of the EDL as in the case of the intermediate region. Furthermore, one can notice very small density peaks near the charged wall, which is caused by the orientation of water molecules. Water molecules rotate their dipole moments toward the charged wall, creating hydrogen peaks here. With increased surface charge, the number of positively charged hydrogen atoms pointing toward negatively charged wall increases, and thus the magnitude of these density peaks slightly increases.
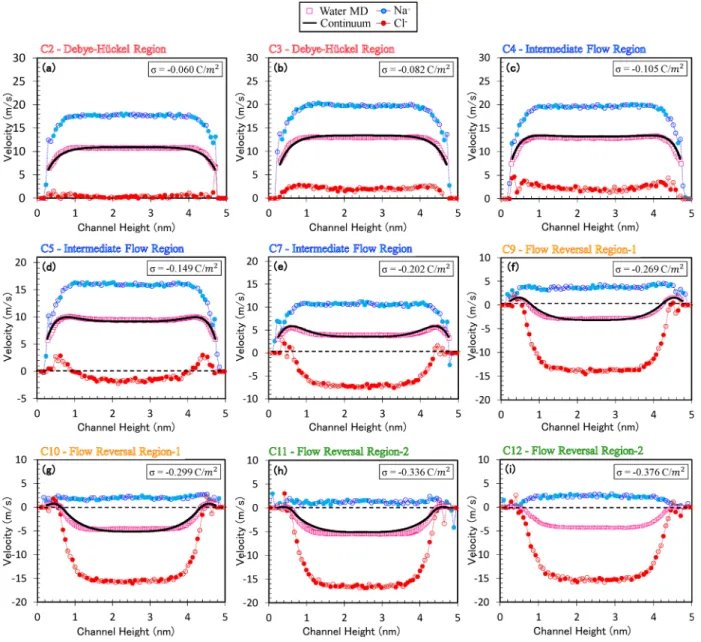
InFigure 5, we show EOF velocity profiles obtained from MD simulations and compare them with predictions from con-tinuum transport model at a wide range of surface charge densities. Independent from surface charge, each velocity profile exhibits a constant bulk flow region at the channel center. However, velocity profiles significantly vary near the wall at various charges mainly due to the overscreening ions. Flow domains are started from slip plane, which is defined at the first water density peak as explained earlier. Our continuum transport model yields a very good agreement with electro-osmoticflow velocities of MD simulations at both near wall and bulkflow regions for surface charges up to −0.336 C/m2. This encapsulates predictions not only in DH but also in intermediate flow and flow reversal regions. First, electroosmotic flow monotonically increases with increased surface charge density within the validity of DH region (cases C1−C3). Afterward, water speed begins to decrease with increased surface charge, but theflow is still in the electric field direction (cases C4−C7). In the intermediateflow region, bulk velocities at the center of the channel exhibit depletion behavior, while a hook-like velocity profile was formed in the EDL with increased surface charge density due to ionic motion. InFigure 5, we also show ionic velocity distributions at various surface charges that best explains the physics behind obtained electroosmotic flow profiles. In parts a and b ofFigure 5, Na+ions are dominant in the diffuse layer, moving in the applied electric field direction. Thus, they drag the electrically neutral water molecules with them. Meanwhile, negative Cl−ions tend to move opposite to the electricfield, but their motion is slower than that of water flow. Thus, they move in the field direction with a slower speed. However, as surface charge increases beyond −0.105 C/m2, overscreening is observed. For such cases, Na+ions overshield charged surface, and co-ions (Cl−) dominate the diffuse layer instead of counterions. As can be seen from parts c−g ofFigure 5, the bulk velocity of Cl−ionsfirst gradually decreases and then it begins to move opposite to the direction of the electricfield. However, the velocity of Na+ions decreases with surface charge in the electricfield direction. In the intermediate flow region, the speed of counterions still overcome that of co-ions, which results in continuously decreasing water flow in the direction of the electric field until it becomes zero. Afterward, flow reversal occurs where negative water velocities are observed as shown in parts f−j ofFigure 5. Flow reversal starts at−0.239 C/m2and it increases with increased surface charges up to −0.336 C/m2 (cases C8−C10). Any further increase in the surface charge decreases the bulk velocity and deteriorates the electroosmotic flow in the channel due to extreme overscreening. As can be seen inFigure 3d, the ion distribution shows very strong peaks and strong electrostatic interactions and herein leads to an immobile layer near the wall with a thickness of about 0.6 nm. Any further increase in the surface charge enhances the electrostatic
interactions and does not further improve the velocity of the bulk solution. A similar behavior was also shown previously by Storey and Bazant.26With a simple model (neglecting viscosity variation and slip velocity), they presented that the bulkflow velocityfirst decreased and then reversed and was followed by an approach to zero bulk velocity with increased wall potential, which also corresponds to increased surface charge (see Figure 2f in ref26).
The continuum model approximates oscillating ionic concentrations as monotonic distributions in the DH regime and approximates as nonmonotonic distributions for surface charge densities up to−0.336 C/m2as illustrated inFigure 3. The ionic concentrations determine the net charge density, which is the driving mechanism for thefluid flow. Although net charge density in the nanochannel is an approximation, the velocity profile can be predicted quite accurately for the surface charges up to−0.336 C/m2(case C11). However, since our computational model relies on mean-field and local approx-imations, it cannot capture strong oscillations observed hereafter, which also leads to discrepancy in the velocity profiles. Actually, the discrepancy between the continuum model and MD simulations also starts at a surface charge of −0.336 C/m2(case C11), and we did not push our continuum model beyond this point. It is also worth mentioning that such high surface charge densities are also quite extreme for silica.54 Therefore, our continuum transport model is limited, and it typically overpredicts the EOF velocity profiles beyond a surface charge of−0.336 C/m2. Therefore, this reversal region can be separately categorized. To clearly highlight all governing electrostatic coupling regions, we present electroosmoticflow velocity profiles for all 13 different surface charge densities in
Figure 6. The bulkflow velocities as a function of the surface charge are given in Figure 6e to quantify the relationship between the surface charge and different EOF regimes. A similar behavior was also reported in a recent study by Rezaei et al.55
In Figure 7, we show the variation of nondimensional correlation length (δc) and coefficient n as a function of surface
charge density. In the DH region, we assume n = 1.6 andδc= 0. This is reasonable since δc is a parameter for defining overscreening. In the intermediateflow region, we observe a sharp decrease of coefficient of n, which also continues in the flow reversal region. δcfirst increases with surface charge, and then it converges to a constant value in theflow reversal region.
Figure 7.Variation of nondimensional electrostatic correlation length and coefficient of n at various surface charge densities.
From a physical point of view,δcincreases with increased surface charge since the electrostatic interactions amplify. Around a surface charge of −0.336 C/m2 (case C11), δ
c reaches an asymptotic value, and this is considered as applicability limit of the current continuum model (therefore, the transition from C10 to C11 is shown with a dashed line). From this point on, the strong oscillations in ionic concentrations cannot be captured by the continuum model. The coefficient n reduces the increased surface charge to simulate the mobile layer. As n decreases, the slip plane effectively moves far away from the wall. These variations are essential to add the effect of overscreening and local viscosity variations on electroosmoticflow velocity.
In general, all the parameters listed in Table 2account for physical phenomena occurring within EDL; therefore, these parameters do not depend on channel width as long as the channel is larger than the EDL thickness. Besides depending on the surface charge, δc and ν have dependences on No; more specifically, δchas a dependence on (No)0.5.19
In addition, the crowding of a highly charged diffuse layer increases the local viscosity, and one could postulate that the viscosity variation depends on No which can also be seen in eq 14 through dependence ofν on No. However, since the bulk concentration is kept constant in this study, the dependence of coefficients of n and m on concentration cannot be predicted with the current results. Considering slip length, earlier works showed that it is independent of channel height8,49,56 and applied electric field.8,57
However, the presence of salt ions has a distinctive effect on the dynamics of water in nanochannels, where significant variations in contact angle, slip length, and flow rate are observed at different ion concentrations.58
5. CONCLUSIONS
We provide an extended investigation for the intermediateflows andflow reversal regimes using MD simulations. To support the MDfindings, we have developed a continuum EOF model based on PF-S equations which includes the effects of overscreening, crowding, local variation of the viscosity, and slip lengths. Six independent parameters are present in the continuum model. On the basis of physical reasoning and observation, these parameters are extracted from molecular dynamics simulations. Except for very large surface charge densities (higher than −0.299 C/m2), we demonstrated an excellent agreement between MD and continuum results at various surface charge densities which corresponds to intermediate flow and flow reversal regimes. The apparent viscosity and slip lengths employed in our continuum model are obtained from force-driven MD simulations. Thirteen cases with different surface charge densities with equal electricfield strengths (0.25 V/nm) and bulk ionic concentrations (1.0 M) are presented. The selection process of the parameters used in the continuum model is discussed in detail. It is observed that electroosmotic flow monotonically increases with increased surface charge density in the DH regime, and then starts to decrease with increased surface charge in the intermediate region. In theflow reversal regime, the electroosmoticflow reverses its direction, and any further increase in the surface charge decreases the electroosmotic flow speed. We conclude that the cases with surface charges higher than−0.376 C/m2cannot be captured with the current continuum model. In this regime, the ions become immobile, and this regime requires more investigation which is left for future studies.
■
AUTHOR INFORMATION Corresponding Author*(B.C.) E-mail:[email protected]. Telephone: +90-312-290-2108. Fax: +90-312-266-4126.
ORCID
Barbaros Cetin:0000-0001-9824-4000 Ali Beskok:0000-0002-8838-5683 Notes
The authors declare no competingfinancial interest.
■
ACKNOWLEDGMENTSB.C. would like to acknowledge funding from the Turkish Academy of Sciences through the Outstanding Young Scientist Program (TÜBA-GEBİP) and Science Academy Association Distinguished Young Scientist Award (BAGEP). Simulations were performed using the high performance computing facilities of the Center for Scientific Computation at Southern Methodist University. We also would like to thank Dr. R. M. Hartkamp for useful discussions and insightful remarks. B.C. would also like to thank Ms. Canan Topsakal for her continuous support for this study.
■
REFERENCES(1) Angelova, A.; Angelov, B.; Lesieur, S.; Mutafchieva, R.; Ollivon, M.; Bourgaux, C.; Willumeit, R.; Couvreur, P. Dynamic Control of Nanofluidic Channels in Protein Drug Delivery Vehicles. J. Drug Delivery Sci. Technol. 2008, 18, 41−45.
(2) Ramsey, R.; Ramsey, J. Generating Electrospray from Microchip Devices Using Electroosmotic Pumping. Anal. Chem. 1997, 69, 1174− 1178.
(3) Stone, H. A.; Stroock, A. D.; Ajdari, A. Engineering Flows in Small Devices: Microfluidics toward a Lab-on-a-Chip. Annu. Rev. Fluid Mech. 2004, 36, 381−411.
(4) Plümper, O.; Botan, A.; Los, C.; Liu, Y.; Malthe-Sørenssen, A.; Jamtveit, B. Fluid-Driven Metamorphism of the Continental Crust Governed by Nanoscale Fluid Flow. Nat. Geosci. 2017, 10, 685.
(5) Lyklema, J. Fundamentals of Interface and Colloid Science: Soft Colloids; Academic Press: Cambridge, MA, 2005.
(6) Karniadakis, G. E.; Beskok, A.; Aluru, N. Microflows and Nanoflows: Fundamentals and Simulation; Springer Science & Business Media, New York, 2006; Vol. 29.
(7) Barisik, M.; Atalay, S.; Beskok, A.; Qian, S. Size Dependent Surface Charge Properties of Silica Nanoparticles. J. Phys. Chem. C 2014, 118, 1836−1842.
(8) Celebi, A. T.; Beskok, A. Molecular and Continuum Transport Perspectives on Electroosmotic Slip Flows. J. Phys. Chem. C 2018, 122, 9699−9709.
(9) Van der Heyden, F. H.; Stein, D.; Besteman, K.; Lemay, S. G.; Dekker, C. Charge Inversion at High Ionic Strength Studied by Streaming Currents. Phys. Rev. Lett. 2006, 96, 224502.
(10) Besteman, K.; Zevenbergen, M.; Lemay, S. Charge Inversion by Multivalent Ions: Dependence on Dielectric Constant and Surface-Charge Density. Phys. Rev. E 2005, 72, 061501.
(11) Lorenz, C. D.; Travesset, A. Charge Inversion of Divalent Ionic Solutions in Silica Channels. Phys. Rev. E 2007, 75, 061202.
(12) Bazant, M. Z.; Storey, B. D.; Kornyshev, A. A. Double Layer in Ionic Liquids: Overscreening Versus Crowding. Phys. Rev. Lett. 2011, 106, 046102.
(13) Qiao, R.; Aluru, N. Charge Inversion and Flow Reversal in a Nanochannel Electro-Osmotic Flow. Phys. Rev. Lett. 2004, 92, 198301. (14) Prakash, S.; Zambrano, H. A.; Rangharajan, K. K.; Rosenthal-Kim, E.; Vasquez, N.; Conlisk, A. Electrokinetic Transport of Monovalent and Divalent Cations in Silica Nanochannels. Microfluid. Nanofluid. 2016, 20, 8.
(15) Yoshida, H.; Mizuno, H.; Kinjo, T.; Washizu, H.; Barrat, J.-L. Molecular Dynamics Simulation of Electrokinetic Flow of an Aqueous
Electrolyte Solution in Nanochannels. J. Chem. Phys. 2014, 140, 214701.
(16) Hartkamp, R.; Siboulet, B.; Dufrêche, J.-F.; Coasne, B. Ion-Specific Adsorption and Electroosmosis in Charged Amorphous Porous Silica. Phys. Chem. Chem. Phys. 2015, 17, 24683−24695.
(17) Rezaei, M.; Azimian, A.; Semiromi, D. T. The Surface Charge Density Effect on the Electro-Osmotic Flow in a Nanochannel: A Molecular Dynamics Study. Heat Mass Transfer 2015, 51, 661−670.
(18) Bhadauria, R.; Aluru, N. Multiscale Modeling of Electroosmotic Flow: Effects of Discrete Ion, Enhanced Viscosity, and Surface Friction. J. Chem. Phys. 2017, 146, 184106.
(19) Bazant, M. Z.; Kilic, M. S.; Storey, B. D.; Ajdari, A. Towards an Understanding of Induced-Charge Electrokinetics at Large Applied Voltages in Concentrated Solutions. Adv. Colloid Interface Sci. 2009, 152, 48−88.
(20) Bhadauria, R.; Aluru, N. A Multiscale Transport Model for Non-Classical Nanochannel Electroosmosis. J. Chem. Phys. 2017, 147, 214105.
(21) Kilic, M. S.; Bazant, M. Z.; Ajdari, A. Steric Effects in the Dynamics of Electrolytes at Large Applied Voltages. I. Double-Layer Charging. Phys. Rev. E 2007, 75, 021502.
(22) Kilic, M. S.; Bazant, M. Z.; Ajdari, A. Steric Effects in the Dynamics of Electrolytes at Large Applied Voltages. Ii. Modified Poisson-Nernst-Planck Equations. Phys. Rev. E 2007, 75, 021503.
(23) Bazant, M. Z.; Kilic, M. S.; Storey, B. D.; Ajdari, A. Nonlinear Electrokinetics at Large Voltages. New J. Phys. 2009, 11, 075016.
(24) Kornyshev, A. A. Double-Layer in Ionic Liquids: Paradigm Change? J. Phys. Chem. B 2007, 111, 5545−5557.
(25) Yochelis, A. Spatial Structure of Electrical Diffuse Layers in Highly Concentrated Electrolytes: A Modified Poisson−Nernst− Planck Approach. J. Phys. Chem. C 2014, 118, 5716−5724.
(26) Storey, B. D.; Bazant, M. Z. Effects of Electrostatic Correlations on Electrokinetic Phenomena. Phys. Rev. E 2012, 86, 056303.
(27) Hatlo, M. M.; Van Roij, R.; Lue, L. The Electric Double Layer at High Surface Potentials: The Influence of Excess Ion Polarizability. EPL (Europhysics Letters) 2012, 97, 28010.
(28) Lyklema, J.; Overbeek, J. T. G. On the Interpretation of Electrokinetic Potentials. J. Colloid Sci. 1961, 16, 501−512.
(29) Liu, J.-L. Numerical Methods for the Poisson−Fermi Equation in Electrolytes. J. Comput. Phys. 2013, 247, 88−99.
(30) Qiao, R.; Aluru, N. Ion Concentrations and Velocity Profiles in Nanochannel Electroosmotic Flows. J. Chem. Phys. 2003, 118, 4692− 4701.
(31) Ghorbanian, J.; Celebi, A. T.; Beskok, A. A Phenomenological Continuum Model for Force-Driven Nano-Channel Liquid Flows. J. Chem. Phys. 2016, 145, 184109.
(32) Travis, K. P.; Todd, B.; Evans, D. J. Departure from Navier-Stokes Hydrodynamics in Confined Liquids. Phys. Rev. E: Stat. Phys., Plasmas, Fluids, Relat. Interdiscip. Top. 1997, 55, 4288.
(33) Behrens, S. H.; Grier, D. G. The Charge of Glass and Silica Surfaces. J. Chem. Phys. 2001, 115, 6716−6721.
(34) Graf, K.; Kappl, M. Physics and Chemistry of Interfaces; John Wiley & Sons: Weinheim, Germany, 2006.
(35) Iler, R. K. The Chemistry of Silica; J. Wiley and Sons, New York, 1979.
(36) Atalay, S.; Barisik, M.; Beskok, A.; Qian, S. Surface Charge of a Nanoparticle Interacting with a Flat Substrate. J. Phys. Chem. C 2014, 118, 10927−10935.
(37) Qiu, Y.; Ma, J.; Chen, Y. J. L. Ionic Behavior in Highly Concentrated Aqueous Solutions Nanoconfined between Discretely Charged Silicon Surfaces. Langmuir 2016, 32, 4806−4814.
(38) Cazade, P.-A.; Hartkamp, R.; Coasne, B. Structure and Dynamics of an Electrolyte Confined in Charged Nanopores. J. Phys. Chem. C 2014, 118, 5061−5072.
(39) Mark, P.; Nilsson, L. Structure and Dynamics of the Tip3p, Spc, and Spc/E Water Models at 298 K. J. Phys. Chem. A 2001, 105, 9954− 9960.
(40) Patra, M.; Karttunen, M. Systematic Comparison of Force Fields for Microscopic Simulations of Nacl in Aqueous Solutions: Diffusion,
Free Energy of Hydration, and Structural Properties. J. Comput. Chem. 2004, 25, 678−689.
(41) Miyamoto, S.; Kollman, P. A. Settle: An Analytical Version of the Shake and Rattle Algorithm for Rigid Water Models. J. Comput. Chem. 1992, 13, 952−962.
(42) Hess, B.; Kutzner, C.; Van Der Spoel, D.; Lindahl, E. Gromacs 4: Algorithms for Highly Efficient, Load-Balanced, and Scalable Molecular Simulation. J. Chem. Theory Comput. 2008, 4, 435−447.
(43) Plimpton, S. Fast Parallel Algorithms for Short-Range Molecular Dynamics. J. Comput. Phys. 1995, 117, 1−19.
(44) Yeh, I.-C.; Berkowitz, M. L. Ewald Summation for Systems with Slab Geometry. J. Chem. Phys. 1999, 111, 3155−3162.
(45) Plimpton, S.; Pollock, R.; Stevens, M. Particle-Mesh Ewald and rRespa for Parallel Molecular Dynamics Simulations, Proceedings of the Eighth SIAM Conference on Parallel Processing for Scientific Computing; 1997.
(46) Kannam, S. K.; Todd, B.; Hansen, J. S.; Daivis, P. J. Slip Flow in Graphene Nanochannels. J. Chem. Phys. 2011, 135, 144701.
(47) Sofos, F.; Karakasidis, T.; Liakopoulos, A. Transport Properties of Liquid Argon in Krypton Nanochannels: Anisotropy and Non-Homogeneity Introduced by the Solid Walls. Int. J. Heat Mass Transfer 2009, 52, 735−743.
(48) Siboulet, B.; Hocine, S.; Hartkamp, R.; Dufrêche, J. Scrutinizing Electro-Osmosis and Surface Conductivity with Molecular Dynamics. J. Phys. Chem. C 2017, 121, 6756−6769.
(49) Ghorbanian, J.; Beskok, A. Scale Effects in Nano-Channel Liquid Flows. Microfluid. Nanofluid. 2016, 20, 121.
(50) Celebi, A. T.; Barisik, M.; Beskok, A. Surface Charge-Dependent Transport of Water in Graphene Nano-Channels. Microfluid. Nanofluid. 2018, 22, 7.
(51) Celebi, A. T.; Barisik, M.; Beskok, A. Electric Field Controlled Transport of Water in Graphene Nano-Channels. J. Chem. Phys. 2017, 147, 164311.
(52) Hartkamp, R.; Biance, A.-L.; Fu, L.; Dufrêche, J.-F.; Bonhomme, O.; Joly, L. Measuring Surface Charge: Why Experimental Character-ization and Molecular Modeling Should Be Coupled. Curr. Opin. Colloid Interface Sci. 2018, 37, 101.
(53) Yeh, L.-H.; Xue, S.; Joo, S. W.; Qian, S.; Hsu, J.-P. Field Effect Control of Surface Charge Property and Electroosmotic Flow in Nanofluidics. J. Phys. Chem. C 2012, 116, 4209−4216.
(54) Behrens, S. H.; Grier, D. G. The Charge of Glass and Silica Surfaces. J. Chem. Phys. 2001, 115, 6716−6721.
(55) Rezaei, M.; Azimian, A. R.; Pishevar, A. R. Surface Charge-Dependent Hydrodynamic Properties of an Electroosmotic Slip Flow. Phys. Chem. Chem. Phys. 2018, 20, 30365−30375.
(56) Ramos-Alvarado, B.; Kumar, S.; Peterson, G. Hydrodynamic Slip Length as a Surface Property. Phys. Rev. E: Stat. Phys., Plasmas, Fluids, Relat. Interdiscip. Top. 2016, 93, 023101.
(57) Celebi, A. Molecular Dynamics Studies on Nanoscale Confined Liquids. Thesis, Southern Methodist University, Dallas, TX, 2018.
(58) Bakli, C.; Chakraborty, S. Effect of Presence of Salt on the Dynamics of Water in Uncharged Nanochannels. J. Chem. Phys. 2013, 138, 054504.