Peripheral Adropin Application Regulates Nutritional Behavior and Fat
Tissue-mediated Energy Metabolism
Ersen ERASLAN1*, Tuncer NACAR2, Ayhan TANYELİ2, Mustafa Can GÜLER2, Elif POLAT3, Ali Sefa
MENDİL4, Elif POLAT5 and Mustafa ÖZKARACA6
1* Yozgat Bozok University, Faculty of Medicine, Department of Physiology, Yozgat, Turkey
2 Atatürk University, Faculty of Medicine, Department of Physiology, Erzurum, Turkey
[email protected] [email protected] [email protected]
3Atatürk University, Faculty of Medicine, Department of Biochemistry, Erzurum, Turkey
4 Erciyes University, Faculty of Veterinary Medicine, Department of Pathology, Kayseri, Turkey
5Namık Kemal University, Faculty of Medicine, Department of Histology and Embryology, Tekirdağ, Turkey
6 Atatürk University, Faculty of Veterinary Medicine, Department of Pathology, Erzurum, Turkey
Abstract
Adropin is a peptide hormone that is involved in food and energy homeostasis and has many metabolic roles. Although previous studies attempted to explain the relation between adropin and nutritional behavior, there is no strong evidence. In the present study, the effects of peripheral adropin administration on various signals related to
Keywords: Adropin, Food intake, Feeding
behaviour, Hypothalamus
Received:17.06.2020 Accepted:20.06.2020 Published:24.06.2020
*Corresponding author:Ersen ERASLAN PhD
Department of Physiology, Faculty of Medicine, Yozgat Bozok University, Yozgat 66900, Turkey
E-mail: [email protected]
Cite this article as:E. Eraslan et.al., Peripheral Adropin
Application Regulates Nutritional Behavior and Fat Tissue-mediated Energy Metabolism, Eastern Anatolian Journal of
Science, Vol. 6, Issue 1, 35-45,2020.
nutritional behavior were investigated in rats at doses of 4 μg/kg and 40 μg/kg by using biochemical and histopathological analyses.
It was shown that adropin reduces feed and water consumption in rats. It was also shown that these effects occur through various neuron groups in the central area by affecting many peripheral signals. Adropin modulates many signals contributing to nutritional behavior.
1. Introduction
The hypothalamus has critical roles in regulating many homeostatic processes like nutrition, thermoregulation, energy use and reproduction (Elmquist, Elias, & Saper, 1999; Hall et al., 2012). The Arcuate Nucleus (ARC), paraventricular nucleus (PVN), and different nuclei that include ventromedial and dorsomedial hypothalamus and hypothalamic area share neuronal interconnections and maintain body homeostasis
together (Schwartz, Woods, Porte, Seeley, & Baskin, 2000). ARC neurons are regulated with metabolic peripheral signals, which contain hormones and gastrointestinal peptides [e.g. leptin, adiponectin, glucagon-like peptide-1 (GLP-1) and thyroid hormones (Krashes et al., 2014; Rohner-Jeanrenaud & Nogueiras, 2015; Schwartz et al., 2000). ARC neurons produce orexigenic neuropeptides like agouti-related peptide (AgRP) and neuropeptide Y (NPY), and anorexigenic neuropeptides like proopiomelanocortin (POMC) and cocaine and amphetamine-related transcripts (CART). These neuropeptide signals are transmitted to the melancholine neurons in other parts of the hypothalamus where they are integrated with information coming from the rising fibers of the nucleus tractus solitarius (NTS) (Kim, Leyva, & Diano, 2014). These neuron groups are involved in the protection of the homeostatic system.
Adropin (Adr) is a peptide hormone consisting of 76 amino acids that are encoded by the gene (Enho) that is associated with the energy homeostasis organized by the diet. This peptide is expressed in many tissues particularly in the liver and the brain. Adr plays roles in maintaining the energy homeostasis and insulin resistance (Aydin et al., 2013; Kumar et al., 2008). The relations between Adr and obesity were analyzed in animal and human studies. It was been determined that Adr is a hormone that fights fat tissue, brings positive contributions to food intake and insulin resistance (Akcilar et al., 2016; Kumar et al., 2008; Sayin, Tokgoz, & Arslan, 2014) and has relations with cardiovascular diseases (Altamimi et al., 2019; Wu, Fang, Yuan, Xiong, & Chen, 2019).
In this study, the effects of Adr peptide on adipose tissue with peripheral and central signals controlling the feeding behavior were investigated.
2. Material And Methods
2.1 Ethical Consideration and the Animals
The permission for all applications to rats was obtained from the Local Ethics Committee of Atatürk University, Experimental Animals (Protocol no: 30.06.2017/65). In the present study, a total of 40 Wistar albino male rats with average weights of 304 ± 11 g were used. The animals were divided into four groups to include the closest to each other in terms of body weight averages as the Control, Sham, 4 μg/kg Adr, and 40 μg/kg Adr groups (n=10). The animals were kept at 21±1°C in a light/dark cycle for 12 h during the experiment. The rats were fed with standard rat feed ad libitum and drank regular tap water. The Adr peptide was obtained from Phoenix Pharmaceuticals (CA, USA), dissolved in pure water, and then injected intraperitoneally to rats.
After 10 days of the injections, the animals were decapitated, and their blood, hypothalamus, liver, thyroid gland, white adipose tissue (WAT) and brown adipose tissue (BAT) were collected. The blood samples were centrifuged at 5000 rpm for 10 minutes, the serums were separated, and stored at -80°C until the analyses with ELISA kits. The hypothalamus, liver, thyroid gland, white and brown fat tissue samples were stored at 10 % formaldehyde for histopathological studies.
2.2 Biochemical Analyses
The ELISA kits used in the study were supplied by Elabscience (E-EL) (Wuhan, China). Adiponectin (E-EL-R0329), Ghrelin (E-EL-R0842), Leptin (E-EL-R0582), Insulin (E-EL-R2466), Peptide YY (PYY) R0720), GLP-1 (E-EL-R0059), oxyntomodulin (OXM) (E-EL-R1130), Triiodothyronine (T3) (E-EL-R1097), Thyroxin (T4) (E-EL-R0390) and Thyroid-stimulating Hormone (TSH) (E-EL-R0976) were analyzed in line with the usage protocol in the ELISA kits in the ELISA Device (BioTEK Powerwawe XS Winooski, UK).
EAJS, Vol. VI Issue I | 37 The TG, LDL, HDL, cholesterol and
glucose levels were determined with Cobas Integra 1600 Fully-Automated Biochemistry Analyzer (Roche Diagnostics, Mannheim, Germany) by using the Photometric Method.
2.3 Histopathological Procedures
The hypothalamus, liver, thyroid, and the white and brown fat tissue samples that were taken from the animals were taken to 10% formalin solution for 72 hours for fixation, and were then subjected to tissue monitoring procedures. For this purpose, the tissue samples were taped according to groups, and the monitoring process was started by placing them on an automatic monitoring device.
The rats were sacrificed and the hypothalamus and white and brown adipose tissues were detected in 10% neutral formalin solution. The tissues were processed through routine alcohol-xylol, and taken into paraffin blocks. The 5-μm sections that were taken into polylysine slides were passed through xylol and alcohol series, and after washing with PBS, endogenous peroxidase inactivation was achieved by keeping them in 3% H2O2 for 10 minutes. The sections were then treated
at antigen retrieval solution for 2x5 mins in 500 watts to reveal the antigen in the tissues. The tissues that were washed with PBS were then left for incubation at room temperature for 20 mins with AgRP (sc-517457), CART (sc-293241), NPY, POMC (sc-20148) and uncoupling protein 1(UCP1) (sc-6529) primary antibodies (SantaCruz (Sc) Texas, USA ). Secondarily, the LSAB2 kit (Dako, K0679) was done as instructed by the company. DAB (3,3′-Diaminobenzidine) was used as chromogen. After counter-staining with Mayer’s Hematoxylin, they were closed with an entellan, and their images were photographed in the same light setting under the light microscope and then evaluated.
2.4 Statistical Analysis
Statistical analysis of the data was made with the IBM SPSS Statistics 20v. (Chicago, USA) program. The normality of the data was tested by using the Kolmogorov-Smirnov Test. Parametric values were determined with the One-Way Variance Analysis with Bonferroni Correction, nonparametric values were determined with the Kruskal Wallis, and the group that created the difference was determined with the Mann Whitney U-test (p<0.05). The values were given as mean ± standart error mean (SEM).
3. Results
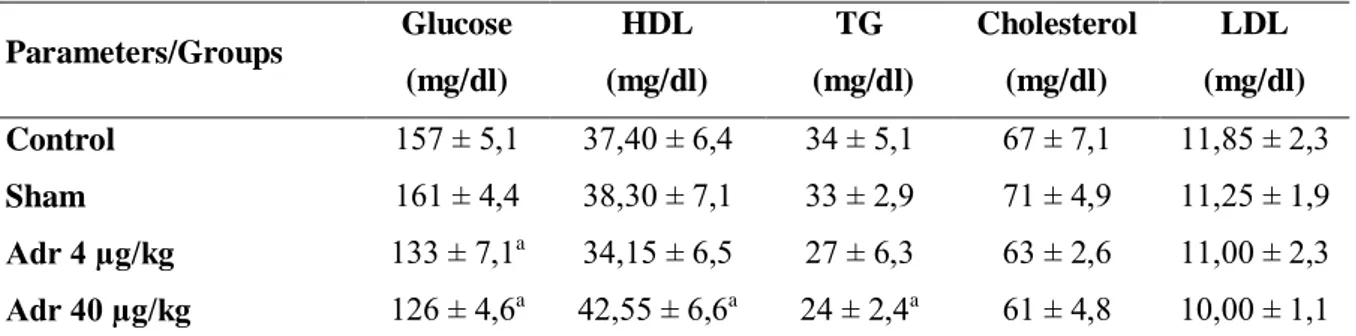
3.1 Metabolic parameters
The biochemical results are given in Table 1. Although Adr 4 μg/kg administration only caused changes in glucose levels, Adr 40 μg/kg administration decreased glucose and TG levels, and increased HDL levels. It was found that Adr administrations had no effect on cholesterol and LDL levels.
3.2 Food and Water Intake, and Body Weight
The change in daily body weight changes with Adr administration at different doses (Figure 1a), feed consumption (Figure 1b), and total water consumption (Figure 1c) were evaluated, and are given in Figure 1. The changes in feed consumption and body weight showed their effects as of the 6th
day in the group to which Adr 40 µg/kg was administered, and the administration decreased the weight gain and feed consumption as of the 7th day
in the Adr 4 µg/kg group. In addition, when the total amount of water consumed by animals was evaluated on the last day of the study, it was determined that the Adr treatment decreased water consumption.
Figure 1. The effects of Adr on nutritional behavior.
the 6th day (b) similarly, food intake decreased daily
on the 6th day (c) water consumption decreased in
Adr groups *p<0.05 compared to the control group (mean ± SEM, n=10).
3.3 Hormonal Parameters
The levels of adiponectin and leptin, which are the fat tissue hormones, decreased. The gastrointestinal tract hormones, ghrelin and GLP-1 levels, increased; while PYY levels decreased. The OXM levels did not change. There was a slight decrease in insulin levels; however, this change was not significant. Although the TSH and T4 levels remained unchanged, it was determined that there was an increase in T3 levels.
Figure 2. The effects of 10-day intraperitoneal Adr
administratin on peripheral signals. (a and b) fat tissue hormones, (c) insulin, (d, e, f and g) gastrointestinal system hormones and (h, i and j) TSH and thyroid hormones. *p<0.05 compared to the
control group (mean ± SEM, n=10).
3.4 Histological Evaluation
The liver and thyroid tissues were evaluated with hematoxylin eosin, and in the group to which 40 μg/kg Adr was administrated, an increase was detected in the number of double-nuclei hepatocytes and hyperplasia in thyroid follicles (As shown in Figure 3).
Figure 3. A photomicrograph of hematoxylin and
eosin sections in thyroid gland and liver tissue. (A) control group, (B) sham group, (C) 4 μg/kg Adr and (D) 40 μg/kg Adr groups.
3.5 Immunohistochemical Evaluation
Orexigenic NPY, AgRP and anorexigenic POMC and CART neurons in the ARC (Figure 4a) and UCP 1 expressions, WAT and BAT (Figure 4b)
were evaluated. The Adr administration increased AGRP and NPY expression. POMC expressions decreased and no changes were determined in CART expression. Although Adr administration did not cause any changes in WAT, 40 μg/kg Adr administration raised the expression of UCP 1 in BAT. Images are given in Figure 4, and scoring is given in Figure 5.
Figure 4a and 4b. The orexigenic and anorexigenic
neurons in the ARC and UCP 1 in adipose tissues immunoreactivity. (A) control group, (B) sham group, (C) 4 μg/kg Adr and (D) 40 μg/kg Adr groups.
Figure 5. It represents their density in percentage of
IHC obtained from histological images of ARC and fat tissues. (a) AgRP, (b) NPY, (c) CART, (d) POMC, (e) WAT and (f) BAT. *p<0.05 compared to
control group.
4. Discussion
In the present study, the influence of Adr on nutritional behaviour and its effects on the central nervous system and some peripheral signals that are involved in regulating energy homeostasis were explained. Our objectives were to explain how Adr administration affects UCP 1 expressions in fat tissue hormones, thyroid hormones, gastrointestinal hormones, various neuron groups in the ARC nucleus and fat tissues. It is necessary to apply the Adr to the central or peripheral areas to evaluate these variables. As a matter of fact, some evidence (the molecular size and lipophobic structure of Adr) show that the Adr cannot cross the blood brain barrier (BBB). However, we administered peripheral Adr, considering that the Adr affects various peripheral signals and will pass the weakened BBB around the ARC nucleus. Spencer et al. conducted a study and reported that the central administration of Adr caused depolarization in hypothalamic nuclei (Loewen & Ferguson, 2017). These data show us
EAJS, Vol. VI Issue I | 39 that Adr can play a number of roles on hypothalamic
neuron groups directly or via peripheral signal exchange.
The triglycerides (TGs) in circulation represent the main lipid source for metabolically active tissues like the heart and the muscles (Ruge et al., 2009). The accumulation of TGs causes the formation of fat tissue. The two important hormones of fat tissue, i.e. leptin and adiponectin, play roles in blood TG modulation. Both hormones decrease lipogenesis in various tissues and increase triglyceride hydrolysis by increasing fat oxidation (Minokoshi et al., 2002; Stefan et al., 2002; William, Ceddia, & Curi, 2002). The levels of leptin and insulin, which are among the best known and studied environmental signals, are associated with total body fat mass. Leptin, which is an adipokine, is secreted positively by WAT with the total amount of body fat. Insulin is secreted by pancreatic β cells, which are linked to blood glucose level in the short term, and to the adiposity level in the long term. Both peripheral signals show strong anorexic effects (Woods & Seeley, 2000). It inhibits the AgRP and NPY neurons in the ARC nucleus by performing the effects of both molecules in central area on receptors (Konner et al., 2007; Schwartz et al., 1992). Although these results contradict the results of some previous studies, it was reported that Adr causes fat tissue oxidation and decreases tissue fat mass. In the present study, it was shown that this is the result of the oxidation of adiponectin and leptin levels.
BAT stores more energy in TGs, and contributes to thermogenesis by burning the lipids via UCP 1 particularly in BAT. In this way, it also reduces plasma levels of TGs and glucose by fighting against hypothermia and obesity (Bartelt et al., 2011; Geerling et al., 2014). Based on the environmental effects of Adr on glucose and lipid homeostasis, it is possible that Adr affects TRH-secreting neuroendocrine neurons, because TRH plays
important roles in energy homeostasis (Lechan & Fekete, 2006). The GPR19-mediated response of the Adr administered to PVN might cause TRH modulation. This increase in TRH may be the main reason for the suppression of water intake as we determined (Ishihara, Mori, Kobayashi, & Kobayashi, 1985). It was reported in similar studies that Adr suppresses water intake (Stein, Yosten, & Samson, 2016). In addition, thyroid hormones [i.e. T4 and T3] control important biological processes including metabolism and energy balance (Lopez, Alvarez, Nogueiras, & Dieguez, 2013). In the study that was conducted by Crespo et al., it was found that central T3 injection causes UCP1 expression in BAT in addition to its effects on the body weight and nutrient intake (Alvarez-Crespo et al., 2016). In the first study that was conducted by Kumar et al. describing the Adr, it was reported that there were no changes in UCP1 expression in BAT in the diet-induced obesity model in transgenic mice with Adr overexpression, which was associated with leptin levels (Kumar et al., 2008). Our results show that UCP1 expressions do not show any changes in WAT, but increase in BAT, which is because of the effects of possible thyroid hormones.
Gastrointestinal tract hormones play roles in nutritional behavior control. The effects of these hormones occur through various neuron groups in the ARC. At the same time, it was determined that some of these hormones are expressed in various parts of the brain, including the hypothalamus. Although the ghrelin hormone investigated in the present study increases appetite, PYY, GLP-1 and OXM suppress food intake (Dakin et al., 2004; Date et al., 2000; Date et al., 2002; Halatchev & Cone, 2005). Ghrelin shows orexigenic effects on nutrition by stimulating NPY/AgRP-expressing neurons in ARC nucleus. The PYY, GLP-1 and OXM hormones show their effects by changing the expressions of various neuron groups in the ARC
nucleus like AgRP/NPY and POMC/CART (Batterham et al., 2002; Cohen et al., 2003; Dakin et al., 2004; Halatchev & Cone, 2005).
The results of the present study show that Adr is related directly to food intake, regulates central and peripheral signals that control nutritional behavior, and also contributes to UCP1-mediated energy homeostasis.
5. Acknowledgement
This study was supported by the Department of Scientific Research Projects of Atatürk University (Project no: 2015/281 and 2015/39). The current study was obtained from the thesis. A part of the thesis was presented as an oral presentation at the FEPS 2017 (Vienna) congress.
References
AKCILAR, R., KOCAK, F. E., SIMSEK, H., AKCILAR, A., BAYAT, Z., ECE, E., & KOKDASGIL, H. (2016). Antidiabetic and hypolipidemic effects of adropinin streoptozotocin-induced type 2 diabetic rats. Bratisl Lek Listy, 117(2), 100-105. ALTAMIMI, T. R., GAO, S., KARWI, Q. G.,
FUKUSHIMA, A., RAWAT, S., WAGG, C. S., . . . LOPASCHUK, G. D. (2019). Adropin regulates cardiac energy metabolism and improves cardiac function and efficiency. Metabolism-Clinical and
Experimental, 98, 37-48.
ALVAREZ-CRESPO, M., CSIKASZ, R. I., MARTINEZ-SANCHEZ, N., DIEGUEZ, C., CANNON, B., NEDERGAARD, J., & LOPEZ, M. (2016). Essential role of UCP1 modulating the central effects of thyroid hormones on energy balance. Molecular
Metabolism, 5(4), 271-282.
AYDIN, S., KULOGLU, T., AYDIN, S., EREN, M. N., YILMAZ, M., KALAYCI, M., . . . KENDIR, Y. (2013). Expression of adropin in rat brain, cerebellum, kidneys, heart, liver, and pancreas in streptozotocin-induced diabetes. Molecular and Cellular
Biochemistry, 380(1-2), 73-81.
BARTELT, A., BRUNS, O. T., REIMER, R., HOHENBERG, H., ITTRICH, H., PELDSCHUS, K., . . . HEEREN, J. (2011). Brown adipose tissue activity controls triglyceride clearance. Nat Med, 17(2), 200-205. doi:10.1038/nm.2297
BATTERHAM, R. L., COWLEY, M. A., SMALL, C. J., HERZOG, H., COHEN, M. A., DAKIN, C. L., . . . BLOOM, S. R. (2002). Gut hormone PYY3-36 physiologically inhibits food intake. Nature, 418(6898), 650-654.
COHEN, M. A., ELLIS, S. M., LE ROUX, C. W., BATTERHAM, R. L., PARK, A., PATTERSON, M., . . . BLOOM, S. R. (2003). Oxyntomodulin suppresses appetite and reduces food intake in humans. J Clin
Endocrinol Metab, 88(10), 4696-4701.
DAKIN, C. L., SMALL, C. J., BATTERHAM, R. L., NEARY, N. M., COHEN, M. A., PATTERSON, M., . . . BLOOM, S. R. (2004). Peripheral oxyntomodulin reduces food intake and body weight gain in rats.
Endocrinology, 145(6), 2687-2695.
DATE, Y., KOJIMA, M., HOSODA, H., SAWAGUCHI, A., MONDAL, M. S., SUGANUMA, T., . . . NAKAZATO, M. (2000). Ghrelin, a novel growth hormone-releasing acylated peptide, is synthesized in a distinct endocrine cell type in the gastrointestinal tracts of rats and humans.
Endocrinology, 141(11), 4255-4261.
DATE, Y., NAKAZATO, M., HASHIGUCHI, S., DEZAKI, K., MONDAL, M. S., HOSODA, H., . . . MATSUKURA, S. (2002). Ghrelin is present in pancreatic alpha-cells of humans and rats and stimulates insulin secretion. Diabetes,
51(1), 124-129.
ELMQUIST, J. K., ELIAS, C. F., & SAPER, C. B. (1999). From lesions to leptin: hypothalamic control of food intake and body weight. Neuron, 22(2), 221-232. GEERLING, J. J., BOON, M. R., VAN DER ZON,
G. C., VAN DEN BERG, S. A. A., VAN DEN HOEK, A. M., LOMBES, M., . . . GUIGAS, B. (2014). Metformin Lowers Plasma Triglycerides by Promoting VLDL-Triglyceride Clearance by Brown Adipose Tissue in Mice. Diabetes, 63(3), 880-891. HALATCHEV, I. G., & CONE, R. D. (2005).
Peripheral administration of PYY3-36 produces conditioned taste aversion in mice. Cell Metabolism, 1(3), 159-168. HALL, K. D., HEYMSFIELD, S. B., KEMNITZ, J.
W., KLEIN, S., SCHOELLER, D. A., & SPEAKMAN, J. R. (2012). Energy balance and its components: implications for body weight regulation. Am J Clin Nutr, 95(4), 989-994.
ISHIHARA, H., MORI, M., KOBAYASHI, I., & KOBAYASHI, S. (1985). Intraventricular administration of cyclo(His-Pro), a metabolite of thyrotropin-releasing hormone (TRH), decreases water intake in
EAJS, Vol. VI Issue I | 41 the rat. Proc Soc Exp Biol Med, 178(4),
623-628.
KIM, J. D., LEYVA, S., & DIANO, S. (2014). Hormonal regulation of the hypothalamic melanocortin system. Front Physiol, 5, 480. KONNER, A. C., JANOSCHEK, R., PLUM, L.,
JORDAN, S. D., ROTHER, E., MA, X., . . . BRUNING, J. C. (2007). Insulin action in AgRP-expressing neurons is required for suppression of hepatic glucose production.
Cell Metab, 5(6), 438-449.
KRASHES, M. J., SHAH, B. P., MADARA, J. C., OLSON, D. P., STROCHLIC, D. E., GARFIELD, A. S., . . . LOWELL, B. B. (2014). An excitatory paraventricular nucleus to AgRP neuron circuit that drives hunger. Nature, 507(7491), 238-242. KUMAR, K. G., TREVASKIS, J. L., LAM, D. D.,
SUTTON, G. M., KOZA, R. A., CHOULJENKO, V. N., . . . BUTLER, A. A. (2008). Identification of adropin as a secreted factor linking dietary macronutrient intake with energy homeostasis and lipid metabolism. Cell
Metab, 8(6), 468-481.
LECHAN, R. M., & FEKETE, C. (2006). The TRH neuron: a hypothalamic integrator of energy metabolism. Prog Brain Res, 153, 209-235.
LOEWEN, S. P., & FERGUSON, A. V. (2017). Adropin acts in the rat paraventricular nucleus to influence neuronal excitability.
Am J Physiol Regul Integr Comp Physiol, 312(4), R511-R519.
LOPEZ, M., ALVAREZ, C. V., NOGUEIRAS, R., & DIEGUEZ, C. (2013). Energy balance regulation by thyroid hormones at central level. Trends in Molecular Medicine, 19(7), 418-427.
MINOKOSHI, Y., KIM, Y. B., PERONI, O. D., FRYER, L. G., MULLER, C., CARLING, D., & KAHN, B. B. (2002). Leptin stimulates fatty-acid oxidation by activating AMP-activated protein kinase.
Nature, 415(6869), 339-343.
ROHNER-JEANRENAUD, F., & NOGUEIRAS, R. (2015). Endocrine control of energy homeostasis. Mol Cell Endocrinol, 418 Pt
1, 1-2.
RUGE, T., HODSON, L., CHEESEMAN, J., DENNIS, A. L., FIELDING, B. A., HUMPHREYS, S. M., . . . KARPE, F. (2009). Fasted to fed trafficking of Fatty acids in human adipose tissue reveals a novel regulatory step for enhanced fat storage. J Clin Endocrinol Metab, 94(5), 1781-1788.
SAYIN, O., TOKGOZ, Y., & ARSLAN, N. (2014). Investigation of adropin and leptin levels in pediatric obesity-related nonalcoholic fatty
liver disease. J Pediatr Endocrinol Metab,
27(5-6), 479-484.
SCHWARTZ, M. W., SIPOLS, A. J., MARKS, J. L., SANACORA, G., WHITE, J. D., SCHEURINK, A., . . . et al. (1992). Inhibition of hypothalamic neuropeptide Y gene expression by insulin. Endocrinology,
130(6), 3608-3616.
SCHWARTZ, M. W., WOODS, S. C., PORTE, D., JR., SEELEY, R. J., & BASKIN, D. G. (2000). Central nervous system control of food intake. Nature, 404(6778), 661-671. STEFAN, N., VOZAROVA, B., FUNAHASHI, T.,
MATSUZAWA, Y., WEYER, C., LINDSAY, R. S., . . . TATARANNI, P. A. (2002). Plasma adiponectin concentration is associated with skeletal muscle insulin receptor tyrosine phosphorylation, and low plasma concentration precedes a decrease in whole-body insulin sensitivity in humans. Diabetes, 51(6), 1884-1888. STEIN, L. M., YOSTEN, G. L., & SAMSON, W. K.
(2016). Adropin acts in brain to inhibit water drinking: potential interaction with the orphan G protein-coupled receptor, GPR19. Am J Physiol Regul Integr Comp
Physiol, 310(6), R476-480.
WILLIAM, W. N., JR., CEDDIA, R. B., & CURI, R. (2002). Leptin controls the fate of fatty acids in isolated rat white adipocytes. J
Endocrinol, 175(3), 735-744.
WOODS, S. C., & SEELEY, R. J. (2000). Adiposity signals and the control of energy homeostasis. Nutrition, 16(10), 894-902. WU, L., FANG, J., YUAN, X., XIONG, C., &
CHEN, L. (2019). Adropin reduces hypoxia/reoxygenation-induced
myocardial injury via the reperfusion injury salvage kinase pathway. Experimental and
Table 1. Metabolic parameters. Parameters/Groups Glucose (mg/dl) HDL (mg/dl) TG (mg/dl) Cholesterol (mg/dl) LDL (mg/dl) Control 157 ± 5,1 37,40 ± 6,4 34 ± 5,1 67 ± 7,1 11,85 ± 2,3 Sham 161 ± 4,4 38,30 ± 7,1 33 ± 2,9 71 ± 4,9 11,25 ± 1,9 Adr 4 µg/kg 133 ± 7,1a 34,15 ± 6,5 27 ± 6,3 63 ± 2,6 11,00 ± 2,3 Adr 40 µg/kg 126 ± 4,6a 42,55 ± 6,6a 24 ± 2,4a 61 ± 4,8 10,00 ± 1,1 HDL: High Density Lipoprotein, LDL; Low Density Lipoprotein, TG; Triglyceride. ap < 0.05 versus control group.
EAJS, Vol. VI Issue I | 43
Figure 2
Figure 4.a
EAJS, Vol. VI Issue I | 45