Implementation of graphene multilayer electrodes in quantum dot
light-emitting devices
Svenja Wolff1,2• Dennis Jansen1,2•Hendrik Terlinden1,2•Yusuf Kelestemur3• Wolfgang Mertin2•Hilmi Volkan Demir3,4•Gerd Bacher2•Ekaterina Nannen1,2
Received: 7 April 2015 / Accepted: 15 June 2015 / Published online: 30 June 2015 Ó Springer-Verlag Berlin Heidelberg 2015
Abstract Graphene is a highly attractive candidate for implementation as electrodes in next-generation large-area optoelectronic devices thanks to its high electrical con-ductivity and high optical transparency. In this study, we show all-solution-processed quantum dot-based light-emitting devices (QD-LEDs) using graphene mono- and multilayers as transparent electrodes. Here, the effect of the number of graphene layers (up to three) on the QD-LEDs performance was studied. While the implementation of a second graphene layer was found to reduce the turn-on voltage from 2.6 to 1.8 V, a third graphene layer was observed to increase the turn-on voltage again, which is attributed to an increased roughness of the graphene layer stack.
1 Introduction
Currently, indium tin oxide (ITO) is mainly used as a transparent electrode for large-area light-emitting devices (LEDs), like organic LEDs (OLEDs) [1] or quantum dot LEDs (QD-LEDs) [2], [3], since it combines high trans-parency (*85 %) [4] and low sheet resistance (15 X/h) [5]. On the other hand, ITO as an electrode material suffers from the highly limited resources of indium and from cost intensive and energy consuming synthesis and deposition techniques. With regard to flexible device applications [6], ITO is not the best choice because it often gets brittle while bending [7]. Therefore, an alternative electrode material with high transparency, conductivity and mechanical strength is strongly required, especially when targeting the market of disposable electronics.
Graphene, which is a monolayer of carbon atoms, is a highly attractive material for device electrodes in future large-area LEDs [8, 9] due to its high conductivity [10], mechanical strength [11] and transparency. The trans-parency of monolayer graphene (*97.4 %) [12] in the visible spectral range is obviously superior compared to standard ITO (*85 %) [4] and underlines the potential benefits of graphene electrodes. Currently, the sheet resis-tance of pristine graphene-based electrodes is in general higher compared to ITO, but it can be modified easily with a layer-by-layer stacking approach, whereby the sheet resis-tance decreases with increasing number of layers [12]. Although at the same time the transmission of graphene will be slightly reduced, it is still higher compared to ITO [13]. Up to now, graphene has been studied as a transparent electrode for various advanced optoelectronic device applications including OLEDs [9], [14–16], solar cells [17], liquid crystal devices [18] and light-emitting electrochem-ical cells (LECs) [19, 20]. Specifically, Han et al. [9]
& Svenja Wolff
1 Research Group ‘‘Solid State Lighting’’,
NanoEnergieTechnikZentrum, University Duisburg-Essen, 47057 Duisburg, Germany
2 Werkstoffe der Elektrotechnik and CENIDE, Universita¨t Duisburg-Essen, 47057 Duisburg, Germany
3 Department of Electrical and Electronics Engineering, Department of Physics, UNAM – Institute of Materials Science and Nanotechnology, Bilkent University, Ankara 06800, Turkey
4 Luminous! Center of Excellence for Semiconductor Lighting and Displays, School of Electrical and Electronic
Engineering, School of Physical and Materials Sciences, Nanyang Technological University, Singapore 639798, Singapore
analyzed the impact of the number of graphene layers on the performance of OLEDs. Thereby, they reported that the turn-on voltage of the devices decreased with increasing the number of the graphene layers, which shows strong corre-lation with the decreasing sheet resistance.
QD-LEDs are highly promising candidates for next-generation display and lighting applications. With the precisely tunable and narrower emission bandwidth of colloidal quantum dots (QDs), QD-LEDs exhibit excellent color purity, which outperforms the performance of OLEDs [2, 3, 21]. In addition, when compared to their organic counterpart, QDs have higher quantum yield with enhanced chemical stability, which is highly desired for better device performance. With all of these appealing properties, QD-LEDs have been studied extensively with various device architectures and different electrode mate-rials. However, graphene-based QD-LEDs have been rarely studied until now, restricted to either graphene monolayer or multilayer electrodes [22–24]. Thereby, turn-on voltages clearly exceeded the typical values of about 2 V for QD-LEDs with ITO electrodes [25–27].
Here, the implementation of transparent single- and multilayer graphene electrodes in QD-LEDs with an active area of 7 mm2and turn-on voltages below 2 V is demon-strated. Precisely controlling the number of graphene lay-ers, the effect of the number of the graphene layers on the overall LED performance and specifically on the turn-on voltage is studied.
2 Experimental
Chemical vapor deposition (CVD) graphene grown on a 25-lm thin copper foil from Graphenea company was used to fabricate the transparent electrodes. In the first step, a monolayer of graphene was transferred from the copper foil onto glass substrates in a solution-based approach at room temperature and under ambient air conditions. Polymethyl-methacrylate (PMMA, 950 K, 4 %) was spin-coated on top of the graphene for protection and for reducing the wrinkle formation during the transfer process [28]. After a baking process (150°C, 5 min), the copper foil was removed with an iron (III) chloride [29,30] etching step. After the etching process, the PMMA with graphene was transferred onto a transparent glass substrate and the PMMA was removed with hot acetone. Multilayer graphene electrodes were fab-ricated by repeating the same transfer process, resulting in layers with an area of 12 9 12 mm2. The transmittance of the resulting graphene layers was measured by a Shimadzu UV-2550 spectrometer in the visible spectral range. The sheet resistance of the resulting graphene layers was obtained by the transfer length measurement method with 4.2 mm 9 0.6 mm sized 10 nm-Ti/200 nm-Au electrodes
with varying spacing of 0.4, 0.9, 1.4 and 1.9 mm between them. The roughness of the graphene layers was measured by a noncontact confocal surface profile measurement system (Nanofocus lsurf custom) to avoid the damage of the elec-trodes and measurement artifacts.
For the device fabrication, we used the electrodes intro-duced above as an anode for QD-LEDs in a well-known device architecture (see Fig.4). A Ti/Au (10/200 nm) con-tact frame, evaporated thermally through a shadow mask, was used to establish a stable contact to the graphene elec-trodes [31]. In the next steps, supporting layers were spin-coated on top of the anodes. We used PEDOT:PSS (poly(3,4-ethylenedioxythiophene) poly(styrenesulfonate) and poly-TPD (poly[N,N’-bis(4-butylphenyl)-N,N-bis(phenyl)-ben-zidine]), which are established supporting layers in QD-LEDs [26]. PEDOT:PSS was spin-coated onto the graphene electrode and baked for 20 min at 150 °C under ambient air conditions to remove the solvent residues. Poly-TPD was spin-coated from a 1.5 % w/w chlorobenzene solution (So-laris Chem Inc.) on top and dried for 1 h under ambient air conditions to get rid of the solvent.
For the active light-emitting layer, CdSe/CdS core/shell QDs having zinc-blende crystal structure are synthesized with a slightly modified recipe from the literature [32]. Deposition of the active layer is achieved by spin-coating of a highly concentrated solution of CdSe/CdS core/shell QDs dissolved in toluene (25 mg/ml). Owing to their uni-form size distribution, they uni-form a dense and homogeneous layer (*30 nm) on top of the stack of supporting layers. Finally, a 200-nm top aluminum electrode (cathode) was evaporated through a shadow mask resulting in the active device area of 2 mm 9 3.5 mm.
The photoluminescence (PL) of the QD layers was excited by a 405-nm diode laser (PDL 800-D from Pico-quant) and measured by a combination of a spectrometer (iHR320 from Horiba Jobin Yvon) with a nitrogen-cooled CCD camera (Horiba Jobin Yvon). For the device charac-terization, the QD-LEDs were electrically contacted with a Keithley 2601 source meter and driven by a custom-made LabVIEW software. The emission intensity was measured simultaneously by a calibrated Si-photodiode (818-UV from Newport). A CS-2000A (Konica Minolta) spectrora-diometer was used to measure the electroluminescence (EL) spectra. All devices were operated without any encapsula-tion at room temperature and under ambient air condiencapsula-tions.
3 Results and discussion
Figure1a shows the transmittance in the visible spectral range for mono-, bi- and trilayer graphene compared to conventional 150-nm-thick (sputtered) ITO electrodes (15 X/h), used as a reference here. The transmittance of the
graphene electrodes decreases with increasing number of graphene layers. The transmittance of a monolayer at 550 nm is about 97.2 %, which is comparable with a typical literature value of 97.4 % [12] and very high compared to the commercial ITO with 87.4 %. Depositing additional gra-phene layers, a decrease in transmittance is observed. For example, bilayer graphene exhibits a transmittance of 94.0 %, while trilayer graphene shows a transmittance of 91.5 % at 550 nm. These values are also close to the liter-ature values of 95.1 % transparency for bilayer and 92.9 % transparency for trilayer graphene [13]. The inset of Fig.1a shows a photograph of the transferred graphene monolayer electrode with an edge length of 12 mm 9 12 mm.
The sheet resistance of the graphene and ITO electrodes, determined via transfer length measurements, is shown in Fig.1b. It reaches values of 15 X/h for ITO, *922 ± 56 X/h for monolayer graphene and 530 ? 59 X/h for bilayer graphene, and a stack of three layers results in a sheet
resistance of *360 ? 20 X/h. For the transfer length mea-surements, we used Ti/Au contacts which are 4.2 mm 9 0.5 mm in size. These large contacts were chosen to enable the realistic measurement of the sheet resistance for large-area electrodes which are supposed to be implemented in the QD-LED devices.
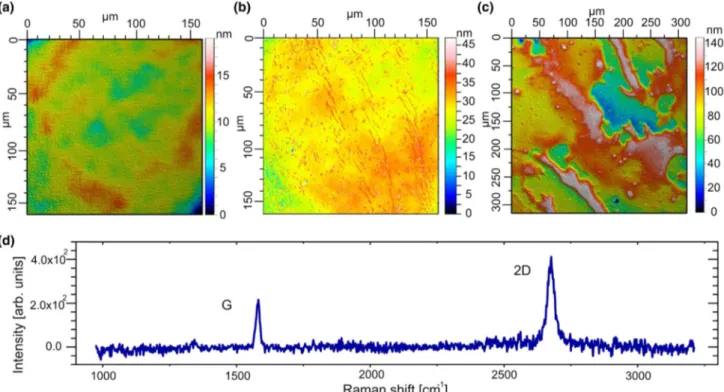
To specify the quality of the graphene electrodes on a large scale, they were studied by a noncontact confocal 3D surface profiler to exclude any possible damage to the graphene and reliably compare it to ITO morphology. Figure2a shows exemplary typical confocal height image of the glass substrate with a low roughness (Sa = 0.5 nm), a transferred graphene monolayer (Fig.2b) and an Al-electrode of a QD-LED with a graphene monolayer. The measurements were taken over 150 and 300 lm2 large area. Figure2b shows an overall closed (no significant cracks), homogeneous and smooth surface, except single wrinkles, formed all over the electrode surface. The arith-metic mean height (Sa) of the transferred graphene monolayer was found to be in average Sa = 1.9 nm, which is higher compared to commercial ITO electrode surface, measured to be in average 0.56 nm, reflecting the impact of the wrinkle formation on the electrode morphology increasing its roughness.
To verify monolayer graphene, a Raman spectrum was taken. Figure2d shows a typical graphene Raman spec-trum [33], [34] including 2D- and G-peak with small FWHMs of 33 cm-1 (2D-peak) and 16 cm-1 (G-peak). The intensity ratio of 2D- to G-peak is 2.1, indicating a good quality of the graphene monolayer [6], [35].
The changes in graphene electrode morphology after stacking of multiple layers on top of each other were fur-ther on monitored by a confocal surface profiler. With the increase in the number of graphene layers, the roughness Sa increased significantly. The bilayer graphene exhibits Sa = 2.7 nm, while for the trilayer graphene electrode we found Sa = 3.8 nm. This increased electrode surface roughness might hinder the homogeneous layer formation during spin-coating steps within the solution-based device fabrication process.
Figure3a shows a schematic of the device structure with graphene-based anode on top of the glass substrate, cov-ered by PEDOT:PSS and poly-TPD. Thereby, PEDOT:PSS is acting as a injection layer and poly-TPD as a hole-transporting layer. It is also known that poly-TDP acts as an electron-blocking layer because of its wide band gap and the position of the valence and the conduction band edge [36]. Spin-coated QD layer acts as an active light-emitting layer, contacted by Al cathode (Fig.3b). We focus on the implementation and functionality of graphene as an electrode and omit any electron transport layers as shown in literature [25], [37] for simplicity.
Fig. 1 aTransmittance of graphene layer stack (one to three layers) compared to ITO as a function of wavelength. The values of the transmittance are taken at 550 nm. The inset shows a large-area (12 9 12 mm2) monolayer graphene electrode marked by black lines on a glass substrate. b Sheet resistance of graphene layer stack (one to three layers) compared to ITO as a function of transmittance
Figure3c shows a schematic of the simplified energy-level diagram. The values for ITO, graphene, PEDOT:PSS, poly-TPD, QDs and Al were taken from Ref. [9,27,38].
Figure4a shows a photograph of the CdSe/CdS core/ shell QDs dissolved in toluene under UV radiation (inset)
and a PL spectrum of the QD layer. The synthesized CdSe/ CdS-QDs exhibit a PL emission peak at a wavelength of 619 nm with a narrow full width at half maximum (FWHM) of 27 nm [39]. In addition, although they have a thick CdS shell (six-monolayer), they preserve their very good quantum yield above 80 % with high stability.
Figure4a shows in addition the normalized EL spectra of all the devices at 7 V operation voltage together with the original PL spectrum of the quantum dots. An EL signal is observed with a peak wavelength of 625 nm and a narrow FWHM of 31 nm for all of the devices. There is no emission observed originating from the poly-TPD, which can be an indication for an efficient charge injection. Also, a typical redshift between PL and EL of QD-LEDs is observed. This might be attributed to, e.g., the presence of strong electric fields during operation [40], energy transfer from small to larger QDs [41], smaller charge injection barriers into larger crystals [40] or local heating [42]. The EL spectra of the graphene-based devices are very similar to the ITO-based reference QD-LED, so no effect of the electrode material on the emission behavior is observed. There is also no significant influence of the number of the graphene layers at the anode on the shape and the energetic position of the emission spectrum.
Figure4b shows the intensity as a function of applied voltage on a double logarithmic scale for the four studied
Fig. 2 Confocal microscope image of a a glass substrate, b a large area of a monolayer graphene electrode with a lot of wrinkles and c a complete QD-LED including Al contact with a monolayer graphene
electrode. In d, a Raman spectrum of a graphene monolayer electrode is shown
Fig. 3 a Schematic of the device structure and b top view. cSchematic of simplified energy-level diagram with ITO or graphene as electrode
device types. The curves represent a mean value of the intensity for a given voltage, averaged over three different measurements. The orange dashed line represents the noise level for the intensity measurements. A distinct difference between the turn-on voltages of the devices with a different number of graphene layers is clearly seen in Fig.4b. The turn-on voltage for the monolayer device (blue line) is ca. 2.6 V, which is higher compared to the ITO reference device (black line) with a turn-on voltage of approximately 1.8–2 V. By using bilayer graphene (green line) as an electrode, the turn-on voltage decreases down to 1.8 V, becoming comparable with the ITO reference device and with state-of-the-art QD-LEDs [25] with ITO electrodes. We attribute the reduced turn-on voltage to the decreased sheet resistance of the bilayer graphene electrode as
compared to the monolayer one, in agreement with data obtained for graphene-based OLEDs [9]. For volt-ages \10 V, the intensity of the bilayer device at a given voltage is higher compared to the ITO-based reference device.
Surprisingly, the turn-on voltage of the trilayer device (red line) increases, despite the decreased sheet resistance of the electrode. Also, the stability of the trilayer devices at elevated voltages was reduced showing fast degradation or even breakdown at voltages above 8 V. For this reason, the measurement range for trilayer devices was reduced from 10 to 8 V to enable multiple measurement runs. In addi-tion, the trilayer device shows significantly lower emission intensity, compared to the bilayer device. Note that this is different than in case of OLEDs, where so far four layers graphene showed the best device performance [9].
A possible reason for this behavior might result from the morphology of the electrodes. The roughness of the gra-phene electrode might be an additional important parameter [15] for the device performance, since a smooth surface is necessary to realize a homogenous QD layer in order to avoid short circuits. The increased roughness might be a more crucial problem for the all-solution-based QD-LEDs than for the OLEDs due to a different fabrication procedure. Since both organic support layer and in particular the active QD layer are fabricated by a spin-coating, i.e., solution-based technique, the roughness of the graphene electrode critically influences the roughness of the following spin-coated layers and the quality of the whole layer stack becomes worse with increasing amount of layers. For example, in case of the monolayer electrode device the roughness of the surface already increased from Sa = 1.9 to 3.5 nm only after the first (PEDOT:PSS) spin-coating step. The final layer stack reveals a Sa value of 13 nm.
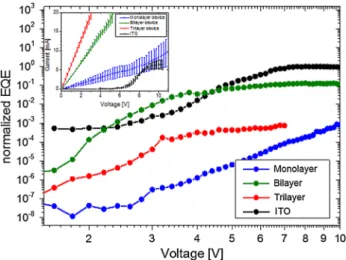
The increased roughness of the graphene trilayer might be the reason why the turn-on voltage of trilayer QD-LED increases and the intensity decreases, although the sheet resistance was improved compared to the monolayer and bilayer devices. In addition, the efficiency of graphene-based QD-LEDs suffers from the increased roughness of the bottom electrode. Figure5shows the EQE as a function of applied voltage for mono- (blue), bi- (green) and trilayer (red) devices. For comparison, the reference device (black) is shown. Indeed, while the reference device has the highest external quantum efficiency (EQE of 0.25 %) and bright-ness up to 140 cd/m2even without electron injection layers, the EQE of the monolayer device is three orders of mag-nitude below. The best graphene-based devices (bilayer electrodes) show also the highest EQE which is still almost one order of magnitude below the reference. The three-layer device exhibits a higher EQE compared to the monolayer device at low voltages, but the maximal EQE is the same as the one of the monolayer devices. The lower EQE of the
Fig. 4 a Normalized EL spectra of mono- (blue), bi- (green) and trilayer (red) devices at 7 V compared with the normalized PL spectrum of the CdSe/CdS dispersion (gray) and the EL spectrum of the reference ITO-based device (black). The inset shows a photograph of the QD dispersion under UV light excitation. b Intensity as a function of applied voltage for QD-LEDs with mono- (blue), bi-(green) and trilayer (red) electrodes compared to an ITO reference device (black). The inset shows typical photographs of the EL emission of the ITO and the bilayer (right) devices
graphene-based devices is most likely caused by morphol-ogy-induced short circuits through the spin-coated layer stack. The inset shows typical IV curves of mono- (blue), bi- (green) and trilayer devices compared to the reference device (black). The data showed here were averaged over several different graphene-based devices. Apparently, short circuit currents occur with increasing number of graphene layers, reducing the efficiency remarkably
The large-area homogeneity of the emission also suffers from the increased roughness. The inset of Fig.4 shows typical pictures of the active device pads for the ITO ref-erence device (left) and the bilayer device (right). Gra-phene-based QD-LEDs typically show areas of very high intensity (please notice the corresponding change of the color on the photograph of the active pad from red to yellow due to the overexposure) together with areas of lower intensity. The increased roughness of the electrode might result in local areas with high electrical fields, supporting the hole injection into the QDs and resulting in increased intensities (also in case of the bilayer device an overall higher intensity compared to the reference device due to locally bright spots). Besides, the larger Sa of the graphene layers hinders the fabrication of a homogeneous QD layer, so that wrinkles within a large-area graphene film might be responsible for the inhomogeneous emission and low effi-ciency of the devices.
4 Conclusion
In summary, we fabricated light-emitting devices with gra-phene electrodes consisting of one, two and three layers of graphene. We could demonstrate a relation between the
number of stacked graphene layers as a transparent anode in red QD-LEDs and the electro-optical behavior of the devi-ces. With increasing number of graphene layers, the sheet resistance of the devices decreases. The turn-on voltage of the resulting devices decreases from mono- to bilayer of graphene and reaches the state-of-the-art turn-on voltage of red QD-LEDs. The increase in the turn-on voltage of the trilayer device can be most likely attributed to an increased roughness of the stacked multilayer graphene electrode due to the specific device fabrication process. The results indi-cate that graphene electrode holds promise for QD-LEDs.
Acknowledgments We are grateful to S. Sanders, J. Frohleiks, J. Rest and K. Dunkhorst for support and assistance with the experi-ments. We kindly acknowledge financial support of the University Duisburg-Essen and OSRAM GmbH. Y.K and H.V.D acknowledge financial supports from ESF EURYI, EU FP7 Network of Excellence ‘‘Nanophotonics for Energy Efficiency (N4E) and TUBA—Turkish Academy of Sciences’’.
References
1. N. Thejo Kalyani, S.J. Dhoble, Renew. Sustain. Energy Rev. 16(5) (2012)
2. C. Altavilla, E. Ciliberto, in Inorganic Nanoparticles: Synthesis, Applications, nd Perspectives, ed. by E. Neshataeva, T. Ku¨mmell, G. Bacher, (CRC Press, 2010), pp. 109–132
3. J. Lim, W.K. Bae, J. Kwak, S. Lee, C. Lee, K. Char, Opt. Mater. Express 2, 5 (2012)
4. S. De, J.N. Coleman, ACS Nano 4, 5 (2010) 5. X. Wang, L. Zhi, K. Mu¨llen, Nano Lett. 8, 1 (2008)
6. Q. Zhang, Y. Di, C.M. Huard, L.J. Guo, J. Wei, J. Guo, J. Mater. Chem. C 3, 7 (2015)
7. Y. Galagan, J.-E.J.M. Rubingh, R. Andriessen, C.-C. Fan, P.W.M. Blom, S.C. Veenstra, J.M. Kroon, Sol. Energy Mater. Sol. Cells 95, 5 (2011)
8. S. Pang, Y. Hernandez, X. Feng, K. Mu¨llen, Adv. Mater. 23, 25 (2011)
9. T.-H. Han, Y. Lee, M.-R. Choi, S.-H. Woo, S.-H. Bae, B.H. Hong, J.-H. Ahn, T.-W. Lee, Nat. Photonics 6, 2 (2012) 10. K.S. Novoselov, A.K. Geim, S.V. Morozov, D. Jiang, Y. Zhang,
S.V. Dubonos, L.V. Grigorieva, A.A. Firsov, Science 306, 5696 (2004)
11. C. Lee, X. Wei, J.W. Kysar, J. Hone, Science 321, 5887 (2008) 12. F. Gu¨nes¸, H.-J. Shin, C. Biswas, G.H. Han, E.S. Kim, S.J. Chae,
J.-Y. Choi, Y.H. Lee, ACS Nano 4, 8 (2010)
13. S. Bae, H. Kim, Y. Lee, X. Xu, J.-S. Park, Y. Zheng, J. Balakrishnan, T. Lei, H. Ri Kim, Y.I. Song, Y.-J. Kim, K.S. Kim, B. O¨ zyilmaz, J.-H. Ahn, B.H. Hong, S. Iijima, Nat. Nanotechnol. 5, 8 (2010)
14. F. Bonaccorso, Z. Sun, T. Hasan, A.C. Ferrari, Nat. Photonics 4, 9 (2010)
15. Y. Han, L. Zhang, X. Zhang, K. Ruan, L. Cui, Y. Wang, L. Liao, Z. Wang, J. Jie, J. Mater. Chem. C 2, 1 (2014)
16. J. Meyer, P.R. Kidambi, B.C. Bayer, C. Weijtens, A. Kuhn, A. Centeno, A. Pesquera, A. Zurutuza, J. Robertson, S. Hofmann, Sci. Rep. 4, 5380 (2014)
17. J. Wu, H.A. Becerril, Z. Bao, Z. Liu, Y. Chen, P. Peumans, Appl. Phys. Lett. 92, 26 (2008)
18. J. Guo, C.M. Huard, Y. Yang, Y.J. Shin, K.-T. Lee, L.J. Guo, Adv. Opt. Mater. 2, 5 (2014)
Fig. 5 Normalized EQE as a function of applied voltage for QD-LEDs with mono- (blue), bi- (green) and trilayer (red) electrodes compared to an ITO reference device (black). The inset shows typical IV measurements for such QD-LEDs
19. P. Matyba, H. Yamaguchi, M. Chhowalla, N.D. Robinson, L. Edman, ACS Nano 5, 1 (2011)
20. P. Matyba, H. Yamaguchi, G. Eda, M. Chhowalla, L. Edman, N.D. Robinson, ACS Nano 4, 2 (2010)
21. Y. Shirasaki, G.J. Supran, M.G. Bawendi, V. Bulovic´, Nat. Photonics 7, 1 (2012)
22. A.V. Klekachev, S.N. Kuznetsov, I. Asselberghs, M. Cantoro, J. Hun Mun, B. Jin Cho, A.L. Stesmans, M.M. Heyns, S. De Gendt, Appl. Phys. Lett. 103(4), 1 (2013)
23. J.-T. Seo, J. Han, T. Lim, K.-H. Lee, J. Hwang, H. Yang, S. Ju, ACS Nano 8, 12 (2014)
24. L. Yan, Y. Zhang, X. Zhang, J. Zhao, Y. Wang, T. Zhang, Y. Jiang, W. Gao, J. Yin, J. Zhao, W.W. Yu, Nanotechnology 26, 13 (2015)
25. J. Kwak, W.K. Bae, D. Lee, I. Park, J. Lim, M. Park, H. Cho, H. Woo, D.Y. Yoon, K. Char, S. Lee, C. Lee, Nano Lett. 12, 5 (2012)
26. L. Qian, Y. Zheng, J. Xue, P.H. Holloway, Nat. Photonics 5, 9 (2011)
27. B.S. Mashford, M. Stevenson, Z. Popovic, C. Hamilton, Z. Zhou, C. Breen, J. Steckel, V. Bulovic, M. Bawendi, S. Coe-Sullivan, P.T. Kazlas, Nat. Photonics 7, 5 (2013)
28. A. Reina, X. Jia, J. Ho, D. Nezich, H. Son, V. Bulovic, M.S. Dresselhaus, J. Kong, Nano Lett. 9, 1 (2009)
29. K.S. Kim, Y. Zhao, H. Jang, S.Y. Lee, J.M. Kim, K.S. Kim, J.-H. Ahn, P. Kim, J.-Y. Choi, B.H. Hong, Nature 457, 7230 (2009) 30. W. Regan, N. Alem, B. Alema´n, B. Geng, C¸ . Girit, L.
Maser-ati, F. Wang, M. Crommie, A. Zettl, Appl. Phys. Lett. 96, 11 (2010)
31. J.A. Robinson, M. LaBella, M. Zhu, M. Hollander, R. Kasarda, Z. Hughes, K. Trumbull, R. Cavalero, D. Snyder, Appl. Phys. Lett. 98, 5 (2011)
32. O. Chen, J. Zhao, V.P. Chauhan, J. Cui, C. Wong, D.K. Harris, H. Wei, H.-S. Han, D. Fukumura, R.K. Jain, M.G. Bawendi, Nat. Mater. 12 (2013)
33. A.C. Ferrari, J.C. Meyer, V. Scardaci, C. Casiraghi, M. Lazzeri, F. Mauri, S. Piscanec, D. Jiang, K.S. Novoselov, S. Roth, A.K. Geim, Phys. Rev. Lett. 97, 18 (2006)
34. X. Li, W. Cai, J. An, S. Kim, J. Nah, D. Yang, R. Piner, A. Velamakanni, I. Jung, E. Tutuc, S.K. Banerjee, L. Colombo, R.S. Ruoff, Science 324, 5932 (2009)
35. X. Li, Y. Zhu, W. Cai, M. Borysiak, B. Han, D. Chen, R.D. Piner, L. Colombo, R.S. Ruoff, Nano Lett. 9(12), 4359–4363 (2009) 36. W.K. Bae, J. Kwak, J.W. Park, K. Char, C. Lee, S. Lee, Adv.
Mater. 21, 17 (2009)
37. G.J. Supran, K.W. Song, G.W. Hwang, R.E. Correa, J. Scherer, E.A. Dauler, Y. Shirasaki, M.G. Bawendi, V. Bulovic´, Adv. Mater. 27, 8 (2015)
38. Q. Sun, Y.A. Wang, L.S. Li, D. Wang, T. Zhu, J. Xu, C. Yang, Y. Li, Nat. Photonics 1, 12 (2007)
39. H.V. Demir, S. Nizamoglu, T. Erdem, E. Mutlugun, N. Gaponik, A. Eychmu¨ller, Nano Today 6, 6 (2011)
40. E. O’Connor, A. O’Riordan, H. Doyle, S. Moynihan, A. Cuddihy, G. Redmond, Appl. Phys. Lett. 86, 20 (2005)
41. N. Tessler, V. Medvedev, M. Kazes, S. Kan, U. Banin, Science 295, 5559 (2002)
42. B.O. Dabbousi, M.G. Bawendi, O. Onitsuka, M.F. Rubner, Appl. Phys. Lett. 66, 11 (1995)