www.elsevier.com/locate/ijforecast
Influence of differentiated roles on group forecasting accuracy
Dilek ¨
Onkal
a,∗, Michael Lawrence
b, K. Zeynep Sayım
caBrunel Business School, Brunel University, Uxbridge, Middlesex UB8 3PH, UK bAustralian School of Business, University of New South Wales, Sydney 2052, Australia
cFaculty of Business Administration, Bilkent University, 06800 Ankara, Turkey
Abstract
While behavioral research on forecasting has mostly examined the individual forecaster, organizationally-based forecasting processes typically tend to rely on groups with members from different functional areas for arriving at ‘consensus’ forecasts. The forecasting performance could also vary depending on the particular group structuring utilized in reaching a final prediction. The current study compares the forecasting performance of modified consensus groups with that of staticized groups using formal role-playing. It is found that, when undistorted model forecasts are given, group forecasts (whether they are arrived at through averaging or by a detailed discussion of the forecasts) contribute positively to the forecasting accuracy. However, providing distorted initial forecasts affects the final accuracy with varying degrees of improvement over the initial forecasts. The results show a strong tendency to favor optimistic forecasts for both the staticized and modified consensus group forecasts. Overall, the role modifications are found to be successful in eliciting a differential adjustment behavior, effectively mimicking the disparities between different organizational roles. Current research suggests that group discussions may be an efficient method of displaying and resolving differential motivational contingencies, potentially leading to group forecasts that perform quite well.
c
⃝2010 International Institute of Forecasters. Published by Elsevier B.V. All rights reserved.
Keywords:Judgment; Forecast; Adjustment; Group; Role
1. Introduction
The effectiveness of the supply chain planning ac-tivity is usually heavily reliant on the accuracy of the demand forecasts. The consequences of significant in-accuracies can be very large, either in lost sales or in
∗Corresponding author.
E-mail addresses:[email protected](D. ¨Onkal),
[email protected](M. Lawrence),
[email protected](K. Zeynep Sayım).
excess inventory (Worthen, 2003). To obtain the most accurate forecasts, this task is generally undertaken by teams which include representatives from areas such as marketing, production and forecasting, typically aided by computer-based forecasting support systems (Fildes, Goodwin, Lawrence, & Nikolopoulos, 2009). Each of the members of the forecasting team brings their own knowledge base and their organisational per-formance incentives to the complex task of agreeing on a consensus forecast. Even though the value of
0169-2070/$ - see front matter c⃝2010 International Institute of Forecasters. Published by Elsevier B.V. All rights reserved.
accurate forecasts for planning and decision-making processes in contexts such as supply chain manage-ment is indisputable, a review of the extant research on forecasting behaviour leads to two main concerns.
Firstly, most behavioural research in forecasting has focused on the individual performing a forecasting task (Lawrence, Goodwin, O’Connor, & ¨Onkal, 2006). In an experimental setting, the research participant is generally given a cover story asking him/her to play a functional role (e.g., marketing manager) and to make as accurate a forecast as possible. Advice may be provided via a forecasting support system, which typically displays a plot of the time series and the baseline forecasts for the upcoming periods, as well as any additional information relating to external factors (such as a planned promotion) which is not included in the suggested baseline forecast, if relevant. Although the participants are requested to play a specific functional role, no guidance is given as to what that role involves, apart from making an accurate forecast. A consistent finding in this area of work is a tendency to adjust forecasts when they should be left unadjusted, as well as, surprisingly, a tendency to not always adjust when the information provided indicates that an adjustment is needed (e.g., an event such as an upcoming promotion which is not incorporated in the presented forecast) (Goodwin & Fildes, 1999;Lim & O’Connor, 1996).
Secondly, the small amount of work that has been done on group forecasts (e.g.Ang & O’Connor, 1991; Sniezek,1989) has used peer groups where the mem-bers’ roles are undifferentiated. Clearly, the influence of organisational role is very significant in any judg-mental task such as constructing a forecast.Lawrence, O’Connor, and Edmundson(2000) reported differing attitudes to the sign of the forecast error1(from a pos-itive sign to zero to a negative sign) in the executives they interviewed. These attitudes appeared to reflect organisational incentive structures; and furthermore, the actual realised forecast biases were in line with these attitudes. Dearborn and Simon(1958) demon-strated that company executives each viewed organi-sational problem solving from the perspective of their own department. Thus, a marketing executive and a production executive would be likely to adopt quite
1 Indicating whether the forecast is over or under the actual value.
different positions on the question of forecast errors, as the areas of marketing and production generally have conflicting attitudes to over- and under-forecasting. Optimism is pervasive in marketing forecasts (Fildes et al., 2009), while production is generally concerned with keeping inventories low through what they see as “realistic” (lower) forecasts. Both knowledge and values differ across organisational roles, and jointly influence the way in which a forecasting problem is understood and estimated.
The current study aims to address these two sig-nificant concerns by experimentally replicating the typical organisational forecasting environment, in which a statistically-based prediction is provided to a forecasting/decision-making group, which then de-cides on a final forecast by either accepting the given forecast or adjusting it (Fildes et al., 2009). The mem-bership of the forecasting group we have adopted com-prises the three typical roles of marketing, production and forecasting. We examine various group effects by first seeking an independent individual forecast from each role-assigned group member who is provided with an initial statistical prediction. The average of these independent forecasts is termed the ‘staticized’ (i.e., composite) forecast, with previous work arguing for the potential benefits of such averaging across in-dividual assessors (e.g.Clemen,1989;Einhorn, Hog-arth, & Klempner, 1977; Lawrence, Edmundson, & O’Connor, 1986). Secondly, we investigate the ‘modi-fied consensus group’ approach, which may offer dis-tinct advantages for forecasting in a group setting (Ang & O’Connor, 1991). In this approach, an ini-tial statistical forecast is presented to the group to act as an anchor for their discussions, and the group is then asked to either accept or adjust this provided pre-diction in order to reach a final consensus forecast. The effect of the group discussion while arriving at a consensus decision can be measured by a compari-son of the accuracy of the staticized/composite cast with that of the modified consensus group fore-cast. We anticipate that the group discussion will im-prove the forecast (Cooke & Kernaghan, 1987;Hill, 1982; Mannes,2009), and hence that the consensus group forecast will be significantly more accurate than the staticized/composite forecast.
The value of the group discussion may depend significantly on the accuracy of the initial forecast. For example, if the initial forecast is good, there
may be less of a challenge for the group than if the initial forecast is bad, and thus requires a forecast adjustment to be made. To explore the potential effects of different initial forecast conditions, the current study uses model forecasts (i.e., undistorted forecasts obtained from a statistical model) versus distorted forecasts (i.e., model forecasts that are purposefully inflated or deflated). The goal is to explore the ability of the group setting to improve on the initial forecasts. The “anchor and adjustment” heuristic (Lawrence & O’Connor, 1995) suggests that a poor anchor leads to worse individual forecasts. However, the group discussion, particularly when the group membership includes differentiated roles, may not be impacted so negatively by a poor initial forecast. We review the pertinent research literature in the next section and lay out the specifics of our research hypotheses.
2. Literature review and hypotheses
A critical majority of studies in forecasting and decision-making concentrate on individuals, even though many key forecasts and decisions in political, economic, environmental, and organisational settings are made by groups (Lawrence et al., 2006; Milch, Weber, Appelt, Handgraaf, & Krantz, 2009). Convinc-ing evidence has been provided to show that there are qualitative differences between individual and group decision-making behaviors (e.g.Insko et al., 1987). It has been argued that individuals tend to behave dif-ferently when they make individual decisions relative to when they are in a group (Song, 2008). Moreover, group decisions are often not the simple sum or av-erage of individual members’ decisions — the broad body of work examining the effectiveness of group de-cision making supports the superiority of group deci-sions over either that of the individual, or the statistical average of the group’s individual members (Cooke & Kernaghan, 1987;Erden, von Krogh, & Nonaka, 2008; Hill,1982;Mannes,2009;Peterson, Mitchell, Thomp-son,& Burr, 2000).
In a recent detailed field study of sales forecast-ing performance, Fildes et al.(2009) examined sales forecasting processes in four large UK-based organi-zations. In each of these organizations, groups with representatives from marketing, sales, production, and forecasting were used to arrive at the final company forecasts through reviewing the statistical forecasts
provided and agreeing on adjustments when needed. With a large database containing original statistical forecasts, final company forecasts and actual sales re-sults, Fildes et al. (2009) investigated the resulting accuracy of the company adjustments to the statisti-cal forecasts, and found a persistent tendency toward optimism, as well as an excess of small adjustments, which did not improve the accuracy. The many small, unnecessary adjustments were considered to be indica-tive of insufficient trust in the reliability of the sta-tistical forecasts, coupled perhaps with an illusion of control effect (Langer, 1975). This agrees with re-search findings on the skepticism that forecast users show toward the forecast advice given by statistical models (Onkal, Goodwin, Thomson, G¨on¨ul, & Pol-¨ lock, 2009). Interestingly, relatively small perturba-tions in the forecasting environment have been shown to have a large impact on forecasters’ willingness to trust such statistical forecasts. For example,Lawrence, Goodwin, and Fildes (2002) increased the level of forecaster participation in structuring computer fore-casting support systems and found a much higher rate of adoption of its resulting advice. Providing explanations for the prepared forecast, as would nor-mally be done verbally by a forecaster in a fore-casting meeting, has also been shown to significantly increase the adoption rate of the prepared statistical forecast (G¨on¨ul, ¨Onkal, & Lawrence, 2006;Lawrence, Davies, O’Connor, & Goodwin, 2001). These findings highlight the potential influence of individual contri-butions that the members of a forecasting committee may make on the resulting forecast. On a related topic, the excessive discounting of statistical forecasts (as re-ported byFildes et al., 2009) may also be due to a lack of status or prestige on the part of the forecasting prac-titioners, many of whom expressed the opinion that they lacked standing in the forecasting meetings (pri-vate communication). When all of the members of the forecasting group have equal status and the decision is taken as a consensus, it is possible that the statis-tical forecast will have greater saliency, resulting in fewer harmful adjustments by the group. This is ad-vantageous when the initial forecast forms a sound ba-sis for the group decision, but may be disadvantageous when the initial forecast is biased.
Investigating the effects of group interaction pro-cesses on the forecasting performance in an experi-mental setting,Ang and O’Connor(1991) found that
the structure of the group had different effects on the interval forecasting accuracy, depending on the difficulty of the relevant time series. Their experimen-tal setting did not assign different roles to the various group members; instead, all participants were assigned the same task of estimating the most accurate cast by consensus. However, in organisational fore-casting contexts, each member of a forefore-casting group represents a different role, where each role is sub-ject to disparate organisational incentives and moti-vations. Thus, the Ang and O’Connor group setting ignores the potentially significant impact of organi-sational roles, along with the conflicting environmen-tal incentives and reward structures that are embedded within these roles. Supporting this view, Armstrong (2002,2006)emphasized the importance of the roles played by group members. Summarizing the findings of research on simulated interactions involving con-flict situations (e.g., political concon-flicts), he concluded that more accurate forecasts can be attained by groups with members playing different roles than by individ-uals acting independently. Confirmatory evidence in a group forecasting context came fromSniezek’s (1990) work with peer groups, which showed no significant process gains as a result of forecasting exercises per-formed in groups without any role differences.
Given the potential effects that differential roles may have on the group forecasting accuracy, the current study aims to fill this critical gap in the experimental forecasting literature. Our study uses three-person groups, with the members assuming the roles of Marketing Director, Production Director and Forecasting Executive, and with the particular role scripts structured to mimic real-life organizational roles. Previous studies have argued that forecasters, displaying a sense of ownership in their model forecasts, tend to make minimal adjustments (G¨on¨ul,
¨
Onkal, & Goodwin, 2009; Onkal & G¨on¨ul, 2005¨ ; Sanders & Ritzman, 2001), while upward (downward) adjustments are observed with marketing (production) directors, respectively (e.g. Edmundson, Lawrence, & O’Connor, 1988; Fildes et al., 2009; Lawrence et al., 2000). Accordingly, if the role manipulation is successful, we expect the Forecasting Executive to follow the statistical forecasts closely, making smaller adjustments overall (relative to the two other roles), while the Marketing and Production Directors should
tend to make upward and downward adjustments, respectively.
In addition to examining the potential effects of dif-ferential roles within groups, the current study aims to compare the forecasting performances of the staticized versus modified consensus group structures in order to elicit the impact of the group discussion and consen-sus forming activity. The staticized structure involves computing a composite/average forecast over a num-ber of individual forecasts, and thus should outperform the accuracy of an individual forecaster (e.g.Blattberg & Hoch, 1990;Clemen,1989;Lawrence et al.,1986; Surowiecki,2005). Modified consensus groups, on the other hand, require an initial statistical forecast to be presented to the group, followed by group discussions, leading to the development of a final consensus fore-cast. Since this group process involves averaging, in addition to the discussion and consensus building ac-tivities, it may be expected to outperform the average of the individuals in the group. Even though the influ-ence of differential role assignments has not been ex-amined in modified consensus groups, we anticipate that they will enhance the value of the group activities in reaching a consensus forecast, as the roles inher-ently involve conflict in their objectives. While conflict has been shown to sometimes improve and at other times reduce group effectiveness and decision making, for the task of forecasting it is most likely to improve the team performance, provided that the differences are not taken personally and there is only task conflict, not relationship conflict (Cronin & Weingart, 2007; Jehn & Mannix, 2001;Sniezek & Henry, 1990). This is because task conflict encourages discussion and the examination of alternatives in the problem domain.
To systematically examine the potential differences in forecasting accuracy and adjustment behavior in these group structures, we use three different initial forecast conditions: (1) model forecasts, (2) inflated forecasts, and (3) deflated forecasts. The model forecasts are obtained by exponential smoothing, a common forecasting method which is well regarded for its robust accuracy (Makridakis et al., 1993). The inflated and deflated forecasts are the model forecasts increased or decreased by 15% to build in an intentional bias. Such biases are anticipated to influence the group members’ forecast adjustments differentially, as well as providing an opportunity to
investigate the impact of a good or bad initial forecast on the group’s performance.
In light of the results revealed by the previous ex-perimental and field work on individual and group de-cisions and forecasts, as well as forecast adjustments (e.g. Fildes, Goodwin, & Lawrence, 2006; Lim & O’Connor, 1995;Mannes,2009;Mathews & Diaman-topoulos, 1986, 1987, 1989, 1990, 1992, 1994; Mc-Nees,1990;Sanders,1992;Wolfe & Flores, 1990), we hypothesise that when an undistorted model forecast is provided as an initial forecast, the modified consen-sus group will be more accurate than the average of the individual forecasts (i.e., staticized group). Also, when the prediction being provided as an initial fore-cast is a robust prediction that is unlikely to be beaten for forecasting a mathematically generated time series, we hypothesise that the modified consensus group will be equal to or better than the initial forecast in ac-curacy. This hypothesis (for forecasting groups) is in contrast to the body of research for individual forecast-ers which has demonstrated that, when provided with a good prediction, an individual will generally adjust it and reduce its accuracy (Lawrence et al., 2006). Given these findings for individual forecasters, we anticipate that the staticized group forecast (comprising the aver-age of individual forecasts) will be less accurate than the initial forecast. In addition, we expect the group discussion to mediate the tendency to make adjust-ments, thus leading to fewer adjustments in modified consensus groups than in staticized groups. Hence, we formulate the following hypotheses:
H1: When an undistorted model prediction is
pro-vided as the initial forecast:
a. Modified consensus group forecasts will be more accurate than the staticized group forecasts.
b. Modified consensus group forecasts will be as accurate as or more accurate than the initial forecasts.
c. Staticized group forecasts will be less accurate than the initial forecasts.
d. Modified consensus groups will make fewer adjustments to the initial forecasts than the staticized groups.
Since the quality of the initial predictions may significantly influence the final forecasts (Goodwin, 2005; Harvey,2001; Lawrence & O’Connor, 1995),
we expect a different set of results when distorted forecasts are given as initial predictions. In particular, we anticipate that the inflated initial forecast will be supported by the member tasked with the Marketing Director role, but rejected by the member tasked with the Production Director role in favor of a lower forecast. On the other hand, the deflated initial forecast is expected to be rejected by the Marketing Director in favor of a higher forecast, but supported by the Production Director. Although we would anticipate that the member tasked with the Forecasting Executive role will typically seek to defend the statistical forecast, (s)he may act differently when given inflated/deflated forecasts and will potentially try to bring them in line with the historical data. As before, we anticipate that the forecasts produced by the modified consensus group will be more accurate than those of the staticized group, and also more accurate than the initial forecast, due to the conflict in the group encouraging the consideration of all information, thus leading to a better performance (Sniezek & Henry, 1990). Given distorted initial forecasts, we expect the staticized group forecasts to be more accurate than the initial (inflated or deflated) predictions. Group discussions are also expected to result in more adjustments being made in the modified consensus groups, relative to the staticized groups. Accordingly, we formulate the following hypotheses:
H2: When a distorted (i.e., inflated or deflated)
predic-tion is provided as the initial forecast:
a. Modified consensus group forecasts will be more accurate than the staticized group fore-casts.
b. Modified consensus group forecasts will be more accurate than the initial forecasts. c. Staticized group forecasts will be more
accu-rate than the initial forecasts.
d. Modified consensus groups will make more ad-justments to the initial forecasts than the stati-cized groups.
3. Research methodology 3.1. Participants
The participants were 72 third year business stu-dents at Bilkent University who were taking a fore-casting course. No monetary incentives were given,
but participation earned the students extra credit in their final course grades. Using student participants in group settings is very common in research on forecast-ing (as reviewed byLawrence et al., 2006) and group decision-making (e.g.Filios,1992; Valacich, Sarker, Pratt, & Groomer, 2009). In fact, comparisons of man-agers and students have revealed very few differences in the patterns of erratic behavior and bias in the two groups’ decisions (Mowen & Mowen, 1986), while the students were argued to be less susceptible to bringing their organizational/external issues and influences to the experimental setting, thus presenting a favorable participant pool (Ruchala, 1999).
3.2. Design
The study involved paper and pencil tasks which were framed as sales forecasting for the different prod-ucts of a case study organization. The experiment con-sisted of three phases, lasting a total of approximately three hours (with Phases I, II, and III taking around 20, 50, and 110 minutes, respectively).
PHASE I: Information and role initiation
In Phase I, the background information for the or-ganization was presented (see Appendix A for the background information on the hypothetical organiza-tion), and the task requirements were explained using specific examples. Participants were randomly allo-cated to three-person groups (making a total of 72/3 = 24 groups), followed by the group members drawing out unmarked envelopes to randomly pick their roles as the Forecasting Executive, Marketing Director, or Production Director. All participants with the same role were then asked to go into one of three rooms, where separate preparation sessions were conducted for each role, to explain the specific role requirements and to address any questions (seeAppendix Bfor the role information given to the participants in the Fore-casting Executive, Marketing Director, and Production Director roles). At the end of the role-preparation ses-sions, the participants went to the specific rooms as-signed to their individual groups for the remaining two phases of the study.
PHASE II: Staticized group forecasts
In Phase II, the participants were organized into groups of three subjects in their assigned rooms, but the individuals were not permitted to talk or exchange any information. They were given a set of 20 time
series plots, along with one-period-ahead initial point forecasts (i.e., computer generated forecasts) and their individual role scripts (i.e., stories) for each series. While all of the subjects were presented with the same set of time series (with different randomized order-ings), each participant received one of three stories to match their particular role (see Appendices C–E for examples of the forms, involving the same time series as shown inFig. C.1, given to participants in the Fore-casting Executive, Marketing Director, and Production Director roles, respectively). Additionally, for both Phase II and Phase III, the 24 groups were randomly divided into three initial forecast conditions, so that the eight groups in Initial Forecast Condition: ModelF all received model forecasts as their initial predictions; while the eight groups in Initial Forecast Condition: InflatedFall received inflated forecasts, and the eight groups in Initial Forecast Condition: DeflatedF all received deflated forecasts as their initial predictions (more details of the way in which these forecasts were obtained are presented in the next subsection). For each of the 20 time series, Phase II required the par-ticipants to study the given time series, the presented initial forecast, and their role scripts in order to make their individual sales forecasts for the next period. PHASE III: Modified consensus group forecasts
In Phase III, the participants were organized into their groups and were instructed to engage in group discussions in order to arrive at consensus forecasts for each product’s sales in the next period. The set of rules given to each group prohibited any member act-ing as a group leader, while askact-ing the participants to: (i) act out their given roles as they believed they would be performed in an organization; (ii) act with due con-sideration for all group members; (iii) let the forecast-ing executive introduce the initial forecast and record the consensus forecast; (iv) record their levels of sat-isfaction with each of the consensus forecasts; and (v) evaluate each of the group members upon task completion, along with a self-evaluation. They were presented with a different set of 20 time series to that from Phase II, along with the corresponding one-period-ahead initial point forecasts (i.e., computer ge-nerated forecasts) and their individual role scripts for each series. As in the previous phase, all of the sub-jects were presented with the same set of time se-ries, but each participant also received one of three stories to match their particular role. Their previous
assignment to one of the three initial forecast condi-tions (ModelF, InflatedF, or DeflatedF) continued in Phase III as well. In summary, for each of the 20 new time series, Phase III required the participants to study the given time series, the presented initial forecast, and their role scripts, in order to engage in group discus-sions and develop consensus sales forecasts.
3.3. Time series and initial forecasts
A set of 40 artificially generated non-seasonal time series was divided into two equivalent sets containing 20 time series each, to be used in Phases II and III of the experiment (the two sets showed no statistically significant differences in either (i) the MAPEs of the statistical forecasts for the two datasets, or (ii) the MAPEs of the judgmental forecasts that similar groups of participants produced for these two datasets in pilot studies). Each of the two sets of 20 time series comprised 10 series with low variances and 10 with high variances (the high variance was equal to three times the low variance). For each of these sets of 10 series, five were constructed from an AR(1) model and five from a model with a simple linear trend plus a random normal deviate. Each series included one promotion in the last 11 observations, and six of the 20 series also had a promotion in the period to be forecast. The promotion impact was generated by a stochastic function which increased the demand in the promotion period by 25%–50% and decreased it in the following period by 15%–40%. Each time series plot showed 11 past observations and asked for a forecast for period 12. Period 12’s value was generated for each of the 40 series so that measures of forecasting performance could be computed from the participants’ predictions. The initial forecasts given to the subjects were obtained via Holt’s Linear Exponential Smoothing technique. When there was an upcoming promotion indicated for a product/series, a separate promotion effect forecast (calculated using the percentage effect on sales of the previous promotion for that product/series) was presented to the participants in addition to the model forecast. Hence, the participants received a model forecast, a promotion effect forecast, and a total forecast for each product with an upcoming promotion, while receiving only the model forecast for the remaining products (with no upcoming promotions). Since the participants
are requested to provide ‘final’ forecasts (with no promotion effect breakdowns), the results given in our findings section address the predictive performances of these overall forecasts.
Participants in the Initial Forecast Condition: ModelF received the undistorted model forecasts, as was explained above. On the other hand, the Initial Forecast Condition: InflatedFparticipants were given ‘inflated’ forecasts (i.e., model forecasts multiplied by 115%), whereas those in the Initial Forecast Condition: DeflatedF were presented with ‘deflated’ forecasts (i.e., model forecasts multiplied by 85%). This modification of ±15% was found to be sufficient to bring about a significant change in the accuracy of the given forecasts, such that although the inflated and deflated forecasts showed equivalent accuracies, they both performed worse than the undistorted model forecasts (see Section4.1for details).
4. Findings
4.1. Role manipulation
We first need to investigate the forecast bias as a manipulation check, to examine the influence of the role assignments given to the participants. If the role manipulation is successful, we anticipate that the roles given to the subjects should lead to no bias for the forecaster role, a positive bias for the marketing role and a negative bias for the production role. Forecast bias is measured by the percentage error (PE), defined as:
PE = {[forecast − realized value]/realized value} × 100. Table 1 presents the average bias by role for the forecasts produced in the staticized group study (where the participants report their individual fore-casts given their particular role assignments) un-der the model forecasts condition (where undistorted model predictions are given as the initial forecasts). In the table we also present, as a reference point, the bias for the undistorted model forecasts provided to the participants. The results in this table show that the biases from participants assigned the Forecasting Executive and Marketing and Production Directors’ roles are as was anticipated for these roles, with significant bias differences (t13 = −2.33,
two-tailed p = 0.037, Cohen’s d = −1.16 for
Table 1
Mean percentage error by role (in the staticized group study for forecasts given in the model forecast condition).
Mean percentage error Forecasting Executive role 0.49%
Marketing Director role 8.93% Production Director role −9.43% Model forecast −0.64%
comparison; t10 = 3.73, two-tailed p = 0.004,
d = 1.87 for the Forecasting Executive vs. Produc-tion Director comparison; and t9 = 6.05, two-tailed
p < 0.001, d = 3.02 for the Marketing Director vs. Production Director comparison). These findings demonstrate the effectiveness of the role manipulation used in the experiment.
4.2. Aspects of forecasting performance
Forecast accuracy (as measured by the mean ab-solute percentage error (MAPE)) and forecast ad-justment (as measured by the mean percentage change (MPC) from the initial forecasts given to the participants) represent the two important as-pects of the forecasting performance which are emphasized in this study. While the MAPE ad-dresses the research hypotheses related to accuracy (i.e., H1a, H1b, H1c, H2a, H2b, and H2c), the MPC
aids in examining the hypotheses concerning adjust-ments of the initial forecasts (i.e., H1dand H2d). This
section presents and discusses the findings under each of these performance categories.
4.2.1. Forecast accuracy
The MAPE, a commonly used measure of forecast-ing accuracy, is defined as the mean of the absolute percentage errors (APE) over a set of forecasts, where APE = {[|forecast − realized value|]/
realized value}∗100.
The MAPE values for the staticized group versus the modified consensus group forecasts for the three ini-tial forecast conditions are presented inTable 2, along with the two-tailed p-values of the relevant pairwise comparisons. Using a mixed-factorial ANOVA with the initial forecast condition (ModelF vs. InflatedF
vs. DeflatedF) as the between-groups factor and the group structure (staticized group vs. modified con-sensus group) as the within-groups factor, significant main effects were found for both factors (F2,21 =
23.99, p < 0.001, partial η2 = 0.42 for ‘initial forecast condition’; F1,21 = 16.86, p = 0.001,
par-tial η2 = 0.09 for ‘group structure’), with no addi-tional significant interaction effects (F2,21 = 2.68,
p =0.092, partial η2=0.03).
As Table 2 shows, when undistorted model fore-casts are given as initial predictions, the modified con-sensus group forecasts show a higher accuracy (i.e., lower MAPE) than the staticized group forecasts (t9=
3.02, one-tailed p = 0.007, d = 1.51), supporting H1a. In addition, the modified consensus group
fore-casts were as accurate as the initial forefore-casts given to this group, supporting H1b(t7=0.10, two-tailed p =
0.920). The staticized group forecasts are more than 1% less accurate than the initial forecasts (t7 =4.57,
one-tailed p = 0.0015), thus supporting H1c.
When inflated or deflated predictions are used as the initial forecasts, the improvement potential in the MAPE (i.e., the difference between the MAPEs of the distorted and undistorted forecasts) is around 5%. Interestingly, the modified consensus group and the staticized group forecasts are equally accurate when inflated initial predictions are given (t10 =
0.45, two-tailed p = 0.663, d = 0.23); while the modified consensus group is more accurate in the case of deflated initial predictions (t13 =
2.67, one-tailed p = 0.010, d = 1.34), with an accuracy improvement over the initial forecast of 4.2%. Thus, our findings support H2a for deflated
initial predictions, while refuting it for inflated initial predictions. The modified consensus group forecasts are found to be more accurate than the initial forecasts for both the inflated and deflated cases (t7 =
−2.54, one-tailed p = 0.020 for inflated; and t7 = −4.78, one-tailed p = 0.001 for deflated),
which supports H2b. The staticized forecasts are
also more accurate than the initial distorted forecasts (t7 = −4.30, one-tailed p = 0.002 for inflated;
t7 = −1.91, one-tailed p = 0.048 for deflated),
supporting H2c.
4.2.2. Forecast adjustment
The percentage change (PC) from the initial predictions is used to examine the forecast adjustment
Table 2
Mean absolute percentage errors for the staticized and modified consensus group forecasts, with initial forecast condition breakdowns (with lower MAPE scores indicating a better forecast accuracy).
Initial forecast condition
ModelF InflatedF DeflatedF Staticized group forecasts (SGF) 13.80% 18.01% 16.01% Initial forecasts given to the staticized group 12.52% 19.77% 17.33% Modified consensus group forecasts (MCGF) 11.50% 17.59% 13.12% Initial forecasts given to the modified consensus group 11.43% 19.71% 17.11%
SGF vs MCGF (p-value) 0.014* 0.663 0.019*
SGF vs Initial forecasts (p-value) 0.003** 0.004** 0.097 MCGF vs Initial forecasts (p-value) 0.920 0.039* 0.002**
∗p< 0.05. ∗∗p< 0.01.
behavior. In particular:
PC = {[group forecast − initial forecast]/ initial forecast}∗100.
The mean of the percentage changes over a set of group forecasts yields MPC, which provides useful information about the positive/negative adjustment from the initially provided forecasts.
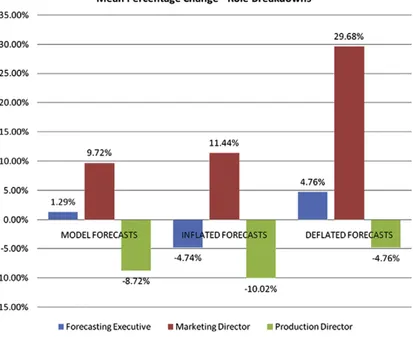
Fig. 1 summarizes the MPC values for the stati-cized group versus the modified consensus group fore-casts for the three initial forecast conditions. In the staticized group case, the MPC for the ModelF condi-tion is significantly higher than zero (t7 =1.96; p =
0.045 for testing H0:µ = 0 vs. Ha:µ > 0),
mean-ing that the staticized forecasts are significantly over-adjusted when undistorted model forecasts are given. On the other hand, when inflated forecasts are given, no sizeable positive/negative adjustments are observed (t7= −1.67; p = 0.140 for testing H0:µ = 0 vs. Ha:
µ ̸= 0). Similarly, when deflated forecasts are given, the forecasts are not significantly over/under-adjusted relative to the initial predictions (t7=0.97; p = 0.362
for testing H0:µ = 0 vs. Ha:µ ̸= 0), signaling that
statistical averaging appears to yield predictions that are not responsive to the distorted forecasts given to them.
A different picture emerges for forecast adjust-ments in modified consensus groups. When undis-torted model forecasts are given, the mean percentage change does not differ significantly from zero (t7 =
0.39; p = 0.710 for testing H0:µ = 0 vs. Ha:µ ̸= 0),
indicating no positive/negative adjustments to the ini-tial forecasts. When deflated predictions are given, the
group forecasts are adjusted to be considerably higher than the initial predictions, resulting in an overall sig-nificant positive adjustment (t7=5.63; p < 0.001 for
testing H0: µ = 0 vs. Ha: µ > 0), suggesting that
the groups realize that the given forecasts are deflated, and therefore act to correct for this. A similar recogni-tion appears in the inflated forecasts condirecogni-tion, where the groups adjust their forecasts to be noticeably lower than the given predictions, leading to an overall signif-icant negative adjustment (t7= −2.49; p = 0.021 for
testing H0:µ = 0 vs. Ha:µ < 0).
Although the modified consensus group forecast adjustments appear to be more than those of the stati-cized group for the inflated and deflated initial forecast conditions, these differences in the mean percentage change are not sufficient to achieve statistical signif-icance, and hence H2d is not supported. In addition,
H1dis not supported either. In particular, there do not
appear to be any significant differences between the two group structures with respect to their propensity to adjust the initial predictions, regardless of whether they are provided with undistorted (t13 = 1.00; p =
0.334, d = 0.50 for model forecasts as initial pre-dictions) or distorted initial forecasts (t10 = 1.52;
p = 0.160, d = 0.76 for inflated forecasts as initial predictions; t8 = −0.89; p = 0.398, d = −0.45 for
deflated forecasts as initial predictions). This lack of significance could stem from the relatively low statis-tical power of the tests, due to the sample size issues which are typically associated with group research, and which may, in turn, instigate the large variation ob-served within groups (e.g., in the deflated initial fore-cast condition, the MPC ranges between −10% and
Fig. 1. Forecast adjustment comparisons of group structures according to the initial forecast conditions (with higher |MPC| scores indicating a greater adjustment).
+17% for the staticized group and between +1% and +11% for the modified consensus group).
Fig. 2summarizes the effects of the experimental role manipulation on forecast adjustments for the stati-cized case (where the individual forecasts were given by participants in the three roles). It can be observed that the participants assigned the Forecasting Execu-tive role made fewer adjustments than the members in the other roles for the undistorted and inflated initial forecast conditions, displaying their overall sense of ownership of the model forecasts (all p< 0.05). The only exception to this is for the deflated initial fore-cast condition, where the participants in the Forefore-cast- Forecast-ing Executive and Production Director roles appear to make forecast adjustments of similar magnitudes (t8=
−0.03, p = 0.973, d = −0.02 for testing for differ-ences in absolute magnitudes), albeit in opposite direc-tions; with both roles making fewer adjustments than the participants in the Marketing Director role (t10 =
5.15, p < 0.001, d = 2.57 for the comparison with the Forecasting Executive role; t7=5.71, p = 0.001,
d = 2.85 for the comparison with the Production Director role). Those subjects who are in the Market-ing Director role seem to make positive adjustments under all forecast conditions, with the largest posi-tive adjustments being made when deflated forecasts
are given. It appears that these participants are con-sistent in their upward adjustments of given forecasts, thus closely following their initial scripts in making a concerted effort to increase the model predictions. Similarly, those participants who were in the Produc-tion Director role appear to have followed their role descriptions in reducing the model predictions under all forecast conditions. These participants make their largest negative adjustments when inflated forecasts are given, while making smaller adjustments when de-flated forecasts are provided.
To gain further insights into the consensus forecast-ing behavior of the groups in the three forecast condi-tions, we also analyzed the agreement scores that the participants assigned to each of the consensus fore-casts they gave in Phase III (the modified consensus group study) of the experiment. Fig. 3 summarizes the mean levels of agreement by role. For each of the initial forecast conditions, as well as aggregated over all conditions, those participants who were playing the Forecasting Executive role showed a significantly higher agreement with the consensus than the partic-ipants in either the Marketing Director or Production Director roles (all p < 0.005 for two-sample t-tests of comparisons of (i) Forecasting Executive vs. Mar-keting Director roles; and (ii) Forecasting Executive
Fig. 2. Forecast adjustment comparisons of roles according to initial forecast conditions (with higher |MPC| scores indicating a greater adjustment).
Fig. 3. Mean levels of agreement (out of 5, where 1 = totally disagree; 5 = totally agree), together with the group consensus for modified consensus group participants, along with role and initial forecast condition breakdowns.
vs. Production Director roles). On the other hand, the participants in the Marketing and Production Director roles displayed no significant differences in their levels of agreement with the group consensus (all p > 0.10 for two-sample t -tests of comparisons of the Market-ing Director and Production Director roles).
5. Discussion and limitations
Our findings may be summarized as follows: (1) The modified consensus group forecasts are more
accurate than the staticized group forecasts when either undistorted model predictions or deflated
predictions are given as the initial forecasts, but not when inflated predictions are given (supporting H1a while providing mixed evidence
for H2a, depending on inflated vs. deflated initial
predictions);
(2) The modified consensus group forecasts are more accurate than the initial forecasts when either in-flated or dein-flated predictions are given (supporting H2b), while yielding an accuracy equal to that of
the initial forecasts when undistorted model pre-dictions are given (supporting H1b);
(3) The staticized group forecasts are less accuracte than the initial forecasts when undistorted model predictions are given (supporting H1c), while
be-ing more accurate than the initial predictions for the inflated/deflated forecast conditions (support-ing H2c); and
(4) No significant differences could be found between the two group structures in their propensity to adjust the initial predictions, regardless of whether they are provided with undistorted or distorted initial forecasts (refuting H1dand H2d).
Our findings highlight the potential gains that may accrue from using groups, with the modified consen-sus group structure in particular leading to more ac-curate forecasts than the staticized group structure when either undistorted or deflated predictions are given as the initial forecasts. However, when the initial forecasts are inflated, the superiority of the modified consensus group appears to be eliminated. This could potentially be a byproduct of the optimism bias, with the participants not wanting to ‘touch’ positive-looking forecasts. In addition, the results could arise from the risky-shift phenomenon, which is encoun-tered in groups where the members end up making riskier decisions than would be the case if they were to make the same choices individually. Such inclinations towards risky alternatives may be due to (i) the diffu-sion of responsibility which is associated with group settings (Wallach, Kogan, & Bem, 1964); (ii) the as-sociation of risk-taking with a higher social status in groups (Brown, 1965); (iii) the psychology of focusing on riskier alternatives leading to an illusion of a lower perceived risk, due to the familiarity and/or comfort which is brought about by such a focus (Bateson, 1966); or (iv) a risk-taking member being inherently
more overconfident, and hence persuading the other team members easily (Collins & Guetzkow, 1964).
Our results relating to the modified consensus group forecasts do not concur with the repeated re-search finding that judgmental interventions degrade the accuracy of statistical predictions (Lawrence et al., 2006). This may be viewed as an important caveat to be added to the previous research findings, which have primarily been based on individual forecasters. Inter-estingly, averaging individual forecasts (i.e., the stati-cized group) only leads to a statistically improved ac-curacy compared to the initial forecasts when distorted forecasts are given. In situations when undistorted ini-tial forecasts are given, averaging does not seem to propagate sufficient wisdom to outperform the accu-racy of the model forecasts. However, the real benefits of averaging surface when the initial predictions are inflated/deflated, indicating the individual forecasters’ immediate recognition of predictions that ‘do not look right’. It is worth noting that a further benefit of av-eraging involves the avoidance of typically repetitive, time-consuming and expensive meetings, especially for cases where the accuracy advantages may be neg-ligible, or where organizational concerns dictate per-formance criteria other than predictive accuracy.
Overall, the results showed that there is a strong tendency to favor higher forecasts for both the stati-cized and modified consensus group forecasts, reflect-ing the bias toward optimism which was reported by Fildes et al. (2009), as well as the widely observed heuristic favoring upward trending economic series re-ported in many studies (see Lawrence et al., 2006). This tendency toward optimism was demonstrated by the relatively small adjustments reducing the inflated forecasts slightly, compared to the much larger adjust-ments increasing the deflated forecasts. In other words, although the subjects responded and reduced the bias when given distorted initial forecasts, the response was minimal in the inflated condition but much stronger in the deflated condition. This resulted in different forecasting accuracy profiles for the staticized and modified consensus group forecasts across the initial forecast conditions.
Contrary to our expectations, no significant differ-ences could be found between the two group structures with respect to their propensity to adjust the initial predictions across any of the forecast conditions. Although we expected the superior performance of the
modified consensus group (as shown by lower MAPE scores relative to the staticized group) for the deflated forecast condition to arise mostly from adjustments which are significant and in the right direction, we could not find any statistical evidence of this. This is interesting in light of the divergent adjustment patterns found for the three roles. These results may be viewed as suggesting that the role assignment dominates the adjustment behavior and that the group discussion does not appear to have any unique influence over and above this ‘role framing’. That is, the participants may have been so engrossed in game playing that their fo-cus was not on making accurate consensus forecasts, but rather on following their role scripts as closely as possible. A related explanation may be that, since the participants are used to making their own forecasts in Phase II (staticized group phase), this effect spills over to Phase III (modified consensus group phase). That is, the participants may prefer to make their own implicit forecasts prior to starting their group discus-sions, which, in effect, may lead to an egocentric bias blocking any positive process gains from group dis-cussions. Such a powerful anchoring on one’s own forecasts may have preempted learning from the in-formation exchange that would ordinarily be expected to take place in groups. Future work exploring the potential effects of assessing overt vs. covert prior forecasts under differently structured group methods would be very beneficial in addressing these issues. In particular, comparative studies using structured group techniques in forecasting settings with varying levels of predictability deserve special consideration (Rowe & Wright, 1996; Wright & Goodwin, 2009). Such work would be especially important in analyzing the interactions of information sharing and uncertainty management in group forecasts, as well as extending previous research on teams and information dissem-ination (e.g. Hill, Bartol, Tesluk, & Langa, 2009; LePine, Piccolo, Jackson, Mathieu, & Saul, 2008; Mesmer-Magnus & DeChurch, 2009).
We had expected task conflict to mediate our re-sults on interactive groups, when in fact our find-ings revealed high levels of agreement among group members. Given our experimental structure and the instructions, which were designed to minimize af-fective conflict within role assignments, our expecta-tion was for task conflict to improve the performance across all forecast conditions. While the study was
successful in communicating the intended roles (with those assigned the Forecasting Executive role display-ing the most resistance to changdisplay-ing the given forecasts, while the Marketing Directors pushed the forecasts up and the Production Directors pulled the forecasts down), our design may have inadvertently prevented the participants from benefiting from group discus-sions, thus effectively restricting the performance po-tential of group forecasting. Possible limitations that may stem from the experimental framework need to be noted. For instance, we had to use two equivalent sets of time series for the staticized and modified con-sensus group forecasts in order to avoid confounding. Alternative experimental designs could be utilized to compare the two group structures using a common set of time series. Also, the relatively long duration of the experiment may have led to fewer adjustments in the last phase (where forecasts were made via the modified consensus groups). Although no lack of mo-tivation or tiredness effects were mentioned in post-experimental discussions for any of the phases, it is possible that the participants made fewer adjustments in Phase III in order to avoid lengthy discussions with other group members, and thus end the study quickly. Another potential limitation may arise from possible learning effects between Phases II and III. Given that the participants were students in a forecasting course and were thus accustomed to participating in forecast-ing competitions throughout the semester, no signifi-cant learning effects were expected over the duration of the study. However, it is possible that the particu-lar role structures utilized in the experiment facilitated different task learning processes, thus partially con-tributing to the results. Future studies designed to sys-tematically investigate these potential effects should prove useful in designing improved forecasting sup-port processes for groups.
In addition, the current work has not examined the possible effects on accuracy and role performance of providing various incentives. Even though both the verbal and written instructions at the beginning of the study clearly emphasized the main goal to be an im-proved forecast accuracy, it could be that the partici-pants perceived the task as predominantly being a role-game, with the primary goal of following their stated role descriptions. Using differential incentive schemes to reward both the fit with the role descriptions and the group forecasting accuracy poses a promising
direction for future research on the intricacies of group forecasts. Similarly, further work with managers in actual company settings would facilitate the deve-lopment of interactive measures of conflict, thus ena-bling a more detailed analysis of role conflict. This could be expected to contribute significantly to our un-derstanding of group dynamics and forecasting behav-ior under varying levels of conflict subject to organi-zational pressures and uncertainty.
6. Conclusions
This paper has explored the dynamics of forecast adjustment in group settings with formal role assign-ments and differences in initial forecast conditions. Its findings showed that the judgmental adjustments reflect the recognition of inflated and deflated fore-casts, resulting in differential modifications to correct the distortions in the initial forecasts. In particular, in-flated initial forecasts were adjusted downwards, but not to the same extent as the upward adjustments made in response to the deflated initial forecasts. Furthermore, the modified consensus group forecasts improved upon the accuracy of the initial forecasts for the inflated/deflated situations, while being equally accurate in the case of the undistorted model predic-tions. While the group discussions involved with con-structing the modified consensus group forecasts im-proved the accuracy over that of the staticized group forecasts when either deflated or undistorted model predictions were given, an optimism bias apparently prevented such an accuracy boost when inflated pre-dictions were provided as the initial forecasts. Over-all, the role modifications were successful in eliciting a differential adjustment behavior, effectively mim-icking the disparities among different organizational roles.
The current results suggest that group discussions may be an efficient method of displaying and resolv-ing differential motivational contresolv-ingencies, potentially leading to group forecasts that perform quite well. In-stead of the multi-tier forecast adjustments that are commonly made in organizations (Onkal, G¨on¨ul, &¨ Lawrence, 2008), group forecasts provide a common platform on which to make a ‘joint’ adjustment, with shared responsibilities. A recent survey of business forecasters has shown that taking responsibility for forecasts is given as one of the primary reasons for
individual forecast modifications (G¨on¨ul et al., 2009), at times leading to a questionable prediction quality. The current work proposes a way forward, with or-ganizational forecasting teams formally sharing their informational advantages and assuming a reciprocated accountability for the resulting predictions. Future ex-tensions of this research that capitalize on the group dynamics in order to support organizational sense-making will prove immensely valuable for enhancing the effectiveness of group-based judgmental forecast-ing.
Appendix A. Background information on the case study organization
A.1. The Delta Gizmo Company
The Delta Gizmo Company manufactures hand gar-den tools which are sold through specialised retailers, as well as at large discount stores. The company has a program of special promotions to bring its products to the notice of customers, where each of its key products is promoted regularly on a rotating basis.
Each month, Delta Gizmo produces one-month-ahead forecasts for its production. These forecasts are produced just before the start of each month for the following month. For instance, the forecast for July is produced in late May, when the sales for May are pretty well determined. Delta Gizmo is naturally keen to forecast as accurately as possible in order to reduce the potential costs: firstly, the cost of over-production and the associated storage cost; and secondly, the cost of lost sales due to running out of stock as a result of under-production.
The company forecast for each product is produced by the Forecasting Committee, comprising the Marketing Director, the Forecasting Executive (who is also the Chief Information Officer, CIO), and the Production Director. At their monthly meetings, they review the following before agreeing upon the company forecasts:
(i) Statistical forecasts (produced in advance using the computerised forecasting system) provided by the Forecasting Executive;
(ii) The promotion plans and market intelligence (MI) of the marketing department, conveyed by the Marketing Director; and
(iii) Relevant production issues brought out by the Production Director.
Together, they agree upon a forecast, which then be-comes the company forecast input for the production planning and inventory control system.
For some time, Delta Gizmo has been seeking to foster an improved culture where its executives work harmoniously towards the organisation’s objective of increasing the accuracy of its forecasts. This is the ini-tiative of its chief executive officer (CEO), who has been concerned by the tendency for forecasts to be too optimistic, reflecting, he believes, the excessive optimism of the marketing executives and their de-sire to have sufficient stock in case the promotion is as successful as they hope for. To help improve the working relationships, the CEO has asked the Fore-casting, Marketing and Production Directors to draft brief comments on each of the key products before the meeting, so that the others can be forewarned of any issues that may need to be addressed.
The discussions at the forecasting meetings have been harmonious, although the Production Director and Forecasting Executive generally work hard to tone down the Marketing Director by reminding him/her about previous experiences, with comments such as, “That is what you told us last time around, and we only scored about 80% of what you said the extra would be. Just look at the figures!”. On the other hand, the Mar-keting Director reminds the Forecasting Executive and Production Director of previous examples of success-ful promotions, where the sales exceeded all expecta-tions and they ran out of stock, with high costs in lost sales. In the past, the Marketing Director’s power in these meetings has enabled marketing’s will to prevail. However, with the new initiative of the CEO, the three members of the Forecasting Committee need to agree upon the final forecast unanimously, thus reaching a consensus forecast for each product.
Appendix B. Role information given to partici-pants in the ‘Forecasting Executive’, ‘Marketing Director’, and ‘Production Director’ roles
B.1. The Forecasting Executive (Chief Information Officer — CIO)
The Forecasting Executive is one of the executives who report directly to the CEO. The major responsi-bility of this position is the development of the most
accurate possible forecasts for the company. You, as the Forecasting Executive, believe that the profitabil-ity of the company is mainly dependent on the suc-cess of its forecasts, as production is based on them, which can in turn either reduce or increase the inven-tory and manufacturing costs. Therefore, you feel that your position is superior to the other positions report-ing to the CEO. You personally believe that since your appointment as the CIO, Delta Gizmo’s success has been due primarily to the excellent job you have done in the forecasting department.
Considerable investments have been made in the last few years for upgrading the computer information systems of Delta Gizmo. The upgraded systems in-clude a state-of-the-art computerised forecasting sys-tem, which has been demonstrated to be as accurate as possible, given the randomness of the data. In ad-dition, the computer forecasts so far appear to be more accurate than those previously prepared by the Sales and Marketing Departments. Each month, you, as the Forecasting Executive, make sure that the job of massaging the data base (with the help of the fore-casting software) is being done properly, in order to remove the impacts of special events such as promo-tions. This is needed for the baseline forecast to be as accurate as possible. You review each forecast care-fully before the Forecast Committee meeting. At each monthly Forecasting Meeting, you collaborate with the Marketing and Production Directors to achieve the best possible company forecasts by working on the computer forecasts and any additional data brought forward by these directors. However, you, as the ex-ecutive in charge of preparing the computerised fore-casts, feel quite strongly that changes to these should only be made when a promotion is coming up or if someone in the meeting can see a problem with the computer forecast. Since the CEO has taken steps to increase the power of the Forecasting Executive’s po-sition in the Forecast Committee, you feel much more comfortable in asserting the accuracy of the computer forecasts. Your one concern, however, is that you have not been formally trained in forecasting, and nor has anyone else in your unit. Therefore, you feel vulner-able when you are challenged on the need to change forecasts due to observed patterns in the time series that seem not to be reflected in the computer forecast. This does happen from time to time, as even the best forecast can be wrong and need to be modified.
B.2. The Marketing Director
The Marketing Director is one of the executives who report directly to the CEO. The main responsibil-ity of this position is to run the marketing operations of Delta Gizmo successfully. You, as the Marketing Director, believe that the profitability of the company is mainly dependent on the success of its marketing operation. Therefore, you feel that your position is su-perior to the other positions reporting to the CEO. You personally believe that, since your appointment as the Marketing Director, the success of Delta Gizmo has been due primarily to the excellent job you have done in marketing the products, leading to strongly increas-ing sales over the years.
The best way to increase sales, you believe, is to run successful promotions regularly for the key products, to keep them highly visible in the public eye. You claim that “stretch forecasts” (i.e., forecasts adjusted upwards from the statistical predictions given by the computerised forecasting system) have to be made for two important reasons: (1) to ensure that stock is available in case a promotion is very successful and results in unexpectedly high sales; and (2) because higher forecasts act as an incentive for the sales staff to do their very best. If the forecast is on the low side, you worry that the sales staff may well adopt a relaxed attitude, rather than putting in more effort to reach their targets. There is now a revised bonus system (strongly pushed by the CEO to stop the over-forecasting) which has been designed to counter this possibility, but you are not so sure of its effects. After all, “stretch forecasts” have worked well in the past and you do not think that the cost of extra stock is your problem. You are also eager to make sure that the final forecasts reflect the considerable Market Intelligence you bring to the Forecast Committee. You are concerned that the Forecasting Executive is too keen on the computer forecasts. Furthermore, you believe that his/her knowledge of forecasting is a bit doubtful at times. You are also worried that the Production Executive is becoming increasingly forceful in seeking to lower the forecasts. S/he does not even mind taking it to the point where, as happened in a few instances last year, the stock ran out completely, costing the company lost sales. You have been mentioning this regularly to keep him/her aware of the risks of dropping the forecasts.
B.3. The Production Director
The Production Director is one of the executives who report directly to the CEO. The major respon-sibility of this position is to run a successful opera-tion of Delta Gizmo’s manufacturing facility. You, as the Production Director, believe that the profitability of the company is mainly dependent on the success of its manufacturing operations in reducing the pro-duction costs. Therefore, you feel that your position is superior to the other positions reporting to the CEO. You personally believe that, since your appointment as the Production Director, the success of Delta Gizmo has been due primarily to the excellent job you have done in the manufacturing facility, resulting in strong decreases in costs each year. Over the last few years, the unit costs have been driven down by persistent im-provements in the manufacturing process, as well as through the intense involvement of all of the manufac-turing employees in the improvement program.
You firmly feel that there is strong evidence sup-porting your belief that the reduction in the cost base has been the major reason for the strong sales growth. Thus, you disapprove of the overly proud behaviour of the Marketing Director, who seeks to take all of the credit for the sales growth for himself/herself. Further-more, you are upset that so much money has been lost over the last few years in excessive inventory due to overly optimistic sales forecasts. This has been, you believe, the result of the Marketing Director’s insis-tence on “stretch forecasts” — i.e., his pressure to ad-just the forecasts upwards from the statistical predic-tions given by the computerised forecasting system. Hence, you are determined to do what you can to make sure that the forecasts are realistic. This may be diffi-cult, as the Marketing Director is a strong individual, and if they do run out of stock due to your actions, you know you will be held responsible. This has happened a few times in the last year and they still remind you of those instances in the meetings.
Appendix C. Sample form given to participants in the ‘Forecasting Executive’ role
SeeFig. C.1.
Last promotion period: 11 Model forecast for period12: 141
Fig. C.1. Sample time series.
“The model forecast seems not to have taken the impact of a promotion in the last period into consid-eration. A more dramatic fall in the sales is generally observed in the period immediately following a pro-motion. Thus, this base forecast needs to be adjusted to take this impact into consideration. It would be much more realistic to set it lower than the model forecast”. Your forecast for period 12:
Appendix D. Sample form given to participants in the ‘Marketing Director’ role
SeeFig. C.1.
Last promotion period: 11 Model forecast for period12: 141
Script for your role as the Marketing Director: “It is true that the sales typically fall markedly following a promotion period. However, for this product we do not expect that it will fall below the ongoing average sales. Therefore, we believe that the forecast can be set higher”.
Your forecast for period 12:
Appendix E. Sample form given to participants in the ‘Production Director’ role
SeeFig. C.1.
Last promotion period: 11
Model forecast for period12: 141
Script for your role as the Production Director: “Sales usually hit a dip right after a promotion. This forecast does not appear to take such an impact into consideration sufficiently. We need to be really careful and reduce the forecast so that we do not end up with a huge inventory. Our suggestion is to set a lower figure”.
Your forecast for period 12:
References
Ang, S., & O’Connor, M. (1991). The effect of group interaction strategies on performance in time series extrapolation. International Journal of Forecasting, 7, 141–149.
Armstrong, J. S. (2002). Assessing game theory, role playing, and unaided judgment. International Journal of Forecasting, 18, 345–352.
Armstrong, J. S. (2006). Findings from evidence-based forecasting: methods for reducing forecast error. International Journal of Forecasting, 22, 583–598.
Bateson, N. (1966). Familiarization, group discussion and risk taking. Journal of Experimental Social Psychology, 2, 119–129. Blattberg, R. C., & Hoch, S. J. (1990). Database models and managerial intuition: 50% model +50% manager. Management Science, 36, 887–899.
Brown, R. (1965). Social psychology. New York: Free Press. Clemen, R. T. (1989). Combining forecasts: a review and annotated
bibliography. International Journal of Forecasting, 5, 559–583. Collins, B. E., & Guetzkow, H. (1964). A social psychology of group
processes for decision-making. New York: Wiley.
Cooke, R. A., & Kernaghan, J. A. (1987). Estimating the difference between group versus individual performance on problem-solving tasks. Group Organization Management, 12, 319–342. Cronin, M. A., & Weingart, L. R. (2007). Representational gaps,
informational processing and conflict in functionally diverse teams. The Academy of Management Review, 32(3), 761–773. Dearborn, D. C., & Simon, H. A. (1958). Selective perception:
a note on the departmental identification of executives. Sociometry, 21, 140–144.
Edmundson, R., Lawrence, M., & O’Connor, M. (1988). The use of non time series information in sales forecasting: a case study. Journal of Forecasting, 7, 201–211.
Einhorn, H. J., Hogarth, R. M., & Klempner, E. (1977). Quality of group judgment. Psychological Bulletin, 84, 158–172. Erden, Z., von Krogh, G., & Nonaka, I. (2008). The quality of group
tacit knowledge. Journal of Strategic Information Systems, 17, 4–18.
Fildes, R., Goodwin, P., & Lawrence, M. (2006). The design features of forecasting support systems and their effectiveness. Decision Support Systems, 42, 351–361.
Fildes, R., Goodwin, P., Lawrence, M., & Nikolopoulos, K. (2009). Effective forecasting and judgmental adjustments: an empirical evaluation and strategies for improvement in supply-chain planning. International Journal of Forecasting, 25, 3–23.