м о д а Ь і ш е AN»
о р т ш іs a t ío n o f Т В В Ш 0 Н A » î ï : s'-®MAÏNTSNÂÎiCE SYSTEM
SÏMXTL'AT
ïON
V ■· î V-' l·./ '^ ':'у г \ rr^r^^ гГ‘Т- Γ β î Q'·’· Ί·
"'г-’"'с г к г Г г
MODELLING AND OPTIMISATION OF
TURKISH ARMY 5^“ LEVEL RENOVATION
MAINTENANCE SYSTEM VIA SIMULATION
A THESIS
SUBMITTED TO THE DEPARTMENT OF INDUSTRIAL ENGINEERING AND THE INSTITUTE OF ENGINEERING AND
SCIENCE OF BILKENT UNIVERSITY
IN PARTIAL FULFILMENT OF THE REQUIREMENTS FOR THE DEGREE OF
MASTER OF SCIENCE
By
Reşat Ali TÜTÜNCÜOĞLU JULY, 2000
f e 0 5 3 0 4 4
I certify that I have read this thesis and in my opinion it is fully adequate, in scope and in quality, as a thesis for the degree of Master of Science.
t
Assoc. Prof. İhsan Sabuncuoğlu (Principal Advisor)
I certify that I have read this thesis and in my opinion it is fully adequate, in scope and in quality, as a thesis for the degree of Master of Science.
C 1 ^
___V i i \ ____M U M
a... .
Assoc. Prof. Selim Aktiirk
I certify that I have read this thesis and in my opinion it is fully adequate, in scope and in quality, as a thesis for the degree of Master of Science.
Assoc. Prof Erdal Erel
Approved for t ^ Institute of Engineering and Science
ABSTRACT
MODELLING AND OPTIMISATION OF TURKISH
ARMY 5™ LEVEL RENOVATION MAINTENANCE
SYSTEM VIA SIMULATION
Reşat Ali Tütüncüoğlu
M.S. in Industrial Engineering
Advisor: Assoc. Prof. İhsan Sabuncuoğlu
Logistics is the application of time and space factors to war. It is the economics of warfare, and it comprises, in the broadest sense, the three big M's of warfare; material, movement, and maintenance. This thesis employing the simulation tool as an effective vehicle for defining the path from competitive concepts to real word solutions, modelling Turkish Army's 5 Level Renovation System and bringing up ways of optimisation. Steady state performances of the renovation unit are measured. Different types of configurations are tested and their advantages and disadvantages are discussed.
ÖZET
SİMULASYON KULLANARAK TÜRK KARA
KUVVETLERİ 5NCİ KADEME YENİLEŞTİRME
BAKIM SİSTEMİNİN MODELLENMESİ VE
OPTİMİZASYONU
Reşat Ali Tütüncüoğlu
Endüstri Mühendisliği Bölümü Yüksek Lisans
Danışman: Doç. İhsan Sabuncuoğlu
Logistik zaman ve alan faktörlerinin savaşa uygulanma şekli, savaşın ekonomisi ve tamamlayıcısıdır. Daha geniş bir ifadeyle, savaşta üç önemli faktör olan; ikmal malzemesi, hareket imkan kabiliyeti ve bakımın bütünüdür. Bu tez çalışması simulasyonu etkili bir araç olarak kullanarak rekabet sağlayıcı konseptleri gerçek hayata taşımak için Türk Kara Kuvvetleri 5nci kademe yenileştirme sistemlerinin modellenmesini ve optimizasyon yollarının gösterilmesini ifa etmektedir. Bu çalışmada yenileştirme ünitesinin sabit dönem performansları belirlenmiş ve değişik tipteki konfigürasyonlar test edilerek avantaj ve dezavantajları tartışılmıştır.
ACKNOWLEDGEMENTS
I would like to express my deep gratitude to Dr. İhsan Sabuncuoğlu for his guidance, attention, understanding, and patience throughout all this work.
I am indebted to the readers Selim Aktürk and Erdal Erer for their effort, kindness, and time.
I cannot fully express my gratitude and thanks to my uncle, aunt, and friends for their care, support and encouragement.
CONTENTS
List of Figures XI
List of Tables XIII
Glossary XV
I. INTRODUCTION I
I.L The Army Logistics 1.1.1. General
1.1.2. The Turkish Army Logistics Mission 1.1.3. The Logistics Processes
1.1.4. Logistics Principles
1.1.5. Maintenance System in Turkish Army
1.2. Simulating of the 5*'' Level Maintenance System Renovation Units in Turkish Army
2. LITERATURE SURVEY 10
3. SIMULATION OF THE RENOVATION UNIT IN 1011 MAIN REPAIR
DEPOT 16
3.1. Formulation of problem and plan study 3.2. Model Development
3.2.1. Conceptual model 3.2.1.1. Events
3.2.1.2. Entities and Attributes 3.2.1.3. Activities
3.2.1.5. Endogeneous Variables: 3.2.1.6. Assumptions of the Model
3.2.1.7. Initial Conditions and Operational Rules 3.2.2. Logical model
3.2.3. Simulation Model (Code)
3.3. Verification and Validation of the Model 3.3.1. Veriflcation of the Existing Model 3.3.2. Validation of the Existing System
3.3.2.I. Face Validity
3. THE EXPERIMENTS AND OUTPUT ANALYSIS 32
3.1. Determination of the Warm-up Period 3.2. Determination of the Run Length
3.3. Determination of the Total Sample Size Required 3.4. Output Analysis of the Existing System
3.5. Optimisation of the Existing System with Using Genetic Algorithms. 3.5.1. Optimisation algorithm
3.5.2. Results and Discussions
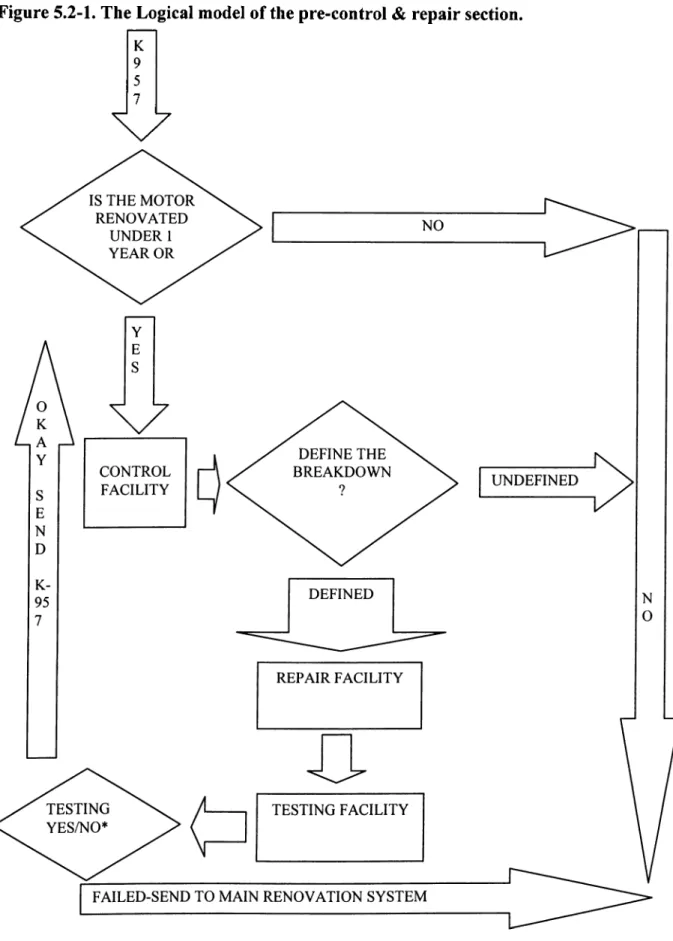
5. PRE-CONTROL & REPAIR SECTION 56
5.1. Purpose 5.2. Introduction
5.2.1. Advantages of the pre-control & repair section 5.2.2. Disadvantages of the pre-control & repair section
5.2.3. The subdivisions of pre-control & repair section and technical data
5.2.4. Simulation code of the pre-control & repair section. 5.3. The Results
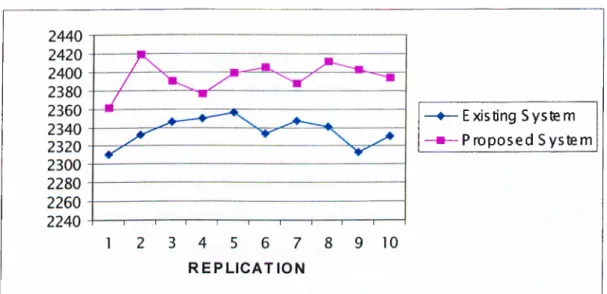
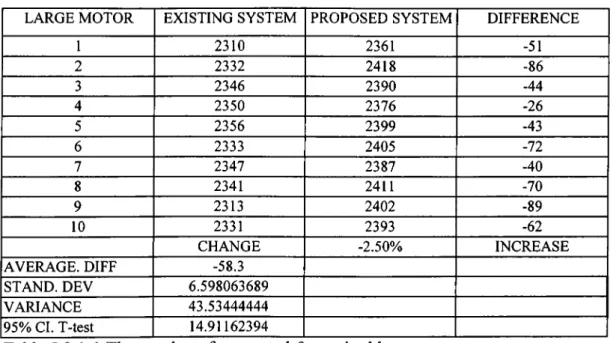
5.3.1. Comparison of the number of renovated & repaired large type motors.
motors
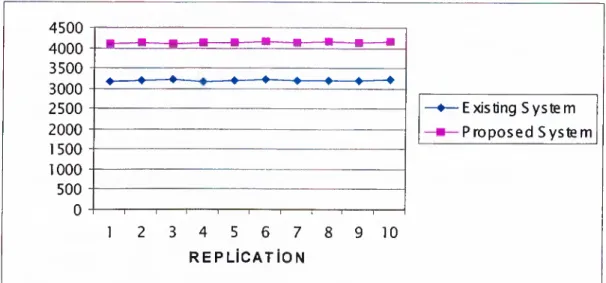
5.3.3. Comparison of the number of renovated & repaired unimog type motors.
5.3.4. The alternative situations:
5.3.4.1. The changes in selection rate.
5.3.4.2. Decreasing the capacity of the resources. 5.4. Conclusion
6. COMBINED PARALLEL RESOURCES SYSTEM 72
6.1. Purpose 6.2. Introduction
6.2.1. Advantages and disadvantages of the combined parallel resources system:
6.2.2. Simulation code of the combined parallel resources system. 6.3. The Results
6.3.1. Comparison of the Existing & Proposed Systems
6.3.1.1. Comparison of the existing and proposed systems for large motors.
6.3.1.2. Comparison of the existing and proposed
6.3.1.3. Comparison of the existing and proposed systems 6.3.1.4. Comparison of the queue lengths.
6.3.1.5. Comparison of the Utilisations.
6.3.2.5. Comparison of the breakdowns in systems. 6.4. Conclusion
7. INCREASED READY SPARE PART USAGE 7.1. Purpose
7.2. Introduction
7.2.1. Advantages and disadvantages of using the spare parts
7.2.3. The technical data to support the effect of the spare part usage. 7.3. The Results
7.3.1. General
7.3.2. Comparison of the Existing & Proposed System for Large Motors.
7.3.3. Comparison of the Existing & Proposed System for the Small Motors.
7.3.4. Comparison of the Existing & Proposed System for Unimog Motors.
7.4. Conclusion: 8. CONCLUSION
8.1. What does it mean for the army? 8.2. General Conclusion
8.2.1. Existing and Optimised System 8.2.2. Pre-control and Repair Section
8.2.3. Combined Parallel Resources System 8.2.4. Increased Ready Spare Part Usage 8.2.5. Comparison of all the proposed systems 8.2.6. Further Research Areas
97 Bibliography Appendix A Appendix B Appendix C Appendix D 104 107 123 155 168
List of Figures
Figure 1-1. 2"‘* Level Maintenance Sections. 4
Figure 1-2. 1011 Main Repair Depot. 7
Figure 1-3. Flow Shop. 8
Figure 3 -1. Structure of development. 17
Figure 3-2. Renovation Unit system 21
Figure 3-3. 5*'’ Level 22
Figure 3-4. Motor Renovation Unit (General). 23
Figure 3-5. Motor Renovation Unit. 24
Figure 4-1. Sub-section throughput versus time. 35
Figure 4.4-1. Average time in queues. 38
Figure 4.4-2. Average time in resources. 41
Figure 4.4-3. Average utilisation in resources. 43
Figure 4.5-1. Progress graph motor renovation unit. 53 Figure 5.2-1. The Logical model of the pre-control & repair section. 61 Figure 5.3.1-1. The number of renovated & repaired large type motors. 64 Figure 5.3.2-1. The number of renovated & repaired small type motors. 66 Figure 5.3.3-1. The number of renovated & repaired small type motors. 67 Figure 5.3.4-1. The observations at the number of repaired motors. 69 Figure 5.3.4-2. The utility of the “Addrepair” Subdivision at different selection
rates. 70
Figure 6.2-1. The logical system of the combined parallel resources system. 75 Figure 6.3.1-1. The differences between systems, for large motors. 78 Figure 6.3.1-2. The differences between system, for small motors. 79 Figure 6.3.1-3. The differences between systems, in terms of renovated Unimog
motors. 80
Figure 6.3.1-4. Queue length differences between systems. 82 Figure 6.3.1-5. Queue length differences between systems. 83
Figure 6.3.1-6. Utilisation differences between systems. Figure 6.3.1-7. Utilisation differences between systems.
Figure B.1-1. Large motors sub-section's utilisations versus time. Figure B.1-2. Small motors sub-section's utilisations versus time. Figure B.1-3. Unimog motors sub-section's utilisations versus time.
85
86
123 124 125 Figure B.1-4. Renovation unit's testing and packing sections utilisations versus
List of Tables
Table 3.3.2-1. Throughput of the existing system. 27
Table 3.3.2-2. Historical data about the actual system. 28
Table 3.3.2-3. Comparison for the large motors. 29
Table 3.3.2-4. Comparison for the small motors. 29
Table 3.3.2-5. Comparison for the unimog motors. 30
Table 3.3.2-6. The average breakdowns in the simulation model. 31 Table 3.3.2-7. Comparison for the actual and the simulation model. 31
Table 4.3-1. Required Sample Sizes. 37
Table 4.4-1. Throughput of the system. 45
Table 4.5-1. Sensivity analysis of the over utilised sections. 50 Table 4.5-2. Results of increased capacities in the existing system. 50 Table 4.5-3. A list of elements in the objective function. 51
Table 4.5-4. The list of factors. 52
Table 4.5-5. Capacity changes. 54
Table 4.5-6. Overall results of the evaluation procedure. 55 Table 5.3-1. The number of renovated & repaired vehicle motors. 63 Table 5.3-2. The combined number of renovated & repaired vehicle motors. 63 Table 5.3.1-1. The number of renovated & repaired large type motors. 65 Table 5.3.2-1. The number of renovated & repaired small type vehicle motors. 66 Table 5.3.3-1. The number of renovated & repaired unimog motors. 67 Table 5.3.4-1. The maximum selection rate and the number of repaired motors. 68 Table 5.3.4-2. The information for the capacity changes. 71 Table 5.4-1. Average cost changes for proposed system 1. 71 Table 6.3-1. The results of the combined parallel resources system. 76 Table 6.3.1-1. The number of renovated large type motors for both systems. 78 Table 6.3.1-2. The number of renovated small motors for both systems. 79 Table 6.3.1 -3. The number of renovated unimog motors for both systems. 81
Table 6.3.1-4. Comparison of the block renovation section queue lengths. 82 Table 6.3.1-5. Comparison of the crank renovation section queue lengths. 83 Table 6.3.1-6. Comparison of the block renovation section utilisations. 84 Table 6.3.1-7. Comparison of the crank renovation section utilisations. 86
Table 6.3.1-8. Comparison of the breakdowns. 87
Table 6.4-1. Average cost changes for the proposed system 2 88 Table 7.3-1. The results of the changes on the existing system. 92 Table 7.3-2. Comparison of the number of renovated large type motors. 93 Table 7.3-3. Comparison of the number of renovated small motors. 94 Table 7.3-5. Comparison of the number of renovated unimog motors. 95
Table A -1. The capacities and operation times. 107
Table A-2. Applied triangular approach to the processing times. 108
Table A-3. Parameter set of the model. 109
Table A-4. Entity flow rates. 109
Table B.4-1. Summary statistics of the existing system. 139 Table B.4-2. Summary statistics of the optimised system. 154 Table D-1. Cost of pre-control and repair section implementation 170 Table D-1. Cost of combined parallel resources system implementation 171
Glossary
MAINTENANCE: It is the function of sustaining material and facilities in an operational status, restoring them to a serviceable condition or upgrading their functional utility through modification.
These facilities are cleaning, control, testing, lubrication, readiness for duty, adjusting, squeezing, repair, rectification, and renovation.
REPAIR: The workmanship to change the condition of the breakdown army materials to a healthy state.
CHANGING: Exchanging the breakdown army material with a new or renewed material.
RENOVATION: The process for testing and defining the performance of the army goods and by repairing or renewing, the army goods became as a new good.
RECTIFICATION: To add some new properties.
MILITARY WORDS’ TURKISH MEANINGS
Army:
Ordu, involves approximately 9 brigades. Its Commander is full-general.Corps:
Kolordu, involves approximately 3 brigades. Its commander islieutenant general.
Brigade:
Tugay, involves approximately 3 battalion task forces and 6000Battalion:
Tabur, involves approximately 3 company teams. Its commander islieutenant colonel.
Company:
Bölük, involves approximately 4 platoons. Its commander iscaptain.
Platoon:
Takım, involves approximately 50 persons. Its commander is firstlieutenant or second lieutenant.
Chapter 1
INTRODUCTION
In this chapter, first a brief information is given about the army logistics and the problem undertaken in this thesis.
1.1. The Army Logistics
1.1.1. General
Logistics is the art and science of creating and maintaining a military capability. Its purpose is to create weapons and forces and then provide sustained support to these weapons and forces in combat.
A wide range of multi layered, external forces influence army logistics. Within the realm of military activities, logistics is the bound to strategy and tactics. Military activities fimction in an environment, which is driven by national objectives and policies and shaped primarily by socioeconomic and political factors [9].
Logistics contributions encompass the means to equip and sustain the army in its role to support Republic of Turkey’s national policy and military strategy.
1.1.2. The Turkish Army Logistics Mission
The basic mission of the Army Logistics is to support the soldier in the field with what is needed, where, when, and in the condition and quantity required at minimum expenditure of resources [7].
1.1.3. The Logistics Processes
Requirement Determination: The process is the statement of need, together with the definition of the resources necessary to accomplish the stated need.
Acquisition: The translation of the need from requirement to terms suitable for acquisition. The obtaining of what is needed by leasing, buying, recruiting, and constructing. Acceptance and compensation for value received.
Distribution: This process involves all logistical aspects of moving, receiving, storing, handling, and issuing material into the Army supply system.
Maintenance: It is the function of sustaining material and facilities in an operational status, restoring them to a serviceable condition: or upgrading their functional utility through modification. In Section 1.5, a detailed information is given.
1. Direct Maintenance Support. Maintenance performed on material while it remains under the custody of the using military commands. Upon restoration to serviceable condition, the material is normally returned directly to service.
2. Indirect Maintenance Support. Maintenance performed on material after its withdrawal from the custody of the using military command. Upon restoration to serviceable condition, the material is returned to stoek for reissue or returned
directly to the user under conditions authorised by the military department concerned.
Disposal: This process involves the purging of excess, obsolete, or surplus material, supplies and real property; making such items available to other prospective users; and effecting maximum possible recovery of value of items [8].
1.1.4. Logistics principles
Logistics principles can be listed as follows:
-Promote combat efficiency of the armed services as a whole by prevention of unnecessary duplication of facilities, services, supplies, and equipment.
- Design logistics systems for expansion to meet peak loads they will face in an emergency.
- Be responsive to operational and technical requirements of commanders.
- Avoid depriving operational units of essential support.
- Provide for administrative control by one service where facilities are used jointly.
- Provide for operational control of personnel [16].
1.1.5. Maintenance System in Turkish Army
1. Unit Maintenance: Unit maintenance is the maintenance for which the using
organisation is responsible and it is performed on assigned equipment. The phases normally consist of inspecting, servicing, lubricating, adjusting, and replacing parts, minor assemblies, and sub-assemblies [15]. This level of maintenance is done by two sub-levels:
-U‘ Level Maintenance Unit: The user of the army good, operator of vehicle, or crew of the gun system and vehicle, do it. It is called also as preventive maintenance. Everybody is responsible from the level maintenance.
-2"** Level Maintenance Unit: Special trained technical personnel do this level. In this level, there are special equipment, additional parts, and measurement devices for doing jobs that could not be done at level. In eveiy battalion, there is 2nd level 2nd section maintenance service, and every company has 2"‘' level section maintenance group. II HEADQUARTER AND SERVICE COMPANY T 2'^'^ LEVEL 2'^'^ SECTION X ANOTHER SUB-UNITS 2'^'^ LEVEL U^SEC. X PLATOONS
2. Direct Support Maintenance (DS): Direct Support (DS) maintenance is
performed in support of the user. It is characterised by forward orientation, repair by replacement, and provides mobile, responsive “one-stop" maintenance support. Direct support maintenance is done b y ,
-3'^^ Level Maintenance Units: With trained personnel, direct support union does
it. This level of maintenance unions has equipment and sets for Union Maintenance, measurement devices. Moreover, they make more detailed maintenance than 2"^ level maintenance. These units have also 100% mobile capacity. In every brigade, there is an Ordnance company and it is called the 3"^^* level [15].
3. General Support Maintenance (GS): General Support maintenance is
performed in support of the theater (battlefield area) supply system. It is characterised by semi-fixed facilities with job or production line operations. General support maintenance is done by:
-4*'’ Level Maintenance Units: These units are located at echelons above corps, and repair of class VII and class IX items. Generally every division and army corps has
4“’ level Maintenance Union. In total, there are twelve 4“’ level maintenance unions
in the Army [18].
4. Depot Maintenance: This level of maintenance is the responsibility of the Army
Material Command (AMC). It is performed by organic Army depots and commercial contractors. Depot maintenance augments depot stocks of serviceable material and supports unit and intermediate maintenance activities by using more extensive shop facilities, and personnel of higher technical skill than are available at lower levels of maintenance. Tasks in this level normally consist of the following: inspection and testing; modification; analytical; calibration; overhaul; and fabrication of items not supported by the supply system in support of national
maintenance point (NMP) requirements. This level of maintenance is oriented toward support of the supply system at both theater and national levels. Organisations are fixed or semi-fixed. Maintenance at this category will be primarily production line oriented and will be performed by selected commodity oriented organisations. Depot maintenance is done by:
-5 Level Maintenance Units: This level includes overhaul, rebuild, modification, calibration, analytical, special and non-destructive testing/inspection cannibalisation, and fabrication of items not supported by the supply system. Normally, this level increases the stock rates by manufacturing additional and renewed parts. In addition, this level makes some special technical calibrations. [17]
1.2. Simulating of the 5
Level Maintenance System
Renovation Units in Turkish Army
Computer simulation has been widely used tool for studying the dynamics of the real world systems to see its behaviour in response to the changes in the environment. The application areas cover a wide range, especially the cases where the system to be analysed is too complex to be modelled and studied analytically. Production and logistics simulations include those applications that assist in determinations of logistics requirements, system productivity assessments, and industrial base appraisals. These simulations support the Army's procurement, transportation, and maintenance of personnel, material, and facilities.
th
In the Turkish Army, there are five depots at 5 Level Maintenance for Ordonnance Goods. These are:
1009 Main Repair Depot in KAYSERI for Tanks (Tracked Vehicles) 1010 Main Repair Depot in ARIFIYE for Tanks.
1013 Main Repair Depot in TUZLA for small type Vehicles.
1011 Main Repair Depot is one of the most important depots of the Turkish Army that supports all of the Army Units. 1011 Main repair depot has five subdivisions (See Figure 1-2).
i o n Main Repair Depot
Headquarters Quality and Control
Technical Directerate
Chief o f supply Support Group Commander
Figure 1-2. 1011 Main Repair Depot.
According to the orders of the Turkish Army Headquarters, the production and production planning for the facilities are done at the Technical Directorship. There are eight main units. These units are mostly production line oriented.
These units are motor renovation unit (Wheeled vehicles), drive-train renovation unit, arms renovation unit, spare part manufacturing unit (Hard materials), 2"‘* Spare part manufacturing unit (Plastics and tire spare parts), battery manufacturing unit, tire renovation unit, paint manufacture unit.
As seen in the above, the depots (military factory) have many departments and it is difficult to collect all data and constitute the simulation model. In this study, computer simulation is used to analyse the largest department, called renovation unit. In addition, this department has the same characteristics with other depots. By simulating and analysing the renovation unit, we will try to understand the general problem areas and the possible solutions.
The renovation unit can be classified as a flow shop (Fm). There are m machines in series. Each job has to be processed on each one of the m machines. All jobs have the same routing, that is, they have to be processed on machine 1, then machine 2 and so on. After completion on one machine, a job joins the queue at the next machine. All queues operate under the first in first out (FIFO) discipline; that is, a job can not “pass” another while waiting in queue (see Figure 1-3) [26].
ist
m. machine 1^^ Job on 1 machine 2^* Job on 1 1 ^
2nd m. machine Job on 2 2^* Job on machine 2 1--- > 3rd m. V' Job on 2^' Job on 1---^ machine 3 machine 3 '---Figure 1-3. Flow Shop.
The renovation processes are carried out by using various machines in the sections. There are mainly three products and sub-units for each type of motor. These products are renovated large, small and unimog type motors. There are about 200 workers in the renovation unit for dismantling, renovating, assembling and testing operations. Most of the workers are equally qualified.
Renovation lead times for the products are known approximately by the past experiences. Production planning is done very roughly based on these data, the state of machines and workers.
The rest of the thesis is organised as follows: In Chapter 2, a brief review of the literature is given. The renovation department is described in Chapter 3. First, a general view of the system is given and the simulation model is explained in detail. The elements of the simulation model, their relationships, and the flow of
the entities that represent the products are explained. The data requirement is also discussed. Finally the model is verified and validated. Output data analysis is performed in Chapter 4. Determination of the warm-up period and the run lengths, sample size and steady state performance measures are explained. In this chapter, genetic algorithm is used to optimise the system’s utilisation and throughput. In Chapter 5, an additional unit is applied to the simulation model and simulation experiments performed to see the effect of the alternative configurations. In Chapter 6, the existing system is modified from flow shop to flexible flow shop to discuss the effects on the simulation model. In Chapter 7, the effects of the ready spare part usage on the simulation model are investigated. In Chapter 8, the results of the simulation study are discussed and further research topics are stated.
Chapter 2:
LITERATURE SURVEY
Simulation has been applied extensively and successively to a wide range of military problems, including wargaming, acquisition, logistics, and communication. The use of modelling and simulation is most prevalent in the areas of engineering and manufacturing. Many commercial simulation languages (e.g. Awesim, Arena, and Automod) are used in weapon system design, production, and maintenance (Kang and Roland, [19]).
Manufacturing is one of the earliest simulation application areas (Naylor et al. [22]) Simulation provides a method for finding answers to questions about the behaviour of manufacturing system. Savolainen et al. [30] indicate that simulation models are really formal descriptions of real systems to understand conditions as they exist in the system today and to achieve a better system design through performing what-if analysis. Also, Law and McComas, [21] have given the steps of the simulation of the manufacturing systems.
The use of modelling and simulation in manufacturing is aiming toward a future “virtual manufacturing” environment. In this approach the operational requirements identified in the synthetic battlefield environment are translated into design concepts. These designs are passed along to a network of distributed manufacturing processes, facilities, and tooling requirements. This vendor base is
the closest to the manufacturing processes and is in the best position to develop cost and schedule estimates. These estimates may then be fed back to provide better estimates of costs and schedules to support trade-offs and system-level alternative evaluation in cost and operational effectiveness analysis (Piplani et al. [27]).
There have been many trends in manufacturing methods. Types of manufacturing systems are defined by Harrell and Tumay [11]. These are project shop, job shop, cellular manufacturing, flexible manufacturing systems, batch flow shop, and line flow systems.
An overwiew of how simulation modelling techniques can be employed in the design and analysis of advanced manufacturing systems are presented Evans and Biles [5].
While doing literature review, it is noted that there are too many studies in manufacturing and logistics area, but there are limited studies, involving both military and manufacturing (maintenance) systems. There are some studies in the USA Armed Forces, but they are usually classified and hence, not accessible. For this reason, we will present a few studies in the maintenance of military systems.
Parsons and Krause [24] studied about the tactical logistics and distribution systems simulation to response to changing technology. New supply and distribution techniques employing a wide variety of equipment combinations both existing and proposed systems are tested.
John D. lanni [13] studied maintenance simulation in the US. Air Force to decrease the cost for requirements of the missions. In his study, he determined life cycle cost and maintenance problems. The research addresses how the usage of the human figure models can be used to simulate maintenance.
Larry Jenkins [14] developed a simulation model to schedule the inspection of machine breakdowns that can be used for field maintenance systems. The aim of the study, if a machine (vehicle) breaks down because of failure of a compenent, cost of lost production and repair will be greater than if the part is replaced earlier in a routine inspection (maintenance). Simulation was conducted using FORTRAN and BASIC. The program tabulates for each of compenent the number of breakdown replacements, the number of replacements on inspection, and inspection frequency that minimise total cost.
Harvey et al. [12] studied and developed a SLAM II model to simulate the C- 141 Depot maintenance for defining resource requirements. There are about 275 C-141 aircraft in the US. Air Force. Approximately every six monts each aircraft is flown to depot and undergo to the programmed periodic depot maintenance (PDM). PDM is a process that inspects and repairs as a mechanical, electrical, hydraulic, and structural compenents of the aircraft. Simulation was chosen as the evaluation tool for this project due to its ability to handle complex requirements for resources, as well as the stochastic processing times. First the initial model built up and was used to determine the achievability of present throughput goals to identify bottlenecks within the system then proposed model built and compared with the existing system. The study is resembling our study with respect to military depot maintenance and the structural design of the maintenance unit.
There are three main approaches in discrete event simulation models (see Pritsker, pages: 54-58 [25]): Event orientation, activity scanning orientation, and process orientation.
Garzia, and Zeigler [10] explain the structure and development of discrete event simulation models together with simulation languages. They emphasize the
importance of event list by saying that “ the heart of a simulation program is the event list, an ordered list of everything that happens during the simulation”
Ronald D. Painter [23] indicates that the immediate need facing the military simulation community is to agree on and build a framework for object-oriented simulations due to requirement of rapid definition of the simulation objects and standardization of the systems.
There are also three main procedures for gathering observations in simulation: The replication method, the subintervals (batch means) method, and the cycles method. In all methods, initial warm-up period is allowed for the system to reach steady state. In the replications method, observations are gathered from separate runs having the same initial conditions but different sequence of random numbers. In our study, an event oriented discrete simulation model is developed. Observations for the experiment are gathered by using the replications method.
Jerry Banks [2] explain the importance of selecting software for simulation and selection includes: Input, Processing, Output, Environment, Vendor, Cost. The most popular event oriented discrete simulations are GPSS/H, SLX, S1MSCRIPT.II.5, AweSim, SIMPLE++, and EXTEND. In recent years, many manufacturing-oriented software laguages have been developed. Some of them are ProModel, AutoMod, Taylor II, WITNESS, FACTOR/AIM, and ARENA. In this study, AutoMod simulation software is used. Because it is very powerful in its description of material handling systems. The range of definition is extensive. Numerous control statements and also a separate utility option (AutoStad) is available.
The decision-makers concerned with whether a model and its results are correct. This concern is adressed through model verification and validation.
Robert G. Sargent [28] recommended a procedure for the verification and validation.
Simulation models are built with the intent of studying the behaviour of the real system represented by the model. However, a simulation model generates random outputs. These outputs should be analysed with certain tecniques and concepts to interpret some conclusions about the model, Centeno and Reyes, [3].
The benefits of the planning and proper design can often increase the precision of estimates and strengthen confidence in conclusion in drawn. Farrigton and Swain [6] are described a methodology for manufacturing systems.
There are a number of techniques to find the optimal values of controllable variables through a responce surface generated by simulation of the particular system (Tekin, Sabuncuoglu, [31]). The classification sheme is:
1) Local optimisation Discrete Decision space Continuous Decision space 2) Global optimisation
Genetic Algorithms Tabu Search
Simulated Annealing
Bayesian/Sampling Algorithm Gradient surface Method
The genetic algorithm procedure is a useful procedure when the system has stochastic variables (Stuckman, Evans and Mollaghasemi, [29]). In our study, we used genetic algorithms to optimise certain performance measures of the existing system.
Farhad Azadivar [1] presented the use of simulation in optimisation of maintenance policies and selecting an optimum maintenance policy. In the research, response surface topology is investigated with using genetic algorithms and best decision on the type of maintenance policy and the other characteristics of the system are presented.
Chapter 3
SIMULATION OF THE RENOVATION
UNIT IN 1011 MAIN REPAIR DEPOT.
In this study, simulation is used to analyse the behaviour of the renovation unit. Stochastic flow shops can be analysed with both queuing network models and simulation models. For the simple systems, performance measures can be computed mathematically at great savings in time and expense compared to use of simulation model. But for realistic models of complex systems, simulation is usually required. Because queuing models required many simplifying assumptions in the realistic systems. The renovation unit has 27 sections and their storage capacities are bounded. Also the system has stochastic interruptions which can not be modelled by queuing models such as breakdowns. This stochastic and dynamic nature requires simulation.
3.1. Formulation of problem and plan study
The objectives and the scope of the project is to examine the behaviour of the system, to evaluate the existing system and to estimate the performance measures such as, utilisation of resources, queues and their lengths, average number of renovated motors in system and average breakdown rates in system.
In this study, we will investigate the capacity of the existing and proposed systems, the relationships between sub-units, and the effect of hierachical laws on the systems.
Data requirements: The required data for the modelling of the renovation unit is determined and presented in the Appendix A. 1.
The study will be used for understanding the existing system (the way of working of the whole system for finding problematic areas and re-optimising the system). In addition, the end user will be all Turkish Army Maintenance System. They can redescribe their maintenance system and maintenance plans.
We made the following assumptions at the existing system that has no priority for renovation orders, no set-up times, and no back orders. Also distribution system and its requirements are not included in the simulation model.
3.2. Model Development
The model is developed under the structure of the Figure 3.2-1 [20].
Figure 3-1. Structure of development.
3.2.1. Conceptual model
Conceptual model contains elements of the real system, which we believe should be included in our model. These include events, entities, attributes, activities.
exogenous variables, endogenous variables, operational rules, initial conditions, and assumptions of the existing system.
3.2.1.1. Events
In this model the events are preparation of production plans, arrival and departure of motors to the disassembling and washing process, renovation processes, repair processes, assembling processes, testing process, and packing process. A complete list of the events is presented in the Appendix A.2 details.
3.2.1.2. Entities and Attributes
The entities are large size motors, small size motors, unimog size motors, electrical parts, and ftiel oil system parts (carburation parts). The attributes are the type of motors, timestamps for every entity, and part availability.
3.2.1.3. Activities
The activities are the disassembling, washing, block renovation, crank renovation, cylinder bed preparation, piston renovation, 1*‘ and 2"‘* repair, mounting, testing and
packing sections. The detailed activities are also presented in the Appendix A.2.
3.2.1.4. Exogeneous Variables
Exogeneous variables are type of motors and their specifications, number of workers & resources and their capacities, flow processes, operation times, arrival patterns, work-times: A shift of 7.5 hours in a day, operation policies, number of breakdowns and their specifications.
3.2.1.5. Endogeneous Variables:
Endogenous variables are the number of motors, number of the motors waiting for renovation, examination time of processes, sections utilisations and queue lengths.
(1) . State Variables: State of motors, state of renovation orders, status of
sections, rate of disposals, state of queues and queue lengths, state of spare parts availability are the state variables of the system.
(2) . Performance Measures: Waiting times, average time in system, queue
lengths for every section, average renovated motor in system, utilisation of sections, number of disposed motors are the performance measures of the system.
3.2.1.6. Assumptions of the Model
In this study our main goal is to model the renovation unit. Therefore we included only renovation sub-sections and assumed that no beginning set up times for the sections, some data sets and processing times defined by technicians since the difficulty for obtaining data from the processes, no back order is designed in the system and no priority is assumed between the same type of motors.
3.2.1.7. Initial Conditions and Operational Rules
There is no beginning breakdown in the system and spare part levels are known at the beginning in the system. Renovation plans are prepared on one-year basis. The flow process must be applied for each type of motor and the renovation unit works
3.2.2. Logical model
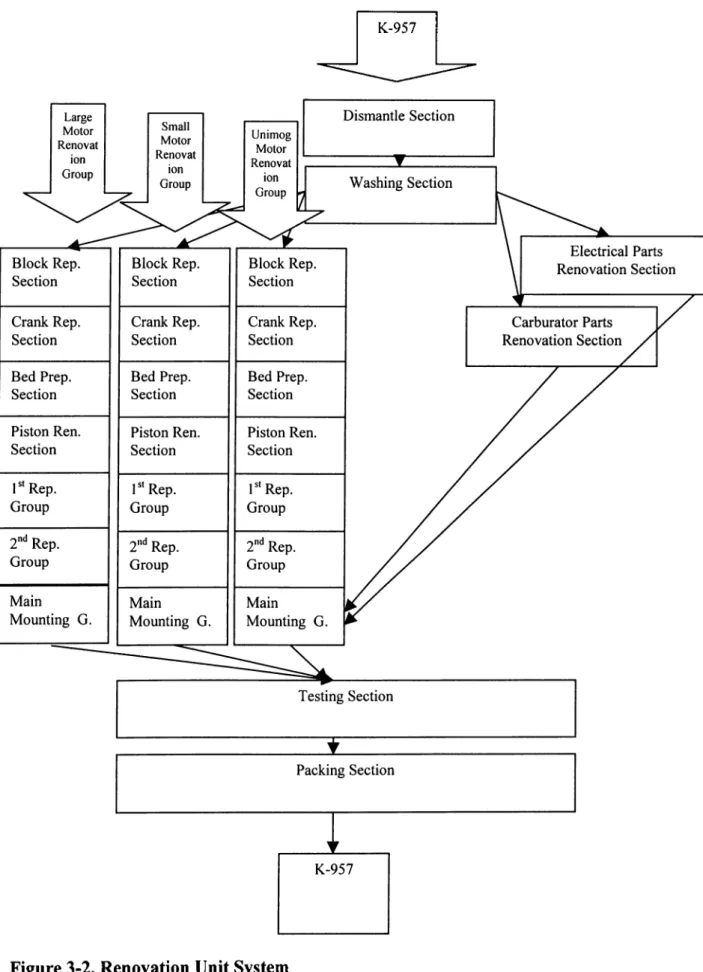
The logical relationships among the elements of the system as well as exogenous variables that effect the system. In Figure 3-2, the general lay-out of the renovation unit is given and then the following flow-charts are presented to describe the logical relation ship of the model.
K-957
Figure 3-3. S“* Level
cTH LEVEL
RENOVATION FACILITY
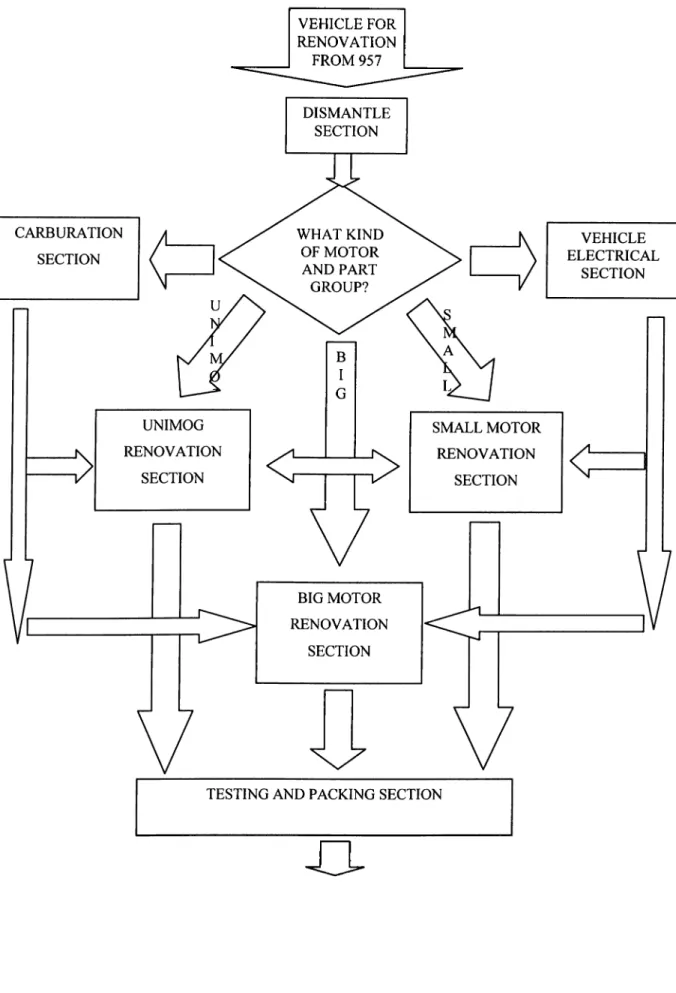
Figure 3-4. Motor Renovation Unit
VEHICLE FOR RENOVATION
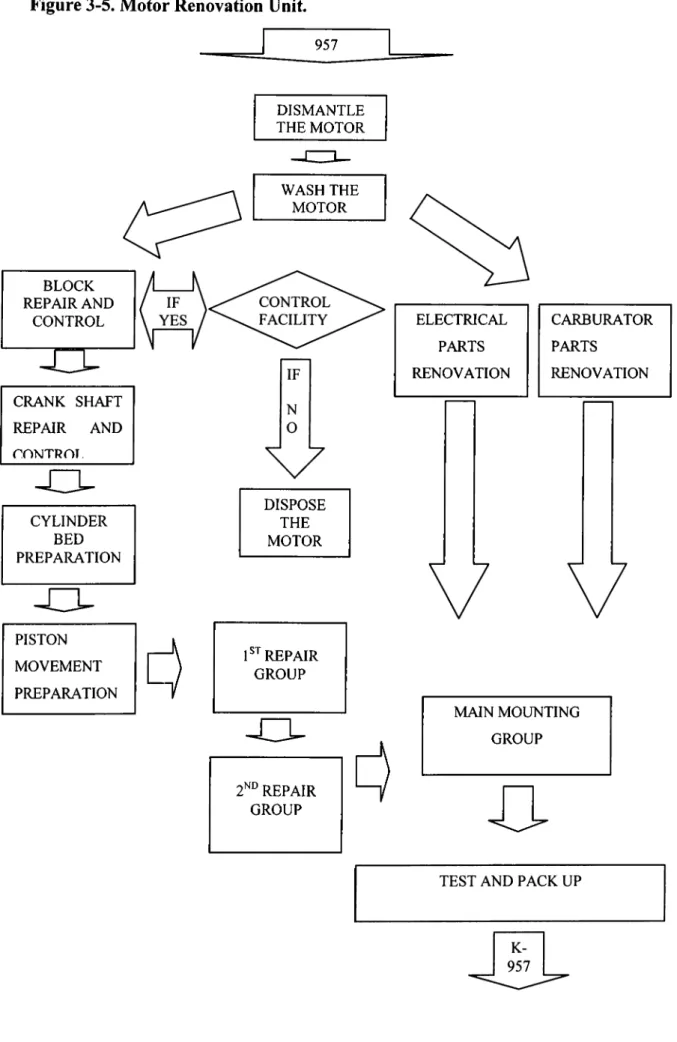
Figure 3-5. Motor Renovation Unit. 957 DISMANTLE THE MOTOR BLOCK REPAIR AND CONTROL CRANK SHAFT REPAIR AND CONTROI CYLINDER BED PREPARATION
J Z L
PISTON MOVEMENT PREPARATION WASH THE MOTOR DISPOSE THE MOTOR REPAIR GROUP 2^·^ REPAIR GROUP ELECTRICAL CARBURATOR PARTS PARTS RENOVATION RENOVATION MAIN MOUNTING GROUPT l ·
3.2.3. Simulation Model (Code)
The model, which executes logic, contained in the logical model. The simulation code of the existing system is developed in AutoMod 9.0 (1999). AutoMod has the ability to define a sequence for moving entities through the system and it enables the modelling system especially manufacturing systems. Autostat which is output data analyse processor of AutoMod that assists to obtain confidence intervals, graphics and so on, it is portable to all types of personnel computers. The source file for renovation unit is about 550 lines and also additional user defined functions, standard library functions, time-specific functions, model communications functions and multi-model synchronisation functions are used in coding processes. The code for this section is at the Appendix A.3.
3.3. Verification and Validation of the Model
3.3.1. Verification of the Existing Model
In this section, the computer program representing the existing system is verified by using certain techniques [2].
Technique 1 (Debugging): In developing the existing system’s simulation model, a computer program is written in form of modules and sub-programs. First, the main part is developed and tested. Then, additional sub-programs and levels of detail are added and debugged successively, until the model is matured to satisfactorily represent the existing system.
Technique 2 (Input and Output Control): The simulation code is run under a variety of settings of the input parameters and checked to see that the output is reasonable.
Technique 3 (Animation): An animation of the simulation model is performed and it is observed that the animation of the simulation output imitates of the existing system.
Technique 4 (Proper Software Selection): With using a simulation package (Automod 9.0) the required number of lines of code are reduced.
Technique 5 (Checking): The computerised representation is checked by 1*‘ Lieutenant Hakan UTKU and Captain Özgür NUHUT.
3.3.2. Validation of the Existing System
Simulation model of a system is only an approximation of the actual system and embodies set of required performance measures. In validating the existing system, the most desired performance measures are used in the validation process and they are repeated whenever the model is improved or changed.
3.3.2.1. Face Validity
As explained below, the model is developed with high degree face validity.
Extensive conversations are made with the experts of the actual system. In modelling the renovation unit, information from such sources as machine operators, manufacturing and industrial engineers, managers and their reports are also referred to the knowledge of the system substantially contributed to the actual validation of the model. Numerous observations are done on the actual system. Data obtained from historical records and sorted during a time study.
3.3.2.2. Statistical Validity
This method is the most definitive test for the validation of the simulation model. The output data obtained from the simulation model is tested for close resemblances to the output data of the actual system [32].
The results of ten replications are presented in Table 3.3.2-1. In this table, each row represents a different replication result. The cumulative sums, averages, standard deviations and the confidence intervals (a=0.05) are shown at the end of the each column.
REPLICATION LARGE MOTOR SMALL MOTOR UNIMOG MOTOR
1 2310 3175 1821 2 2332 3204 1822 3 2346 3212 1825 4 2350 3168 1841 5 2356 3204 1815 6 2333 3216 1880 7 2347 3176 1813 8 2341 3185 1833 9 2313 3184 1861 10 2331 3218 1849 CUM. SUM 23359 31942 18360 AVERAGE 2335.9 3194.2 1836 STAN. DEV 15.26 18.63 21.79 C. I. for 0.05 9.46 11.55 13.50
REPLICATION LARGE MOTOR SMALL MOTOR UNIMOG MOTOR 1 2260 3150 1840 2290 3200 1820 CUM. SUM 4550 6350 3660 AVERAGE 2275 3175 1820 STAN. DEV. 21,21 35,35 28,28 Cl .for 0.05 34,89 58,15 46,52
Table 3.3.2-2. Historical data about the actual system.
When the results (given in Table 3.3.2-1 and 3.3.2-2) are compared using the statistical tests (t-test), it is observed that there are no significant changes, in terms of the averages of the number of the renovated vehicle motors. As a technique, Welch approach [32] is used to validate the existing system's validation process since the historical data and the existing system simulation results are independent and no correlation between each other.
a. Comparison for the large motors.
The Welch approach is applied to see if there is a difference, if any, between the actual and the simulation model. Even though there is 2.67% difference in the number of renovated large motors but the test results shows that the simulation model is not different from the actual system, (See Table 3.3.2-3) because the average difference plus and minus confidence interval (-60.9+191) includes the zero.
ACTUAL SYSTEM LARGE MOTOR YEAR 1998 2260 YEAR 1999 2290 AVERAGE 2275 STAND. DEV. 21.21 CL for 0.05 34.89 X-Y Difference -60.9 CHANGE -0.026 DEGREES OF FREEDOM 1.216 WELCH APPROACH CL for 0,05 191
Table 3.3.2-3. Comparison for the large motors,
b. Comparison for the small motors.
When the same procedure is repeated for the small type of motors, we observed that there is average 0.6% difference in the simulation model. The Welch test again does not detect any statistically significant difference between the simulation model and real system, since the average difference plus and minus confidence interval (-19.2 + 321) includes zero (See Table 3.3.2-4).
REAL SYSTEM SMALL MOTOR
YEAR 1998 3150 YEAR 1999 3200 AVERAGE 3175 STAND. DEV. 35.35 Cl for 0.05 58.15 X-Y Difference -19.2 CHANGE -0.006 DEGREES OF FREEDOM 1.114 WELCH APPROACH CL for 0,05 321.09
c. Comparison for the unimog motors.
When the same procedure is repeated for the unimog, we observed that there is average 0.879% difference in the simulation model. The Welch test result shows that the simulation model is not different from the actual system, (See Table 3.3.2- 5) since the average difference plus and minus confidence interval (-16± 241) includes the zero.
REAL SYSTEM UNIMOG MOTOR
YEAR 1998 1800 YEAR 1999 1840 AVERAGE 1820 STAND. DEV. 28.28 Cl. for 0.05 46.52 X-Y Difference -16 CHANGE -0.008 DEGREES OF FREEDOM 1.250 WELCH APPROACH: Cl for 0,05 241.020
Table 3.3.2-5. Comparison for the unimog motors.
d. Comparison for the breakdowns.
When the simulation model is compared the real system in terms of breakdowns, we see no significant difference, (given in the Table 3.3.2-6 and
3.3.2-7) since the average difference plus and minus confidence interval (-0,8±
REPLICATION EXISTING SYSTEM 1 9 2 13 3 16 4 18 5 11 6 12 7 6 8 11 9 22 10 15 SUM 133 AVERAGE 13,3 STAND. DEV. 4,62000481 Cl for 0.05 0,854199709
Table 3.3.2-6. The average breakdowns in the simulation model.
REAL SYSTEM BREAKDOWNS
YEAR 1998 12 YEAR 1999 13 AVERAGE 12,5 STAND.DEV 0,70 CONF.INT 1,16 X-Y= Difference -0,8 DEGREES OF FREEDOM 5,968 WELCH APPROACH CONF.INT(0,05) 4,155382
Chapter 4:
THE EXPERIMENTATION AND OUTPUT
DATA ANALYSIS
This study is performed to evaluate the performance of the existing system. Having the simulation model developed, verified and validated with all the necessary data collected, the initial transient period of the system and the steady state performances are analysed since the system under analysis is non terminating. Recall that a non-terminating simulation is one which there is no natural event E to specify the length of run and a measure of performance for such a simulation is said to be steady state distribution of some output stochastic process Yi, Y2, . . . If the random variable Y has the steady state distribution then
we may be interested in estimating the steady state mean v=E(Y) [20].
4.1. Determination of the Warm-up Period
Statistics gathered during the warm-up period that may not truly reflect the steady state of the system [2]. Thus, a warm-up period analysis needs to be first carried out to determine the length of this initial transient state.
The system does not have fixed starting condition and a natural event specifying the end of a run can not be defined. Although the renovation unit
stops renovation between two consecutive shifts, the renovation starts at a state that is the same as the end of the previous shift. Hence, we are interested in the steady state performance of the renovation unit. We started the simulation with an empty system except the electrical and fuel oil parts renovation sections and made ten replications (40 daylong) for the existing system. These initial runs were used for determination of the length of the warm-up period after which the system can be said to be in the steady state. In calculating statistics, we deleted the observations collected during warm-up period.
We decided to use the time an entity spends in the resources and queues, and utilisation of the resources. After the system reaches the steady state these measures should not change much although random fluctuations are possible. We used the Welch’s procedure to identify the transient period. Recall that in this method, we execute the following procedure:
1. Make n replications of the simulation (n > 5), each length of m (where m is large).
2. Let Yji be the ith observation from the jth replication (j=l,2,...,n;
i=l,2,...,m) then let Yi=S"=i Yj/n for i=l,2,m. The averaged process Yi, Y2... has means E ( Yi)=E( Yi) and variances Var ( Yi)=Var( Yi)/n. Thus, the averaged process has the same transient mean curve as the original process, but its plot has only (1/n) th the variance.
3. T0 smooth out the high-frequency oscillations in Yi, Y2,..., we further
Y i (
w
)
=
w y Y ^ ^ i+. s = - w2 w + 1
if
.1= w + 1,...,
m - w
i- l _ y Y ^ 1+ s s = - ( i - l ) __2
/ -
1
...
if A
= 1,..., w
Thus, if I is not too close to the beginning of the replications, then Yj(w) is just the simple average of 2w+l observations of the averaged process
centred at observation i. It is called a moving average since i moves through time.
4. Plot Yi (w) for i=l,2, ... m-w and choose i to be that value of i beyond which Yi(w), Y2(w)... appears to have converged (Welch, [32]).
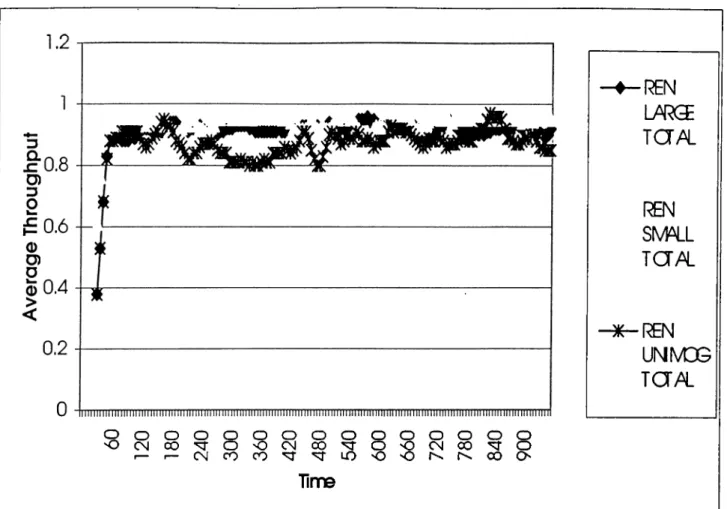
Graphical analyses of these measures show that the system rapidly reaches the steady state. For this analysis, we run the system for 960 hours. Moving average of these values are taken (w=6). The graph of the throughput (per hour) versus
time of large, small and unimog motors is given in Figure 4-1. In the graph, three of the responses level off after about 6 6 hours. When we have multiple responses
in the existing system (See Appendix D .l Figure 1,2,3,4), we decided to take first 72 hours as the warm-up period for our simulation study.
o O o O o O o o o o o o o
CN CO o OJ 00 o CN 00
1— Csl CO CO to
o
o 00Tirre
Figure 4-1 Sub-sections throughput (per hour) versus time .
-REN im 3 E
IGAL
REN s m iJ d A i
-*-REN UNM3G j a p i4.2. Determination of the Run Length
We have decide that a run length of one year would be sufficient for simulating the renovation unit since we have historical throughput data on the yearly basis [33]. This corresponds to 1820 hours [(365-104(weekend)-18 (religious, governmental and yearly holidays)*7.5 (hour/shift)]. The total run length including the warm-up period becomes 1820 -f 72 = 1892 hours.
4.3. Determination of the Total Sample Size Required
We use the following inequality to determine the number of replications required achieving the desired accuracy. Recall that initially ten replications were taken to validation process. The inequality given below assures that we obtain the results within the desired level of accuracy. The accuracy is defined as 20 motors per year averagely at the simulation model for every type motor. The absolute error a P (half-length) is defined according to production control and management section’s thoughts in face validity.
-|2
“l-a/ 2
We applied the inequality to find required number of replications with respect to average renovated motors according to their types.
We get «a*(p) by using the following iterative procedure [20]:
« ^ t P .) = min ‘ ' /
-1 ,1 - « / 2
5 ( n )
“
1
And we calculated the below results.
T yp e I t-te s t sta tistic
Large
3
2.980303
3
Small
4
4.442384
5
Unimog
5
6.077436
7
For large motors, «a*(P) = «a*(20)= 3
Therefore, 3-10 = -7 additional replications is not needed.
For small motors, na*(P) = ria*(20)= 5
Therefore, 5-10 = -5 additional replications is not needed.
For unimog motors, na*((3) = na*(20)= 1
Therefore, 7-10 = -3 additional replications is not needed.
From the above calculations, we obtain the following results.
T hroughput Types Sample Size Additional need for
Replication
Large motors 3
-Small motors 5
-Unimog motors 7
-Table 4.3-1. Required Sample Sizes.
4.4. Output Analysis of the Existing System
Replication/Deletion method is used to remove initial bias by using data obtained after a warm-up period in each replication. The replication/deletion method strived to use steady-state data in the formation of point estimates and confidence intervals for the various responses, which is accomplished by obtaining the average level of the response for each replication after the warm-up period. These averages can be shown to be independent and approximately normal- random variables (see for the normality check in Appendix B). Thus, based on
independence and normality assumptions we construct a confidence interval for the steady-state mean value of the responses (See for Table B.4-1 in appendix for the average responses, variances, means, medians, number of replications, and the confidence intervals (l-a=0.90,0.95,0.99)).
Table B.4-1 contains a great amount of information that it is difficult to
interpret the results. Therefore, we converted them to graphs. As seen in the
Figure 4.4-l.(a,b,c,d), large motors electrical renovation section (QICARB),
large motors electrical renovation section (QIELECT), small motors electrical renovation section (Q2ELECT), large motors block renovation section (QBLOCK), large motors crank renovation section (QCRANKB), small motors crank renovation section (QCRANKS) have relatively high average waiting time in queues.
Figure 4.4-l.c. Average time in queues. 40000 35000 30000 25000
20000
1500010000
5000 0X_L
?5·^ c ^ '' ■T^ y\0 ' y'vy·# #
For the large motors electrical renovation (QICARB), large motors electrical renovation (Q1 ELECT), and small motors electrical renovation (Q2ELECT) sections, these high average waiting times are normal. When the motors dismantle, electrical and carburation parts of the motors sent for renovation but the main parts of some motors disposed at the beginning of the renovation process. Therefore, more electrical and carburation parts flow to the electrical and carburation renovation sections are renovated for the mounting process but not all the parts can not be processed due to over utilisation. These excess renovated parts are sent to the mixed goods accountancy for distribution to the military units.
The high average waiting times in queues for the large motors block renovation (QBLOCK), large motors crank renovation (QCRANKB), small motors crank renovation (QCRANKS) sections is the indicator of over utilisations of some resources which will be further analysed in the subsequent sections.
From the simulation results, we also observed that large motors 2"*' repair section (R2REPAIRB), small motors electrical renovation section (R2ELECT), unimog motors repair section (RIREPAIRU), large motors carburation renovation section (R 1C ARB) and the large motors electrical renovation section (R1 ELECT) have high processing times (See Figure 4.4-2.a,b,c,d).
25000 20000 15000 10000 5000 . ^ h 7* 1 — .
tl
♦ ’i--- 1--- 1S
Figure 4.4-2.b. Average time in resourees.
10000 8000 6000 4000 2000 0 ‘ \ h:l i " : P h:^ ___ §M — r a - * fe'*·' -fSi i.· · /' V -A i , ' Aa ” 1 1 p i f ■ hM i J
18000 16000 14000
12000
10000
8000 6000 4000 2000 0Figure 4.4-2.d. Average time in resources.
The processing times are high for small motors electrical renovation (R2ELECT), large motors carburation renovation (R 1C ARB) and the large motors electrical renovation (R1 ELECT) sections. Because these sections have many processes steps to be done.
The main effects that increase the processing time of the sections are the processing steps at the sections and the type of the motors. The large motors 2"'^ repair (R2REPAIRB), unimog motors L' repair (RIREPAIRU) sections have several processing steps that increase the processing times.
Figure 4.4-3.(a,b,c,d) shows the utilisation of the resources. The utilisation of
the resources changes between 40 and 90 percent in the renovation unit. We classified the resources according to their utilisation rates. The resources that have 90% and over percent utilisation rates are bottleneck resources (over utilised sections). The resources that have 70% and lower utilisation rates are called capacity lost resources (lower utilised sections).
In the renovation unit looking at their utilisation levels, we identified the following bottleneck sections: the small electrical renovation section (R2ELECT
U), unimog electrical and carburation renovation sections (R2ELECT U and R2CARB U), large motors block renovation section (RBLOCKB U), large and small motors crank renovation sections (RCRANKB U and RCRANKS U), large motors piston renovation section (RPISTONB U), large and small motor repair sections (REPAIRL U and REPAIRS U), small motor 2"^* repair section (REPAIR2S U), large and small motors repair sections (R1 REPAIRL and R1 REPAIRS) and small motors 2"^* repair section (R2REPAIRS).
The small electrical renovation (R2ELECT U), unimog electrical and carburation renovation (R2ELECT U and R2CARB U) sections are also bottleneck sections and their utilisation rates reach almost upper bound (1 0 0%).
Because the dispose rate of the small and unimog motors are higher than the large motors (recall that the motors that are dismantled and washed are controlled in the system. According to control results, some motors' main parts are disposed but their electrical and carburation parts enter to the system). But the capacities of these sections are designed to needs for main renovation sections. Therefore,
disposes of motors increase the utilisations of the electrical and carburation renovation sections.
At the large motors block renovation (RBLOCKB U), large and small motors crank renovation (RCRANKB U and RCRANKS U), large motors piston renovation (RPISTONB U), large and small motor 1®‘ repair (REPAIRL U and REPAIRS U), small motor 2"‘* repair (REPAIR2S U), large and small motors 1^* repair (R1 REPAIRL and R1 REPAIRS) and small motors 2"‘* repair (R2REPAIRS) sections' utilisation rates are over 90%. This means that, there are over utilisations and bottlenecks due to their capacity limitations. Unless we eliminate these bottlenecks departments, it is not possible to increase throughput of the renovation unit. For these reasons, we propose new system designs to accomplish these problems in the later chapters.
The dismantle (40%) and small motor bed preparation (58%), small motor piston renovation (65%), large and small motors mounting (67% and 68%) sections have lower utilisation rates, since their capacities are highly designed.
The throughput of the renovation unit is also presented in Table 4.4-1 (based on ten replication results). These results are also very close to the historical data. Therefore, the production control and management department may use the simulation data as a real data.
Throughput Averages (in steady state)
Half-length (0.05)
Large motors 2331 2321.5-2340.4
Small motors 3189,8 3177.9-3201.6
Unimog motors 1852.9 1836-1869
4.5. Improved system with GA (Genetic Algorithms)
The real-word systems are so complex that computing values of the performance measures and finding optimal decision variables analytically are sometimes very hard or impossible [29].
Recall that a stochastic process is a collection of random variables ordered over time, which is all defined on common sample size. The simulation model developed for the renovation unit use random variables as input and it has many dynamic procedures such as breakdowns. This stochastic and dynamic nature of the renovation unit requires computer simulation to improve of the performances of the system.
In our problem, we want to increase throughput of the system with lowest additional resource requirements. Therefore, we defined controllable and quantitative factors that vary and the values for each of the factors. The capacities of the renovation sections are considered to be the input factors or decision variables. In the objective function, we used the resource utilisations and total throughput of the system with equal relative importance.
We used the optimisation utility of AutoStad to improve the performance of the existing system. In the next sections, we briefly explain the evaluation algorithm, application of the processes in the renovation unit, and give the computational results.
4.5.1. Evaluation algorithm
We performed evaluation using an optimisation algorithm called an evolution strategy algorithm (Genetic Algorithm). Evolution strategies process a population of solutions during each iteration of the search. The algorithm in