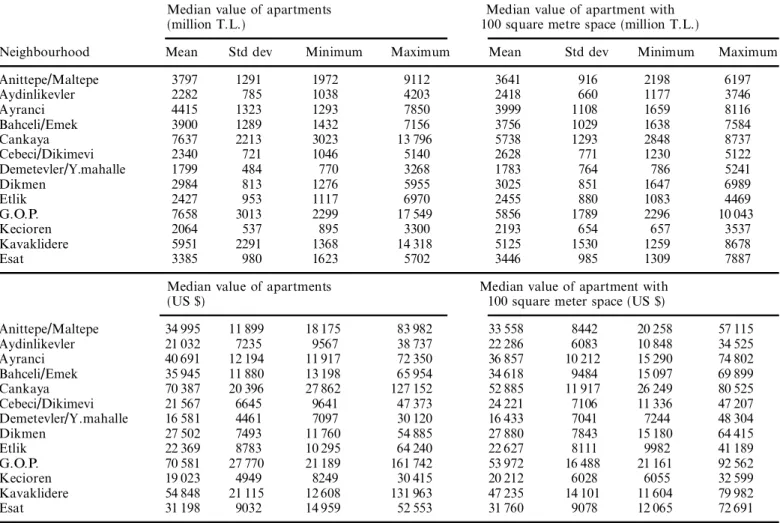
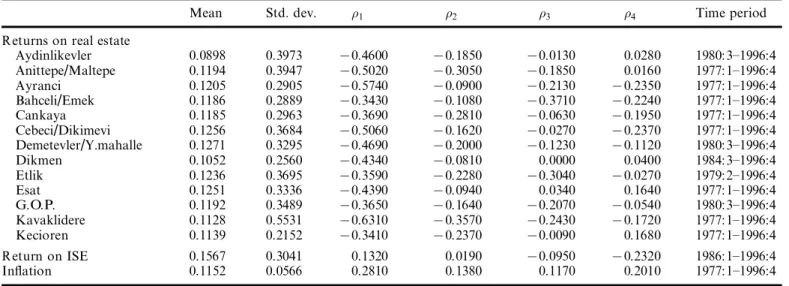
High inflation and returns on residential real estate: evidence from Turkey
Tam metin
Şekil

Benzer Belgeler
Doç.Dr., Tepecik Eğitim Araştırma Hastanesi, Çocuk Sağlığı ve Hastalıkları Kliniği, İzmir, Türkiye 4 Arş.Gör.Dr., Tepecik Eğitim Araştırma Hastanesi, Çocuk
Bu çalışmada; öncelikle “dijital miras” konusu ele alınarak söz ko- nusu kavramın anlamı ve içeriği değerlendirilecek, akabinde sosyal medya (somut olay
Evlilik birliği içinde edinilmiş mallardaki artık değerin yarısına te- kabül eden katkı payı alacağının TMK’da tarif edilen hesap yöntemine göre, ölüm ya da boşanma
Through this account, financial support for plans, projects, implementation and expropriation are offered. The use of this fund is supervised by the governor. Grants offered
Bu çalışmadaki amaçlarımızdan biri kesirli integraller içeren bazı Opial tipli ve Hölder eşitsizliklerden faydalanarak Hardy Tipli yeni eşitsizlikler elde etmektir..
Bu yönteme göre yapılan analiz sonucu kara nokta olarak tespit edilen yerler Şekil 2 de
Abdî, Abdal, Agahî, Ahî, Ali, Arabî, Arifoğlu, Âşık Ali, Âşık Hasan, Âşık Muhammed, Âşık, Bahrî, Bayadî Veysî, Bedirî, Boranî, Cemalî, Cevabî,
Memleketimizin dikkate lâyık elmalarından Celâl Y aln ız’ın (Sa kallı Celâl) çarşamba günü ânl bir kriz neticesinde vefat ettiğini derin bir teessürle
