i
İSTANBUL BİLGİ UNIVERSITY
INSTITUTE OF SOCIAL SCIENCES
MARKETING MASTER'S DEGREE PROGRAM
THE EFFECT OF MOOD STATES ON CUSTOMER
SATISFACTION
Leila Ćatić
116689018
Prof. Dr. Selime Sezgin
İstanbul
2018
iii
ACKNOWLEDGEMENTS
I would like to express my greatest appreciation to my advisor Prof. Dr. Selime Sezgin for her enthusiastic motivation, guidance and all the help in writing this research. Her endless positive encouragement increased my ambition to peruse to master’s degree, to finish this paper and to love marketing even more. I would like to extend my thanks to Prof. Dr. Beril Durmis, for her patient guidance, help and support with analyzing the data, for the final careful review, all the useful knowledge and for attending the defense jury.
I would also like to thank Prof. Dr. Esra Arikan for her careful review of the thesis, for all the joyful lessons and for attending the defense jury.
I am grateful for all the love and support from my husband, mother, father, sister and brother. Their words, understanding and acts of kindness pushed me to be my best.
iv
ABSTRACT
Mood is a phenomenon which has not been studied a lot in previous researches related to its relationship and impact on marketing processes a customer goes through. The objectivity of this study was to understand and see to the effect of mood on constructs service quality and perceived brand value, and overall relationship it has with customer satisfaction. Quantitative research method was used to collect the data from convenience sample in two different cultures. The results suggest mood can be positioned as a preliminary factor affecting service quality and perceived brand value, and it can be leading aftereffect of dissatisfaction of the customers. Findings indicate culture as an important factor in understanding consumer behavior and the antecedents of societies perception in consumption.
Aim of this research is contributing to the marketing literature and recognizing the relationship of mood with service quality, perceived brand value and customer satisfaction.
Key words: mood, service quality, perceived brand value, customer satisfaction, cultural dimensions
v
ÖZET
Ruhsal durum, önceki araştırmalarda pek fazla çalışılmış bir olgu değildir. Bu çalışmanın amacı, duygu durumunun servis hizmetinin oluşturulmasındaki önemini, müşteri tarafından algılanan ürün değerinin anlaşılmasını ve bunların müşteri üzerindeki memnuniyetini gözlemlemek ve anlamaktır. İki farklı kültürden alınan verileri uygun şekilde toparlamak için nicel araştırma yöntemi kullanılmıştır. Sonuçlar, ruh halinin, hizmet kalitesi ve algılanan marka değerini etkileyen bir ön faktör olarak konumlanabileceğini ve artçı etki olarak müşterilerin memnuniyetsizliklerine yol açabileceğini göstermektedir. Bulgular, kültürün tüketici davranışını ve tüketimdeki toplum algısının önceliklerini anlamada önemli bir faktör olduğunu göstermektedir.
Bu araştırmanın amacı, pazarlama literatürüne katkıda bulunmak ve hizmet kalitesi, algılanan marka değeri ve müşteri memnuniyeti ile duygudurum ilişkisini tanımaktır.
Anahtar kelimeler: ruhsal durum, servis kalitesi, algılanan marka değeri, müşteri memnuniyeti, kültürel boyutlar
vi
Table of Contents
ACKNOWLEDGEMENTS ... iii ABSTRACT ... iv INTRODUCTION ... 1 1.1. Research Background ... 1 1.2. Research Purpose ... 21.3. Outline of the research ... 2
2. LITERATURE REVIEW ... 3
2.1. Customer Satisfaction ... 3
2.1.1. Factors influencing satisfaction ... 5
2.2. Service ... 5
2.2.1. Service quality ... 6
2.2.2. Service quality and customer satisfaction ... 11
2.3. Perceived brand value ... 11
2.3.1. Perceived brand value and customer satisfaction ... 12
2.4. Definition of Mood ... 13
2.4.1. Differences between mood and emotion ... 14
2.4.2. Relationship between mood and satisfaction ... 15
2.4.3. Relationship between mood and behavior of customers ... 17
3. METHODOLOGY ... 19
3.1. Research design ... 19
3.2. Sample selection ... 19
3.3. Data collection ... 20
3.4. Questionnaire design ... 20
3.5. The development of the theoretical framework for the research ... 21
3.6. Research constructs ... 23
3.6.1. Mood construct ... 23
3.6.2. Service quality construct ... 24
3.6.3. Perceived brand value construct ... 26
vii
4. DATA ANALYSIS AND DISCUSSION ... 28
4.1. Descriptive statistics for demographic variables ... 28
4.1.2. Age ... 29
4.1.3. Country of residence ... 29
4.1.4. Education ... 30
4.1.5. Occupation ... 31
4.2. Cultural values and differences ... 32
4.2.1. Turkey’s Hofstede dimension values ... 34
4.2.2. Bosnia and Herzegovina’s Hofstede dimension values ... 34
4.2.3. Comparison of five-dimensions of Turkey and Bosnia and Herzegovina ... 35
4.3. Analysis of the results ... 37
4.3.1. Factor and reliability analysis for mood ... 37
4.3.2. Factor and reliability analysis for service quality ... 38
4.3.3. Factor and reliability analysis for satisfaction ... 39
4.3.4. Reliability analysis for perceived brand value ... 40
4.4. Regression analysis of the results ... 41
4.4.1. Hypotheses testing for Turkey ... 41
... 43
4.4.2. Hypothesis testing for Bosnia and Herzegovina ... 44
CONCLUSION ... 47 MANAGERIAL IMPLICATIONS ... 49 FUTURE RESEARCH ... 52 References ... 53 Appendix ... 63 4.2. Factor items ... 63 4.2.1. Mood ... 63 4.2.2. Service quality ... 63
4.2.3. Perceived brand value ... 64
4.2.4. Customer satisfaction ... 65
viii 4.4. Questionnaire on Bosnian language ... 72
ix
List of Tables
Table 1 - Mood construct ... 24
Table 2 - Service quality construct ... 24
Table 3 - Perceived brand value construct ... 26
Table 4 - Customer satisfaction construct ... 28
Table 5 - Total gender of the sample ... 29
Table 6- Country of residence of the sample ... 30
Table 7 - Level of education of the sample ... 31
Table 8 - Occupation of the sample ... 32
Table 9- Hofstede's dimension values of Turkey ... 34
Table 10- Hofstede's dimension values of Bosnia and Herzegovina ... 35
Table 11- Factor and reliability analysis of mood ... 38
Table 12- Factor and reliability analysis of service quality ... 39
Table 13 - Factor and reliability analysis of satisfaction ... 40
Table 14 - Reliability analysis of perceived brand value ... 41
Table 15 - Regression analysis of the moderating effect of mood on service quality and perceived brand value subdimensions on the satisfaction in Turkey ... 42
Table 16 - Regression analysis of the moderating effect of mood on service quality and perceived brand value subdimensions on the satisfaction in Bosnia and Herzegovina .... 44
Table 17 - Mood factor item names ... 63
Table 18 - Sevice quality factor item names ... 63
Table 19 - Perceived brand value factor item names ... 64
x
List of Figures
Figure 1 - Service quality model ... 10
Figure 2 - Conceptual Model for the research ... 22
Figure 3 - Model after testing the hypotheses in Turkey ... 43
1
INTRODUCTION
1.1. Research Background
Customer satisfaction is a concept studied in many previous researches, starting from the mid 1960’s (Cardozo 1965) when a first study on the topic of consumer expectations and satisfaction was written. Since then, different academicians have tried to find all factors which have an influence on it, including the dimensions of service quality (Parasuraman 1985) and perceived brand value (Zeithaml 1988). Although Oliver (1981) defined satisfaction as a “psychological state”, many academicians before him and until the mid-1980’s suggested it was only a mental process (Dube and Schmitt 1991). Other researches, such as Kotler (1991), defined it as after-purchase evaluation process, based on the pre-purchase expectations.
Present studies include emotions as a result of a post-purchase process customer is experiencing. Bargerand and Grandey (2006) conducted a study aiming to show how much a simple smile in an encounter is important for maintaining customers and having higher satisfaction score. Uniqueness of this study is placing mood, as a psychological factor, as an antecedent of customer satisfaction, not only as a state resulting after trying the service or a product. Thus, mood having positive relationship with service quality, perceived brand value and customer satisfaction is the allegation of this research. Additionally, testing the hypotheses in two different countries contributes to the understanding of how cultural dimensions and values impact behavior and processes of customers.
2
1.2. Research Purpose
Objective of this studies is to prove the existing relationship between mood and following factors: service quality, perceived brand value and customer satisfaction. Mood was used as a moderating variable and its effect was described in the later part of the research. Moreover, testing the relationship between service quality and customer satisfaction, and perceived brand value and satisfaction was performed.
The second aim was to include mood as a factor affecting the pre-purchase process of a customer, initially shaping the perception of other steps in the buying process. As gaining competitive advantage is the main goal of companies, understanding how customers feel may predict their behavior, and employees may know how to pursue customers in a way reducing the possible dissatisfaction. Third aim was to acknowledge if cultural dimensions are important in shaping customer behavior when under the effect of different mood states.
1.3. Outline of the research
In this master thesis, mood, service quality, perceived brand value and customer satisfaction constructs are defined. The thesis is divided into four parts, including the literature review, methodology used, analysis of the data and interpreting the results of the conducted research.
In the literature review part, definition of customer satisfaction, service quality, perceived brand value and mood are included. Findings of the previous researches have been summarized and all focal points of the research constructs were explained.
3 Second part consists of describing the methodology used in the research. Design of the research, sample selection, data collection, questionnaire design, development of the framework and research constructs were all specified in detail.
In the third part, statistics of the sample were revealed, and the cultural dimensions of Turkey and Bosnia and Herzegovina were analyzed and compared. Factor, reliability and regression analysis were applied to test the developed hypotheses.
Final part includes interpretation of the research findings, managerial use of presented results, limitations of the study and notes for future ones. Questionnaires used for the purpose of the study are found in the Appendix part.
2. LITERATURE REVIEW
In this section, a review of the literature including the topics on customer satisfaction, service quality, perceived brand value and the definition of mood will be evaluated. It is based on the articles and books written by different academicians, published from the year 1981 to the year 2018. The review consists of various definitions, explanations and some models of the topics mentioned before.
2.1. Customer Satisfaction
Many previous papers have been written on the topic of customer satisfaction. Before the 90’s, Oliver (1981) defined customer satisfaction as a “summary psychological state resulting when the emotion surrounding disconfirmed expectations is coupled with the customer’s prior feelings about the consumption experience”. It has also been defined as an evaluation of
post-4 purchase based on the expectations prior to the purchase (Kotler 1991, Casalo et al. 2008). If you simply type the word satisfaction into Oxford dictionary, the definition you will get is “fulfilment of one’s wishes, expectations, or needs”, and that is the core of understanding what this term is about (Oxford Dictionary of English 2010).
As a concept, it has been present in the retail markets for a while and many different academicians point out customer satisfaction as one of the main factors influencing companies’ profitability, success and survival (Angelova and Zekiri 2011, Jashireh et al. 2016).
Satisfaction depends on the ones expectations before, the feelings during the purchase phase, the behavior it brings after the purchase and highly influences customers further buying habits (Tong 2015). It is well known that a customer who has positive post-purchase experience and is satisfied with the product or service, is more likely to purchase the same product/service than the customer who is not satisfied. Those who are highly satisfied, along with the continuous purchase also tend to spread positive word-of-mouth to others, and in many situations become loyal customers for their whole life (Schiffman and Wisenblit 2015; p.44). Exactly because of this reason, for many companies, customer satisfaction became crucial for gaining and maintaining overall success and customer loyalty in a market competitive as it is nowadays (Mohammad 2012, Jashireh et al. 2016). Moreover, some businesses tend to not only meet but to exceed the expectations of the customers’, aiming to gain their commitment (Martin et al. 2008, Petzer and Mackay 2014).
When it comes to service sector, customer satisfaction is seen as a result of global interpretation of elements which composes relationship between the service provider and the customer (Severt 2002, Casalo et al. 2008) and some researches divide it into a disposition supported by economy and economic conditions (volume of sales, profitability) or as a cognitive factor induced by fulfilled promises (Geyskens et al. 1999, Casalo et al. 2008).
5 Generally, in services it is not only one specific task which is evaluated, rather the whole environment and the overall performance. When we take restaurant as an example, aspects such as service received, food quality are all evaluated to see if they match with the expectations of a customer (Jangga et al. 2012 Patzer and Mackay 2014). This statement is further supported by the study conducted by Ha and Jang (2010), stating that the quality of food and the service delivered influences customer satisfaction.
2.1.1. Factors influencing satisfaction
Hokanson (1995) defined following factors as the ones having direct impact on the customer satisfaction: employee’s knowledge, friendliness and willingness to help, correct billing and fair pricing, quality of the service and its fast delivery and receiving overall good value. In the service sector, two most important factors influencing satisfaction are perceived value and the service quality (Angelova and Zekiri 2011).
Some further studies suggest that satisfaction is closely related to the emotions and feelings such as delight, happiness, relief and acceptance (Hoyer and MacInnis 2001). Skills of communication between the customer and employee also contribute to the level of one’s satisfaction or dissatisfaction (Tong 2015). Furthermore, customers who had negative experience usually spread negative word-of-mouth and adverse marketing to the other customers which can directly affect one’s expectations or lower their perceived value (Schiffman and Wisenblit 2015; p.44).
2.2. Service
Service as an industry plays important role in the economies of the world nowadays. During only the last five years, there was a rapid growth in the sector and a switch where US customers tend to spend more on the experiences and
6 the services, rather than spending on the goods for their households (Deloitte Center 2017).
In 2007, Grönroos defined service as “a process consisting of a series of more or less intangible activities that normally, but not necessarily always, take place in interactions between the customer and service employee and/or physical resources or goods and/or systems of the service provider, which are provided as solutions to customer problems”. However, services may not always be provided as a solution to problems, but as a need or simple demand from a customer. Kotler et al. (2009) argued the definition above by stating services are “essentially intangible” and they do not “result in ownership of anything”. Unlike goods, services are intangible and have no physical apparent, but same as goods they provide value for the customers (Angelova and Zekiri 2011).
2.2.1. Service quality
Parasuraman et al. (1988) described service quality as the measurement of customer’s observed quality of an organizational unit’s perfection or dominance in the overall delivery of the service. Moreover, this perceived quality is an attitude (Parasuraman et al. 1988) where a customer is influenced by the expectations and the objectivity of the service and is described as an opinion rather than feeling of satisfaction or dissatisfaction. It is the customer’s approach and overall perception of the service which affect the evaluation of quality level (Jashireh et al. 2016).
For managers, understanding the service quality and customers expectation became one of the major fields of interest as it is closely related to the performance of their businesses (Angelova and Zekiri, 2011). Providing a good service is nowadays seen as a differentiation point of a company, as consumers value the high quality of performances which they aim to get from the employees and they tend to visit firms which meet their expectations. By having more competition, firms’ key to success in overcoming, or being in the seek of
7 competitive market and gaining profit, is being able to provide high service quality by having the core focus set on the customer (Chiara et al. 2007, Jashireh et al. 2016).
Services are determined by its intangibility, variability, perishability and inseparability of production and consumption (Schiffman and Wisenblit 2015; p.139). It is exactly these factors which make it problematic and more challenging to evaluate in terms of its level of quality.
The consumption and the production of the services are often processed in the same period while the consumer is present in the service provider center. It is the element of human presence which increases the chances of making a mistake while delivering or producing the service, because intangibility of the service makes controlling it very hard (Bowen, 1986, Ramseook-Munhurrun et al., 2010).
Due to its determining factors such as the one before, customers often tend to use indicators related to the service (Schiffman and Wisenblit 2015; p.139). When in a restaurant, for instance, a customer does not only rely on the quality of the food, rather needs to be satisfied with the quality of the received service during the meal (Omar et al. 2016). Furthermore, these indicators can be visual appearance of the area where the service is performed, look of the personnel, their knowledge and professionality, etc. In the 2000, a study conducted by Kivela et. al, states that the chances of customer retreating himself/herself in the same restaurant again depends on the quality of the service, impact the place leaves, quality of the food, atmosphere and the comfort of being there.
When it comes to the standardization of the services, there needs to be differentiation and a standard unit of standardizing cannot be used (Morschel et al. 2002). The list of elements affecting the overall delivery and the factors influencing consumers perception of quality is too long. It is the human element which is the hardest to standardize, since employee or the customer can be in different moods, may want different and customized approach and value the
8 quality based on the interaction. Also, having the problem with too high demand at a certain point of time might lower the quality of delivered service. What many firms are trying to do to solve the problem of inconsistency and the errors in service delivery, is making special offers to attract consumers in the time when there is less demand, so that it is not overcrowded in any point of time (Schiffman and Wisenblit 2015; p.139). “Happy hour” or special price in certain time offerings are perfect examples.
Over the years, many different models were developed by different researches on how to measure level of service quality. Perception of the quality of the service obtained by the consumer, is one of the most objective and relevant measurement for the actual firm’s service level (Parasuraman et al. 1988). The tool used to measure this perceived customer’s quality is mostly the SERVQUAL (Parasuraman et al. 1988) and it is based on the five dimensions of the services including tangibles, reliability, responsiveness, assurance and empathy. According to the authors of the model, customers use these five dimensions to evaluate the overall level of service quality. SERVQUAL model, besides the five dimensions, includes 22 scales used to asses this perceived quality.
Tangible stands for the physical elements of the service, which can be touched. It includes the environment, tools and the employees, etc. Usually, tangible elements are used for declaring the image of the service provider’s brand and the visual quality as the intangibility of the actual services may fail to deliver the intended value (Kasapila 2006, Omar et al. 2016). Reliability of the services indicates the precise and decisive delivery of the firm’s promises. Responsiveness dimension is used to measure the service providers willingness to help their customers and their efficiency. Knowledge of the personnel, their ability to communicate and imply trust to customers is related to the assurance. Zeithaml and Bitner (2003) found this element of great importance when the customer is insecure about the restaurant’s offering and the waiter can convey customers to order without uncertainty or fear. Empathy, on the other hand,
9 refers to feeling of caring and the keeping in mind and reality every customer as an individual worth attention. Empathy can be shown by simply referring to the customer by his/her name or remembering their usual.
Furthermore, gaps in service quality like positioning, specification, delivery, communication and perception can be identified through the SERVQUAL model (Parasuraman et al. 1988). They can be used to identify the fails such as miscommunication, customer preferences, employee not understanding what the management wants, customer expectations versus actual perception, and guide the management towards them (Naidoo et al. 2010).
Another model developed by Grönroos (1982), describes service quality as a consequence of both customers’ expectations and actual experience of the service quality. He divided service quality into three dimensions: technical, functional and corporate image. The model is illustrated in the figure below.
10 Adopted from Gröroos (1984)
Technical quality refers to what the customer receives by the delivered service. The question “How?” is answered by the functional quality, which is the way in which the service is provided and delivered to the customer. “What?” in the technical quality part of the model refers to the quality of the performed service after it is delivered. Corporate image is composed of the technical and functional quality. Moreover, it is easily affected by the marketing campaigns, price system, word-of-mouth and needs of customers (Jashireh et al. 2016). Overall
Expected service Perceived service quality Perceived service Image Technical quality Functional quality What? How?
11 evaluation of the perceived quality is affected by the corporate image, expected and perceived service.
Generally, what we can see is that authors’ base for defining the service quality is that customers compare their expected level of service performance with the one delivered, and that the final delivery is affected by the overall process of service production and serving (Parasuraman et al.1985, Angelova and Zekiri 2011).
2.2.2. Service quality and customer satisfaction
Although closely linked, service quality and customer satisfaction are two separate concepts. Service quality is a “form of attitude, related but not equivalent to satisfaction” (Parasuraman et al. 1988). Some authors believe satisfaction is precedent of service quality and that as such, it affects the opinion and evaluation of the service quality (Carman 1990, Bolton and Drew 1991, Marković et al. 2009).
To sum up, there are no definitions which can be used to define these two terms as a one, rather than as a complex relationship in which one affects another. They are seperate but have joint points. After employee delivers the service to the customer, customer evaluates the quality level and forms either attitude of being satisfied or dissatisfied (Bitner et al. 1990, Jshireh et al. 2016).
2.3. Perceived brand value
Perceived value is the consumers evaluation of the product or a service based on the overall perception of what is acquired and what is gained (Zeithaml 1988, Petzer and Mackay 2014). Nilson (1992) defined it as “consumer’s expression of the product benefits”.
Value differs from customer to customer, as it is based on individual perception and beliefs. It is the view of a customer, in which “perceived benefits and sacrifices are processed simultaneously in the customer’s mind” (Martin et al.
12 2004, p.54, Icazuriaga 2016). Mostly, the perception can be consequence of subjectivity, but even as such, it can guide managers to build strategies and learn how to answer to customer needs (Angelova and Zekiri 2011).
Customer always have some perception before consuming the service or a product. Ha and Jang (2012) categorize two dimensions of perceived value in the restaurant: food quality and service quality. According to their study, both need to be meeting the customer’s expectations to have high overall perceived brand value. Besides these two dimensions, restaurant managers need to acknowledge factors such as taste of the food, visual presentation, pricing, and value for money (Jangga et al. 2012, Petzer and Mackay 2014).
Scale used to measure the perceived value is PERVAL (Sweeney and Soutar 2001) and it is composed of four dimensions such as quality, price, emotional and social value. It is usually used to measure tangible products’ perceived value and can be tested in the pre and post-purchase phase (Icazuriaga 2016). Even though, it is methodologically correct, according to some researches it lacks the evaluation of overall perception, rather it focuses more on the post-purchase value results (Gallarza and Gil 2006, Sanchez et al. 2006, Petrick 2003, Icazuriaga 2016). Gronroos (1997) divided perceived value into functional, standing for rational assessment, and emotional, which includes feelings about the product or a service.
2.3.1. Perceived brand value and customer satisfaction
Level of perceived value of the delivered service, or of the brand in general, is closely related to the customer satisfaction (Angelova and Zekiri 2011). Demirgüneş (2015) defines customer satisfaction as the result of “customer’s perception of value received”. If the perception meets customers expectation, it is more likely that customer will be satisfied.
For satisfaction to occur, benefits need to overcome the costs and the experience needs to meet the expectations of a customer. Furthermore, if a customer pays
13 less and the experience exceeds his expectations, both the perceived value and satisfaction will increase. Similarly, if some unforeseen upturn in the price or benefits occurs after purchasing the product or a service, a decrease in customer satisfaction will occur (Omar et al. 2011). For firms, perceived brand value is foreseen as one of the most important elements for being in the peak of competitive market and is also one of the important elements predicting satisfaction of the customers (Milfelner et al. 2011). In the study conducted by Demirgüneş (2015), perceived value was highly liked to the customer satisfaction in terms of predicting its outcome and the intentions of the customer. Some other studies, also found perceived value playing an important factor in shaping the decision-making process of a customer, implying behavioral intentions are also an outcome of perceived value (Zeithaml 1988, Omar et al. 2016). Recommending a product or a service is also considered to be originating from the perceived value (Bowen and Shoemaker 2003, Ladhari et al. 2008, Omar et al. 2016).
2.4. Definition of Mood
Mood is defined as an “affective state” (Kumar 1997, Smith and Kosslyn 2007, Turner 2007) of mind which is triggered by the personal feeling (Smith and Kosslyn 2007, pg. 328). It is the “appropriate designation for affective states that are about nothing specific or about everything” (Frijda 2009, pg. 258). It is seen as an independent perception of elements of affect (Gardner 1985, Swinyard 1993) and its’ “cause may not always be easy to identify” (Ekkekakis 2013) because it “often (though not always) lacks a contextual stimulus” (P. Robbins and Judge 2007, pg. 260).
Independent measures best used to describe and characterize mood are positive and negative, and mood, in the market, reflects the feeling a customer has during the confrontation of the employee providing the specific service (Ruyter and Bloemer 1998). Psychologists define mood as “positive or negative emotional state of varying intensity that changes in response to life’s circumstances”
14 (Polak et al. 2015). Positive or negative mood can be induced by something undifferentiated and an individual may not be able to specify the source of it, as it is not a response to a certain event or a person (P. Robbins and Judge 2007, pg. 260). For example, when we are down and in a bad mood, it may last for few hours or for a month and that feeling cannot be directly related to anything specific. Mood is believed to be composed of considerable number of emotions and is a cognitive state (P. Robbins and Judge 2007, pg. 261) and as such, it affects the one’s perception and thinking.
It is believed that individuals seek to be in a positive mood and tend to escape from the situations which bring them in the negative mood (Clark and Isen 1982, Ruyter and Bloemer 1998). Thus, in an environment where negative affect or influence on a customer may occur, it will most likely be avoided. Affects which initiate the positive mood states include emotions such as excitement, happiness and calmness while nervousness, sadness, depression, boredom or tense emotions initiate negative mood (P. Robbins and Judge 2007, pg. 265).
2.4.1. Differences between mood and emotion
Although emotion and mood are mostly used in the same context, majority of the researches and academicians agree they have connecting points but are still very distinct (Beedie et al. 2005, Kocabulut and Albayrak 2016). Emotions are defined as “a complex set of interrelated sub-events concerned with a specific object” (Russell and Barrett 1999, pg. 806). Unlike moods which are related to a non-specific cause (P. Robbins and Judge 2007, pg. 260), emotions are triggered by certain and specific thing, event or a person (Ekkekakis 2012). Emotions are conditions affected by the subjectivity of the experience and they are composed of “evaluation and appraisal, motivation and bodily responses such as arousal and facial expression” (Smith and Kosslyn 2007, pg.328). Reactions which lead to creation of emotions are bound to a limited amount of time (Smith and Kosslyn 2007, pg. 328), while for moods there are no correlations with the specificity of time intervals in which they could occur.
15 Furthermore, emotion is a momentary and intensified feeling, and mood is a long-lasting and less intense feeling (Kocabulut and Albayrak 2016). Unlike mood, emotions are numerous and diverse such as being angry, sad, happy, surprised, feared or disguised, they can be distinguished by the one’s facial expression and in general influence individuals to act accordingly to the feeling they have (P. Robbins and Judge 2007, pg. 265).
According to Robbins and Judge’s definitions, both emotions and moods can easily influence and leave impact one on another ((P. Robbins and Judge 2007, pg. 265), e.g. when being extremely happy for some specific reason, may lead to being in a positive mood for a long period of time. In some studies (e.g. Oatley and Jenkins 1996, pg.125; Tosun 2018) mood is defined as a state of an emotion, lasting for few hours or days or as a state which includes emotions (White 2006, Tosun 2018).
Exacting the differences between moods and emotions is very hard. Some of the main points of differentiation are the causes of their initiation and triggering, time duration of the feeling and the intensity.
2.4.2. Relationship between mood and satisfaction
Not many researches have been made on the impact of mood states on customer satisfaction. Some psychologists have found that higher customer satisfaction is directly related with the positive mood and power of a customer as an individual (Cunningham 1979, Forest et al. 1979; Gardner and Hill 1990). Oliver (1993) also proposed that both positive and negative moods are linked with the level of perceived satisfaction of a customer.
Furthermore, in some studies, it has been found that mood, particularly the positive mood, has a significant impact on probable positive behavior of a customer (Isen and Simmonds 1978, Forest et al. 1979; Gardner and Hill 1990). This behavior includes acts of consumers leading to a positive result and their overall satisfaction. Moreover, feelings such as being happy, relieved and
16 excited are related to satisfaction (Hoyer and MacInnis 2001, Singh 2006). Thus, if the duration of these feelings is longer, they can be components of a mood a customer is in, and as such will be associated with the level of customer satisfaction. Hollingworth et al. (2007) used this proposition when obtaining a research about the correlation between mood and job satisfaction. By using the “stress arousal checklist” (Hollingworth et al. 2007) as a leverage on mood of the workers, it has been found that high level of stress is directly influencing low level of satisfaction with the job and position (Hollingworth et al. 2007). Less satisfied workers tend to be in a negative mood.
Huang et al. (2010), in their study, state that “mood, together with visitor expectations and performance evaluation was found to be significantly related to satisfaction and future intentions to recommend shows to others”. According to their study, understanding the moods of customers is an important factor for companies. By understanding their needs and mood, the management can ease the process of achieved higher level of satisfaction (Huang et al. 2010).
Also, smile of an employee can trigger the positive mood and, in the study, conducted by Pugh (2001), it was found as a leading factor in greater perception of service quality and higher customer satisfaction (Barger and Grandey 2006). Meng and Sirakaya-Turk (2010) state that overall satisfaction of the customers, particularly tourists, depends on positive and negative mood. Tourists in negative mood were generally less satisfied with the tours than the ones in positive mood (Meng and Sirakaya-Turk 2010).
However, some studies suggest that mood and satisfaction are not dependent. Ruyer and Bloemer (1998) state that these two concepts are both unique and specific and are not directly affecting each other (Abelson et al. 1982, George 1989, George and Brief 1992, George and Jones 1996, Ruyer and Bloemer 1998). The base for their thinking is distinguishing the difference between the evaluation process of mood and satisfaction. For example, mood is more related to the feelings and affect during the stage of receiving the service, while
17 customer for satisfaction evaluation considers the whole process (Ruyer and Bloemer 1998).
2.4.3. Relationship between mood and behavior of customers
In the researches conducted until today, many different factors and behavior patterns are influenced by the mood of an individual. Ruyter and Bloemer (1998) found out that positive mood is directly connected with the loyalty of a customer. When in a high positive mood during the process of service delivery and experience, customers tend to relate that experience to highly satisfied and visit the same service provider more than once (Ruyer and Bloemer 1998). Bitner (1992), in his study, stated that mood is affecting the number of visits of the customer. Atmospherics and the environment of the service provider are additional factor affecting the mood (Berens 2010). Customer which enjoys the environment of a service providing center, is believed to be in a positive mood, or his/her mood can be influenced in a positive way leading to greater satisfaction with the delivered service (Spies et al. 1997, Berens 2010).
Amount of money spent is shown to be related with the mood (Bitner 1992, Spies et al. 1997, Berens 2010). In the study conducted by Parker and Brown (1982), individuals in negative mood intend to go more often and do more shopping than the ones in positive mood. They also tend to buy more themselves products, rather than buying for others, and the period of staying in the stores was longer than the positive mood sample (Parker and Brown 1982, Luomala and Laaksonen 1995). Brand of the preference, in terms of doing more or less research about them, also depends on the mood (Gardner and Hill 1988, Berens 2010). When in positive mood, less information about products is needed (Brewer and Hewstone 2004, pg. 118, Tosun 2018) before their purchase and these customers show greater willingness to try different products than the ones in negative mood (Gardner and Hill 1988, Berens 2010). Pornpitakpan et al. (2017) revealed that positive mood is inspires and strengthens individuals in
18 risk taking, making decisions in short time period, to rely on their intuition and opinion while making the purchase.
Koch and Forgas (2012) argued that one’s mood influences the amount of attention customers have. In their study, positive mood is related to less attention given to attributes around the customer, while customers in negative mood gave more attention to those attributes (Koch and Forgas 2012). Mood is affecting the cognitive processes of individuals (Pornpitakpan et al. 2017) and their process of decision making (Kuru-Salo 2013). Consumers with positive mood are believed to allow more intuitive behavior, ignore errors and use more logic during their behavior and performance as customers (Kahneman 2011, Karu-Salo 2013). Moreover, White (2006) states that mood is highly influencing the perception of the quality and the overall service performance. The perception of the service is more positive when consumers are in positive mood (Mattila and Wirtz 2000, Karu-Salo 2013).
Generally, judgement of the consumer is influenced by the mood (Pornpitakan et al. 2017), as is the evaluation of the services (Gardner 1985; Knowles et al. 1993; Mattila and Enz 2002; Pornpitakan et al. 2017). When in negative mood, evaluation of the service is more negative than when customers are in a positive mood during the service delivery and after receiving the service (Meng and Sirakaya-Turk 2010). Donovan and Rossiter (1982) also found positive mood was to be closely related to the positive evaluation (Berens 2010). Furthermore, solving problems on creative basis and more easily is found to occur more often by individuals in positive mood (Brewer and Hewstone 2004, pg. 72, Tosun 2018).
As the literature points out, customer satisfaction is one of the main goals of firms operating in any industry, and the elements shaping and leading to it are very important to be understood and studied. How the customer perceives overall performances of the service, product purchase, their prior expectations, emotions are still very common in the topics of many studies.
19 When it comes to the service sector, perception of the level of service quality and the perceived brand value are factors directly influencing satisfaction (Angelova and Zekiri 2011). In this research, our aim is to add mood to the list of these factors. We will measure the extend to which mood as a cognitive, intangible state, affecting thinking and perception (P. Robbins and Judge 2007, pg. 261), has an overall effect on satisfaction.
3. METHODOLOGY
After defining all the variables in the literature review part, a questionnaire was created for the survey and used to collect data from the sample group. After being collected, it was analyzed and discussed.
3.1. Research design
The aim of this research is to support hypotheses by testing the relationship between following variables; mood, perceived service quality level, perceived brand value and customer satisfaction. In this thesis, we will be comparing the cultural differences by collecting and analyzing the results from two countries, Turkey and Bosnia and Herzegovina.
Quantitative data was collected by using questionnaires in the survey as a research method.
3.2. Sample selection
For the research to be reliable, population number participating in the questionnaire had to be meaningful and not too small. Due to the time and accessibility limitation, convenience sampling method was used, and the subjects chosen are the university students. In this research, additionally, sample was divided based on the country of residence, Turkey and Bosnia and
20 Herzegovina, and is proportional. Total size of the sample is three hundred, one hundred fifty responders from Turkey and one hundred fifty from Bosnia and Herzegovina.
3.3. Data collection
Research data was collected in Turkey and in Bosnia and Herzegovina. Questionnaires were distributed by using four different university platforms: two in Turkey and two in Bosnia and Herzegovina. Questionnaires were uploaded on to Bilgi University e-platform and Istanbul Technical University e-platform in Turkey and, on School of Business and Economies e-platform and International University of Sarajevo e-platform in Bosnia and Herzegovina.
3.4. Questionnaire design
By using previous papers and research methods, a questionnaire (Appendix 1) was formed and designed to fit the needs of testing the hypotheses. The questionnaire was divided into five sections including collecting data on demographics (age, gender, country of residence, education level and current occupation), mood, service quality, perceived brand value and customer satisfaction. Demographic data, as mentioned, consists of five items, and these items are used to profile the sample and divide data by respondents’ country of residence. The section regarding the mood variable includes 4 items which are measured using the 5-point Likert scale. Service quality section includes 22 items measured. The fourth part, perceived brand value, consists of 8 items, and the customer satisfaction section includes 3 different items and all the mentioned are measured by using the 5-point Likert scale.
To answer on the service quality, perceived brand value and customer satisfaction section, participants of the study were asked to name their favorite retail brand store, and to think about it while answering the questions.
21
3.5. The development of the theoretical framework for the research
Examining the effect of mood states on customer satisfaction, more precisely the effect of mood as an independent variable on service quality and perceived brand value and the influence it has on the satisfaction of a customer, was the main idea while developing the conceptual model of this study.
In the figure below, you can see the theoretical framework developed for this research paper.
22 SERVICE QUALITY Tangibles Responsiveness Reliability Empathy Assurance PERCEIVED BRAND VALUE Perceived functional value Perceived price value Perceived emotional value Perceived social value MOOD CUSTOMER SATISFACTION Figure 2 - Conceptual Model for the research
23 Hypotheses to be tested in this research are following:
H1: There is a positive relationship between negative mood and low perceived
service quality level.
H2: There is a positive relationship between positive mood and high perceived
service quality level.
H3: There is a positive relationship between positive mood and high perceived
brand value.
H4: There is a positive relationship between negative mood and low perceived
brand value.
H5: There is a positive relationship between perceived service quality and
mood.
H6: There is a positive relationship between perceived brand value level and
mood.
H7: The higher the level of service quality, the higher the level of customer
satisfaction.
H8: The higher the level of perceived brand value, the higher the level of
customer satisfaction.
3.6. Research constructs
3.6.1. Mood construct
To measure mood in this study, items adopted from Swinyard (1993), Mattila and Enz (2002), White (2006) and Albayrak and Kocabult (2016) were used. The items were measured by using the 5-point Likert scale, with the answers in range from “strongly disagree” to “strongly agree”.
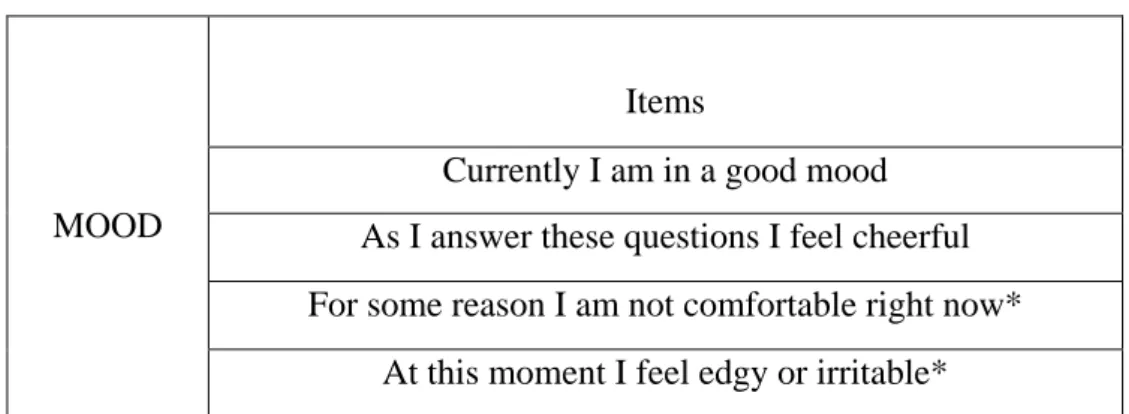
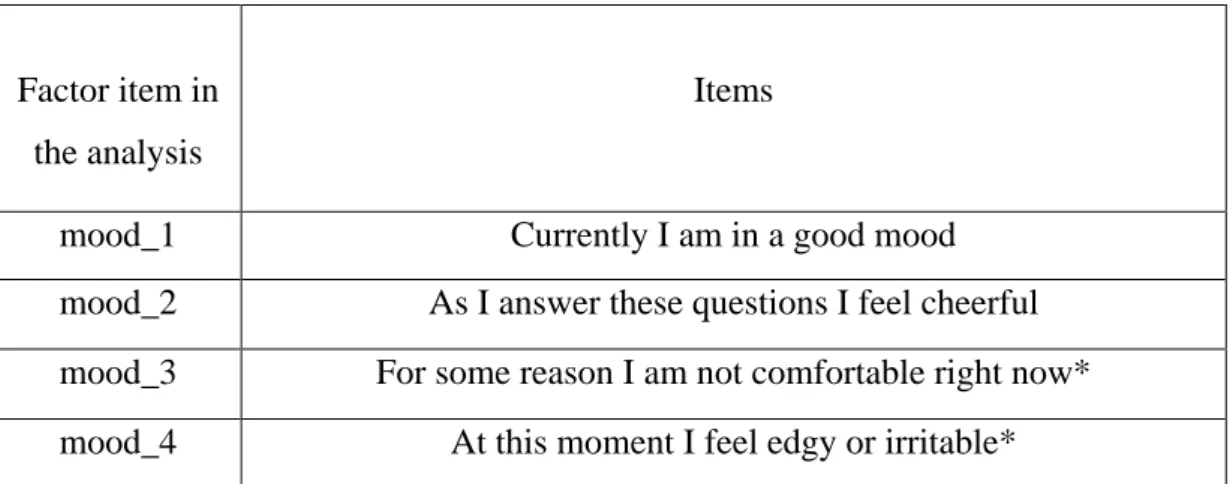
24 Table 1 - Mood construct
MOOD
Items
Currently I am in a good mood As I answer these questions I feel cheerful For some reason I am not comfortable right now*
At this moment I feel edgy or irritable*
**reverse scored
3.6.2. Service quality construct
Service quality was measured by using the Parasuraman, Zeithaml and Berry’s (1988) and Chingang and Lukang (2010) 22 item scale and a 5-point Likert scale unit, ranging from “strongly disagree” to “strongly agree”. 22 item scales are divided into five subdimensions: tangibles, reliability, responsiveness, assurance and empathy and are altered to fit the purpose of this research. Participants of the survey were asked to answer following questions while thinking about their favorite retail brand.
Table 2 - Service quality construct
Subdimensions Item
Retail brand's store has up-to-date equipment. Physical fascilities are virtually appealing. Employees are well dressed and appear neat.
25 SERVICE
QUALITY
Tangibles Physical environment in the store is appropriate for the service provided.
Reliability
When they promise to do something by a certain time, they do it.
When customer has a problem, they should show sincere interest in solving the problem. Retail brand's store perform the service right.
They provide their services at the time they promised to do so.
They keep their records accurately.
Responsiveness
Employees make information easily obtainable by customers.
Employees give prompt services to customers. Employees are always willing to help customers.
Employees are never too busy to respond to customer requests.
Assurance
The behavior of employees instill trust in customers.
Customers feel safe in their transactions with the employees.
Employees are polite to customers. Employees of the retail store have knowledge to
answer to customer's questions and attention.
Each customer is given individual attention.
Operating hours of the retail store are convenient to customers.
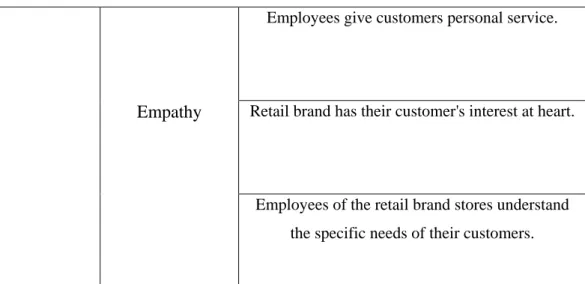
26 Empathy
Employees give customers personal service.
Retail brand has their customer's interest at heart.
Employees of the retail brand stores understand the specific needs of their customers.
3.6.3. Perceived brand value construct
Perceived brand value measurement of 11 items were adopted from the study conducted by Omar et al. (2007), Peng and Liang (2013) and Demirgüneş (2015) and were measured by using 5-point Likert scale. This variable was divided into four subdimensions- perceived functional value, perceived price value, perceived emotional value and perceived social value. The items were adjusted to fit the purpose of this research.
Participants of the survey were asked to answer the following questions while thinking about their favorite retail brand.
Table 3 - Perceived brand value construct
Subdimensions Items
Perceived functional value
Retail products have consistent quality. Retail products are what I really need.
27 PERCEIVED BRAND VALUE Perceived price value
Products are reasonably priced. Retail's products offer value for money.
Perceived emotional value
Retail products make me want to buy it. Retail products make me feel good.
Retail products give me pleasure.
Perceived social value
Retail products would help me feel acceptable.
Retail products would cause the interest of others.
Retail products would promote friendship between me and my friends.
3.6.4. Customer satisfaction constructs
Satisfaction of the customers variable was measured by using 3 items adopted from the studies conducted by Omar et al. (2007), Chen and Fu (2015) and Demirgüneş (2015) and measured using the 5-point Likert scale, answers ranging from “strongly disagree” to “strongly agree”. Items were adjusted to fit the purpose of this study.
Participants of the survey were asked to answer following questions while thinking about their favorite retail brand.
28 Table 4 - Customer satisfaction construct
CUSTOMER SATISFACTION
Items
I am very satisfied with the retail brand's products.
Retail brand's products are the right decision. Retail brand's products satisfy my needs.
4. DATA ANALYSIS AND DISCUSSION
Collected data was analyzed by using the Statistical Package for Social Sciences (SPSS), factor and regression analysis as methods from the same computer program, collected data was analyzed. Structure of the sample demographics, reliability of the data and results, and the relationship between the independent and dependent variables under the effect of mood as the mediator were revealed.
4.1. Descriptive statistics for demographic variables
Descriptive statistics used for this questionnaire were gender, age, country of residence, level of education and the current occupation.
4.1.1. Gender
Both male and female respondents are in the sample of this research. From the total number of 300 surveys, 99 were answered by male, and 201 by female respondents. This makes totally 33% of male respondents, and 67% of female respondents.
As the country of residence is one of the most important distinguishing factors for the later analysis and the results of the study, we have analyzed the gender ratio in Turkey and Bosnia and Herzegovina according to the given data. In Turkey, 61 respondents were male, and 89 females. In Bosnia and Herzegovina, the number of male participants is slightly lower with only 38 male respondents, while there were 112 female respondents.
29 Table 5 - Total gender of the sample
Total Gender
Country of residence
Gender Frequency Percent
Turkey Male 61 20 Female 89 30 Bosnia and Herzegovina Male 38 13 Female 112 37 Total 300 100 4.1.2. Age
The age of the respondents ranges between 17 years and 30 years old. Majority of the respondents were aged between 21 to 24 years (68.66%). Five answers are missing; therefore, a total number of answers is 295.
4.1.3. Country of residence
From the total number of 300 respondents in the survey, 50 % (150) of the participants were from Turkey, and the other 50 % (150) were from Bosnia and Herzegovina.
30 Table 6- Country of residence of the sample
4.1.4. Education
The highest educational level of the respondents consists of primary school (2.6 %), high school (32.6%), two-year degree (2 %), bachelor’s degree (51 %), master’s degree (11.3 %) and doctorate degree (0.3 %).
Country of residence Frequency Percent Turkey 150 50 Bosnia and Herzegovina 150 50 Total 300 100
31 Table 7 - Level of education of the sample
Total level of education
Frequency in Turkey Frequency in Bosnia and Herzegovina Total percent Primary school 1 7 2.6 High school 44 54 32.6 Two-year degree 6 - 2 Bachelor’s degree 84 69 51 Master’s degree 14 20 11.3 Doctorate degree 1 - 0.3 Total 150 150 100 4.1.5. Occupation
Occupation of the respondents consists of 239 students (79.6 %), employees in a firm (11.3 %), government sector workers (1.3 %), owners of a business (2.3 %), housewives (0.6 %) and 14 respondents with other occupation (4.6 %).
32 Table 8 - Occupation of the sample
4.2. Cultural values and differences
According to Hofstede (2001), culture is a “collective programming of the mind which distinguishes the member of one group or category of people from another” and five dimensions are used to define the values of culture. These dimensions are “power distance, uncertainty avoidance, individualism, masculinity and long-term orientation” (Hofstede 2009). All the mentioned dimensions are used to describe
Occupation Frequency in Turkey Frequency in Bosnia and Herzegovina Total percent Student 128 111 79.6 Employee in a firm 10 24 11.3 Government sector employee 2 2 1.3 Owner of a business 2 5 2.3 Housewife 1 1 0.6 Other 7 7 4.6 Total 150 150 100
33 how society and individuals of a certain culture behave, what their characteristics are, and based on which factors they make their decisions (Podrug et al. 2006). Hofstede (2001) described power distance as a measurement for the “extend to which less powerful members of institutions and organizations within a country expect and accept that power is distributed unequally”. In different countries and cultures, individuals reflect this either as an issue, or just do not mind the inequality. Uncertainty avoidance is used for “extent to which the members of a culture feel threatened by certain and unknown situations” (Hofstede 2001) measure. Individuals with low uncertainty avoidance are more risk oriented than the ones with high uncertainty avoidance, do not follow rules and are not too scared about things unknown (Hofstede 1980).
Individualism/collectivism is the dimension which measures if individuals of a culture are either more caring about themselves as individual creatures or tend to protect society and are strongly attached to other members of it (Hofstede 2001). Masculinity, as a name states, measures the extent to which gender roles are distinguished; “men are supposed to be assertive, tough and focused on material success, women are supposed to be modest, tender, and concerned with the quality of life” (Podrug et al. 2006). Opposite of masculinity is the femininity, where gender distinction is equal and both male and female care about the life quality rather than materialism (Hofstede 2001).
Long-term orientation is used to describe culture which is future oriented, and opposite of it is the short-term orientation, describing culture holding to their past and being in the present, caring about the tradition and social values (Hofstede and Hofstede 2005, Podrug et al. 2006)
Nowadays, it is crucial to understand how different cultures function, especially for firms who are trying to enter new markets and become global. Moreover, skills of managers by understanding their partners from different regions, different clients and competition are getting stronger and more valuable (Podrug et al. 2006).
34
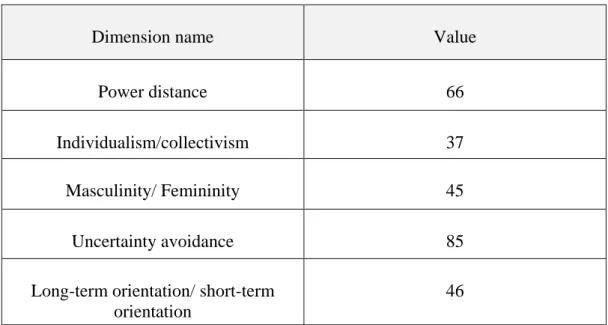
4.2.1. Turkey’s Hofstede dimension values
The five dimensions of cultural values of Turkey are presented in the table below.
Table 9- Hofstede's dimension values of Turkey
Dimension name Value
Power distance 66
Individualism/collectivism 37
Masculinity/ Femininity 45
Uncertainty avoidance 85
Long-term orientation/ short-term orientation
46
Adopted from Hofstede et al. (2010)
4.2.2. Bosnia and Herzegovina’s Hofstede dimension values
Five-dimension values of the culture in Bosnia and Herzegovina are revealed in the table below. The values were not originally measured by Hofstede as they are unavailable in his work. Hofstede (2001) obtained results of five-dimension values for ex-Yugoslavia, including Croatia, Serbia and Slovenia. Podrug et al. (2006) made a research on a sample consisting of graduate students from Croatia, Slovenia and Bosnia and Herzegovina and by using 94 Value survey model questionnaire they got the values of the national cultures (Podrug et al. 2006).
Since the estimated values of cultural dimensions of Croatia and Slovenia, conducted by Hofstede were proved to be similar in the study conducted by Podrug
35 et al. (2006), these values were used to describe culture of Bosnia and Herzegovina for the purpose of this research.
Table 10- Hofstede's dimension values of Bosnia and Herzegovina
Dimension name Value
Power distance 40,78
Individualism/collectivism 73,78
Masculinity/ Femininity 83
Uncertainty avoidance 63,39
Long-term orientation/ short-term
orientation 29,73
Adopted from Podrug et al. (2006)
4.2.3. Comparison of five-dimensions of Turkey and Bosnia and Herzegovina
Based on the five-dimension values of culture, the results of two countries were evaluated and compared.
4.2.3.1. Power distance
Power distance value of Turkey is 66, which is a score indicating society is more tolerant towards inequality, were everyone needs to know their part and role and where the power is split equally (Hofstede et al. 2010). In the working environment, boss and managers are the one in control, while in the households’ father figure is the one who makes major decisions, but everyone knows parts of their obligations (Hofstede et al. 2010).
36 In Bosnia and Herzegovina, with a score 40.78, society is marked with dependence, assurance and equality is an important value (Hostede et al. 2010). Accessibility, reliance and assistance of individuals who are good in something is very common and a society in which individual wants to be a part of decision making process including themselves (Hofstede et al. 2010).
4.2.3.2. Individualism/collectivism
Turkey with a score of 37, has more collectivistic society. Individuals think “we” rather than “I”, are more protective and caring towards group of people who have their trust and are loyal (Hofstede et al. 2010). This kind of societies is proven to be more open toward individuals outside of their group (Hofstede et al. 2010). Families tend to be more patriarchal, and one is very protective and respectful of it (Hofstede et al. 2010).
Bosnia and Herzegovina, on the other hand, scored 73.35, which indicates high level of individualism. This refers to the society being more self-caring, taking care of themselves and closest family (Hofstede et al. 2010).
4.2.3.3. Masculinity/femininity
Score equal to 45 is characterizing Turkey as a feminine society. Quality of the life is one of the most important values in such culture (Hofstede et al. 2010). Gender difference is smaller than in the countries with higher scores, and the society is encouraging relaxation time with families and friends (Hofstede et al. 2010). On the other hand, Bosnia and Herzegovina with a score 83 has a masculine culture. In a society like this, gender roles are distinct, there is a greater gap and value is placed on material rather than on the leisure and quality (Hofstede et al. 2010). Individuals in masculine societies tend to be more competitive (Hofstede et al. 2010).
37
4.2.3.4. Uncertainty avoidance
Uncertainty avoidance is high in both countries, with a score 85 in Turkey, and 63.39 in Bosnia and Herzegovina. In both cultures, society is unpleasant with unknown, and a lot of rules and rituals are followed to allow any risks (Hofstede et al. 2010).
4.2.3.5. Long-term orientation/short-term orientation
Unlike Bosnia and Herzegovina, Turkey, with a score 46 is in the middle point of being future or past oriented, with no principal choice (Hofstede et al. 2010). With a score 29.73, Bosnia and Herzegovina is characterized as a short-term oriented culture, where past is more perceived and thought about than the future (Hofstede et al. 2010). Any change within the society is viewed with cynicism and individuals care about the tradition (Hofstede et al. 2010).
4.3. Analysis of the results
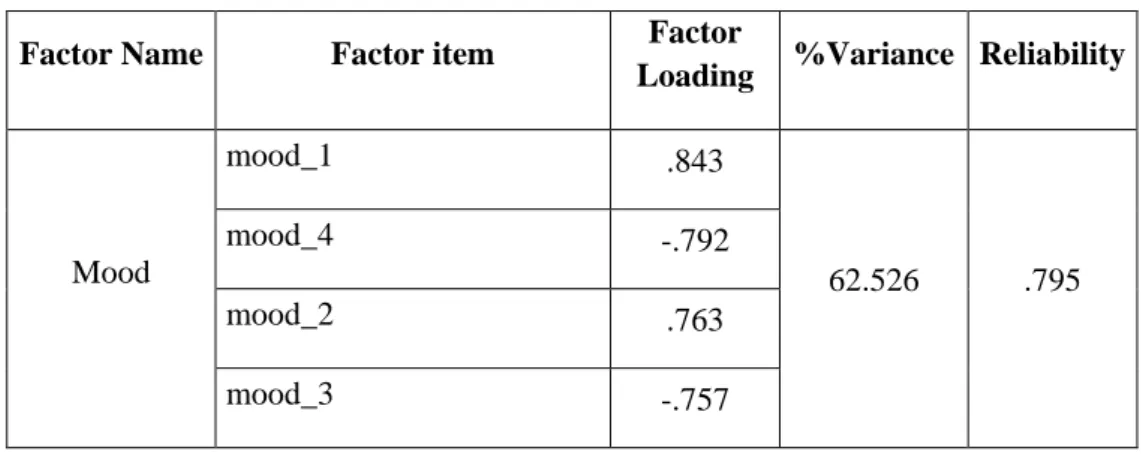
4.3.1. Factor and reliability analysis for mood
The extent] to which the data is useful and suitable for the factor analysis, Kaiser-Mayer-Olkin and Barlett test measures were obtained. The results (KMO=0.699, 2Bartlett test 413.777, p=0.000) were adequate. Anti-image correlation diagonals are all exceeding 0.50, meaning all single items in the factor analysis are to be involved. No items were excluded.
Following these measurements, component analysis and varimax rotation was performed. Cronbach’s alpha coefficient was determined, and it was estimated to
38 be reliable. One dimension was found as a result of the analysis, and its total variance is 62.526%.
Factor items are included in the appendix of the study.
Table 11- Factor and reliability analysis of mood
Factor Name Factor item Factor
Loading %Variance Reliability
Mood mood_1 .843 62.526 .795 mood_4 -.792 mood_2 .763 mood_3 -.757
4.3.2. Factor and reliability analysis for service quality
The extend to which the data is useful and suitable for the factor analysis, Kaiser-Mayer-Olkin and Barlett test measures were obtained. The results (KMO=0.952, 2Bartlett test 5286.379, p=0.000) were adequate. Anti-image correlation diagonals are all exceeding 0.50, and all the factors were included in the factor analysis. Items with loadings smaller than 0.50 and with eigenvalue exceeding 1 were excluded. Following these measurements, component analysis and varimax rotation was performed. Cronbach’s alpha coefficient was determined, and it was estimated to be reliable. One dimension was found as a result of the analysis, and its total variance is 80.636%. As a result of the analysis two items were excluded, E2 and A4.
39 Table 12- Factor and reliability analysis of service quality
Factor Name Factor Item Factor Loading % Variance Reliability Reliability R1 .815 19.589 .931 R4 .748 R2 .713 R5 .701 R3 .678 Tangibles T3 .812 19.140 .933 T4 .796 T2 .792 T1 .747 Responsiveness RES1 .741 16.126 .906 RES2 .732 RES3 .700 RES4 .618 Empathy E3 .734 15.285 .877 E5 .732 E1 .673 E4 .641 Assurance A1 .686 10.496 .909 A3 .641 A2 .632
4.3.3. Factor and reliability analysis for satisfaction
The extend to which the data is useful and suitable for the factor analysis, Kaiser-Mayer-Olkin and Barlett test measures were obtained. The results (KMO=0.768,
40 2Bartlett test 742.795, p=0.000) were adequate. Anti-image correlation diagonals are all exceeding 0.50, meaning all single items in the factor analysis are to be involved. No items were excluded.
Following these measurements, component analysis and varimax rotation was performed. Cronbach’s alpha coefficient was determined, and it was estimated to be reliable. One dimension was found as a result of the analysis, and its total variance is 688.839%.
Factor items are included in the appendix of the study. Table 13 - Factor and reliability analysis of satisfaction
4.3.4. Reliability analysis for perceived brand value
Perceived brand value scale was taken from the study done by Demirgüneş (2015), Peng and Liang (2013) and Omar et al. (2007), and in the literature collected data was shown to be reliable and valid. Thus, only the reliability analysis for the subdimensions (perceived functional value, perceived price value, perceived emotional value and perceived social value) was performed. The obtained results reveal all four subdimensions of perceived brand value to be reliable.
Factor items are included in the appendix of the study.
Factor Name Factor item Factor
Loading %Variance Reliability
Satisfaction
SAT1 .949
88.839 .937
SAT3 .942
41 Table 14 - Reliability analysis of perceived brand value
Factor Name Factor Item Reliability
Perceived functional value PFV1 .898 PFV2 PFV3
Perceived price value
PPV1 .704 PPV2 Perceived emotional value PEV1 .918 PEV2 PEV3
Perceived social value
PSV1
.798 PSV2
PSV3
4.4. Regression analysis of the results
4.4.1. Hypotheses testing for Turkey
The effect of mood as a moderating variable influencing service quality subdimensions and the subdimensions of perceived brand value on customer satisfaction of respondents in Turkey, is presented in the Table 15. The results of the regression analysis, △R2=.113 F=2.806 P= .005< .005, show a significance, and
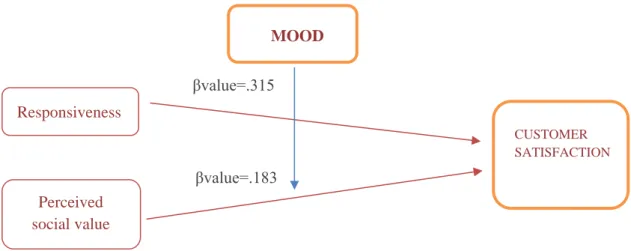
as seen from the Table 15, only responsiveness and perceived social value, moderated with mood, have an impact on customer satisfaction.
Based on the results, hypotheses 1, 2, 3, 4, 5, 6, 7 and 8 are partially supported in Turkey.
42 Table 15 - Regression analysis of the moderating effect of mood on service quality and perceived brand value subdimensions on the satisfaction in Turkey
Dependent variable
Independent variable
βvalue t value P value
Satisfaction Tangibles x Mood -.102 -1.786 .077 Reliability x Mood -.180 -1.859 .065 Responsiveness x Mood .312 2.686 .008 Assurance x Mood -.114 -.857 .393 Empathy x Mood .189 1.226 .223
Perceived functional value x
Mood -.024 -.235 .815
Perceived price value x
Mood -.163 -1.434 .154
Perceived emotional value x
Mood -1.76 -1.585 .116
Perceived social value x
Mood .183 2.156 .033