ELSEVIER
.I. Environ. Radioacfivi~y, Vol. 33 No. I, pp. 91-104, 1996 Copyright @ 1996 Elsevier Science Limited
Printed in Ireland. All rights reserved 0265-931X/96 $15.00 + 0.00 0265-931X(95)00074-7
Dating the Sea of Marmara Sediments by a Uniform
Mixing Model
A. Giikmen, M. Ylldlz
Department of Chemistry, Middle East Technical University, 0653 1 Ankara, Turkey
H. N. Erten
Department of Chemistry, Bilkent University, 06533 Ankara, Turkey
&
i. Salihoglu
Institute of Marine Sciences, Middle East Technical University, P.K. 28, Erdemli, iGel, 3373 1 Turkey
(Received 20 June 1994; accepted 9 November 1995)
ABSTRACT
The sedimentation rates and ‘t”Pb fluxes on sediment surfaces were measured in the north, northwestern and southwestern parts of the Sea of Marmara. Each core had varying thickness of constant 2’0Pb activity regions followed by a decreasing part with sediment depth. The sedimenta- tion rates of the samples collected from the Bosporus and the Dardanelles could not be analysed due to the homogenization of activity in the strong currents of these straits. A untform mixing model is proposed for the simultaneous analysis of sedimentation rates, “‘Pb fluxes and mixing depths from the experimental data. In this model, the parameters were obtained by minimizing the multi-dimensional parameter space using a grid search algorithm. The 2’0Pbfluxes were found to be about 0.048 Bqcm-’ year-t for all sampling sites. The mass sedimentation rates were 0.19 and 0.073gcm-2 year-’ at the shelves of the Bosporus and the Dardanelles and 0.055 and 0.064 g cm-’ year -’ in the northwestern and middle northern basins, respectively, of the Sea of Marmara. Copyright 0 1996 Elsevier Science Limited
92 A. G6kmen et al.
INTRODUCTION
The Sea of Marmara is an almost totally enclosed depression lying between the Black Sea and Aegean Sea having a surface area of approxi- mately 11 500 km* and a total volume of 3378 km3. These two seas are connected by two narrow, shallow straits, the Bosporus and the Darda- nelles. The Bosporus is about 31 km long and 0.7-3.5 km wide, with an average depth of 35 m. The Dardanelles channel is longer (62 km), wider (1.2-7 km) and deeper (average 55 m).
The hydrology of the Sea of Marmara is characterized by a permanent two-layer current, a surface outflow from the Black Sea towards the Mediterranean via the Bosporus, the Sea of Marmara, the Dardanelles and the Aegean Sea, and a bottom inflow from the Aegean Sea toward the Black Sea in the reverse direction (Miller, 1983). This results in a stratified water column: low salinity (22-25%0) water at the top and saline (38.5%0) water filling the rest of the basin. An average bottom current velocity is measured around 25 cm s-’ reaching a maximum value of 60 cm sP1 in the Dardanelles, whereas velocities of 10-20cm s-i are measured in the Bosporus (Ergin et al., 1991). The high current conditions at the bottom of straights wipes off all fine particles, leaving coarse material there.
In addition to the straits of the Bosporus and Dardanelles, a number of rivers and streams drain into the Marmara basins supplying considerable amounts of sediment, primarily from the south. The annual average concentration of total suspended solids in the Sea of Marmara was esti- mated by Basttirk et al. (1986). There are several point sources in the Sea of Marmara contributing large amounts of particulate matter. Among these the Bosporus, the Dardanelles and the rivers and streams in the south may be counted as the most significant. Additional material is derived from coastal erosion, particulate matter flux from the atmosphere and biogenic activity within the Marmara Basin. The particle fluxes from these sources are summarized in Table 1 (Ergin et al., 1991). Large varia-
TABLE 1
Particulate Matter Fluxes in and out of the Sea of Marmara (x IO5 tons year-‘)
Sources InflUX outflux
Rivers and streams 6.5
Atmosphere 2
Particulate organic carbon 2.6
Bosporus 14.5 6
Dating the Sea of Marmara sediments 93
tion of sedimentation rates is expected around the major particulate matter sources, especially around the Bosporus and Dardanelles.
There are a few studies in the literature on the characterization of bottom sediments of the Sea of Marmara. The first published data were on the palyonology of a core from the western Marmara Sea (Koreneva,
1971). The distribution of surficial shelf sediments in the northeastern and southwestern parts of the Sea of Marmara was investigated by Ergin et al. (1991). The radiocarbon dating of the eastern basin sediments of the Sea of Marmara was carried out by Stanley and Blanpied (1980) to study the water exchange between the eastern Mediterranean and the Black Sea in the late Quaternary period. Recently, the sedimentation rate in this basin was determined by the 210Pb dating method and found to be 0.09 g cm-’ year-’ (Evans et al., 1989).
Usually, measurement of the surface sedimentation rate using the 2’0Pb technique is complicated due to physical and biological mixing of sedi- ments at the top sediment layers. Carpenter et al. (1981) have analysed such data by extrapolating the sediment accumulation line to zero while keeping its slope and total area constant under the original 2’oPb profile.
In this study, the sedimentation rates and 2’0Pb fluxes at the sediment surfaces were measured at the north-northwestern and southwestern part of the Sea of Marmara by the 210Pb technique. The samples used in this work were collected from the north-northwestern and southwestern parts of the Sea of Marmara and the two straits, the Bosporus and the Darda- nelles onboard the research ship R/V Knorr using a Soutar Box corer (50 x 50 x 60cm) on its 1989 cruise. The sampling sites are shown in Fig. 1. The samples Ml and M9 were taken from the Bosporus and Darda- nelles, respectively. The samples M2 and M8 are from the southern and northern shelves of the Bosporus and Dardanelles, respectively. These two sites are subject to large particulate matter fluxes from the nearby straits. The last two samples, M.5 and M7 were collected from the two eastern basins of the northern Marmara Sea. The water depth, coordinates of sampling sites and sediment thicknesses of cores are given in Table 2.
A constant 2’0Pb activity region has often been observed extending to several centimetres below the sediment/water interface in many studies (Erten et al., 1985; Robbins & Edgington, 1975; Eakins & Morrison, 1978; Smith & Walton, 1980). Several mixing models have been developed in order to account for this constant activity region (Guinasso & Schink, 1975; Robbins & Edgington, 1975; Robbins et al., 1977; Christensen, 1982). In this study, a novel method, the uniform mixing model, is proposed for the analysis of the 210Pb activity profiles of cores. The model yields the 2’0Pb flux and the depth of constant activity zone at the top of cores besides the sedimentation rate. The sedimentation rates obtained in
94 A. Giikmen et al.
Fig. 1. Sampling sites of the sediment cores recovered from the Sea of Marmara.
this work for the two northwestern basins are compared with the results of Evans et al. (1989) and Stanley and Blanpied (1980). The effect of the two largest point sources of particulate matter, i.e. the Bosporus and Darda- nelles, on the sedimentation rate in the Sea of Marmara is also discussed in some detail.
UNIFORM MIXING MODEL
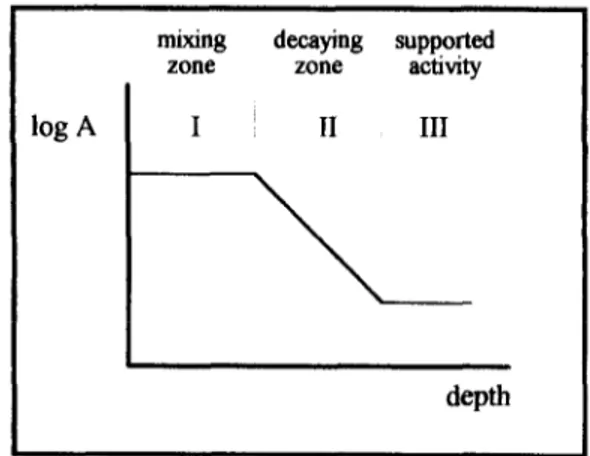
A characteristic 2’0Pb activity curve used in sedimentation rate deter- mination consists of three regions as illustrated in Fig. 2. The first
TABLE 2
The Water Depth, Location and Sediment Thickness of Cores Used in this Work A this work l Evans et.o 0 Stanley Elanpled Station Water depth (m) Ml 54 M2 64 M.5 1226 Ml 1106 M8 65 MP 74 Latitude Longitude (N) (E) 41’11’29” 40” 54’ 48” 40”49’ 48” 40”48’ 26” 40”32’02” 40”01’37” 29”OS 55” 18 28”56’03” 46 27”51’35” 54 27”36’35” 58 27”09’37” 48 26” 15’ 09” 28 Sediment thickness (cm)
95
Dating the Sea of Marmara sediments
mixing decaying supported zone zone activity
log A I II III
Fig. 2. Illustration of different regions of the ‘l”Pb activity profile of a typical sediment core.
constant 210Pb activity region may be due to the biological and physical mixing or the resuspension of 210Pb at the top layers of sediments. The second region corresponds to the decreasing activity of 210Pb with depth. The constant activity in the third region is due to 226Ra parent activity coming from the sea floor, the so-called supported 2’0Pb activ- ity. Radiochronology studies in the literature usually focus on the determination of sedimentation rates. This information may be obtained easily by a linear least-square fitting to the second region of the activity profile. The uniform mixing model developed in this work is used to compute all of the three parameters: sedimentation rate, 210Pb flux on sediment surface and the mixing depth at the top sediment layers, simultaneously from the experimental data. The details of the uniform mixing model are given below.
The unsupported 2’0Pb activity due to atmospheric fall-out and in situ produced component is obtained by subtracting the constant supported activity (i.e. 226Ra-supported “‘Pb) from the measured total activity. A typical unsupported activity profile of a core, after compaction correction, is plotted as the solid line in Fig. 3. This profile has a constant activity layer from top till the mixing depth, x,, followed by an exponential decay region. In the uniform mixing model the activities are expressed separately for these regions. The mathematical expression for the constant activity region may be obtained from the dashed line given in Fig. 3. This line has the same slope as the decaying part of the solid line in Fig. 3. Moreover, the activity profiles of solid and dashed lines have the same total activity. The unperturbed activity of this dashed line may be given as follows:
96 A. Giikmen et al.
Fig. 3. Illustration of unsupported *l’Pb activity profiles for mixed and unsupported sediment samples.
Here, A is the decay constant of *t’Pb, S is the sedimentation rate and x is the depth of the sediment column. The initial activity, Ao, is defined as (Robbins & Edgington, 1975):
A0 = P
Ml - 4)
(2)
where P is the total flux of *lo Pb from the atmosphere and in situ produced component, p is the density and 4 is the porosity of the sediment.
In most of the activity proliles a flat region is observed due to the physical and/or biological mixing of sediment. In this region the decaying activity of the radioisotope is averaged out to yield a constant value.
Two simple relations were used to describe the perturbed activity profiles. The unsupported activity in the mixing zone (i.e. zone I in Fig. 2) is given as:
A, = A if x < x0 (3)
and the unsupported activity after the mixing zone (i.e. zone II in Fig. 2) is defined as:
A, = Ae~~(x-“~)/s if x > x0 (4)
The value of the average activity, 2, in eqns (3) and (4) may be obtained from the condition that the total activity under the activity profiles of
Dating the Sea of Marmara sediments 97
mixed and unperturbed core samples, as shown in Fig. 3, is constant. The total activity for an unperturbed activity profile is obtained by integrating eqn (1) from 0 to infinity, which yields:
The total activity for a perturbed activity profile is obtained in two steps: the area under eqn (3) (= Ax,) is added to the area obtained by integrating eqn (4) from x0 to infinity, which gives:
A;=A
( >
x0+;
The conservation of total activity (i.e. A$ = AZ) yields the relation: x01
A=/&)/
l+T( >
(6)
(7) By substituting eqns (7) and (2) into eqn (4), a nonlinear equation in terms of the fitting parameters, S, P and x0 is obtained after the mixing zone, x0. Equation (3), which is equivalent to eqn (7) is used for the computation of activities within the mixing zone. The analysis of data is carried out by a nonlinear least-square fitting based upon a grid search algorithm (Bevington, 1969). The error function used in the analysis program utilizes eqn (3) for the computed value of activity if x < x0, otherwise eqn (4) is used. The program terminates when the changes in error function is less than 1%.
EXPERIMENTAL
The recovered cores were cut into 2-cm sections. The density, p, and porosity 4, of each section are measured and the results are given in Table 3. The porosities in each core did not show any significant variation with depth, hence average values are given here. The samples collected from the Bosporus and Dardanelles, Ml and M9 have not been included in the table since the strong mixing in these highly turbulent straits made the data analysis impossible.
The concentration of “‘Pb was measured indirectly by counting the alpha particle activity of its daughter, *i’Po. Polonium is a volatile element. It was separated from the sediment samples by heating the samples to 600°C in an electrically heated Pyrex tube and collecting it over a wetted glass wool. Polonium was then extracted from the glass wool by leaching with an acid solution and self deposited on a silver disk. The
98 A. Gtikmen et al.
TABLE 3
The Density and Porosity of Cores
Station M2 M5 M7 M8 Density, p(g cmm3 j Porosity, c$ 2439 0.66 2.63 0.79 2.63 0.75 244 0.73
details of the method are given by Erten et al. (1985) and El-Daoushy et al. (1991).
The alpha-particle activity of 210Po was measured with a silicon surface barrier detector (ORTEC, model No. BA-018-300-100) mounted in a vacuum chamber. The detector signal was fed into an ORTEC Model
109A preamplifier and then to a multichannel analyser (Canberra model 35+) for recording the alpha particle spectrum. The data were stored in an IBM-XT computer interfaced to the multichannel analyser. Most of the samples were counted for 20 000 s but samples with higher activities were counted for 10 000-20 000 s.
The extraction and counting efficiencies for 210Po (& = 5.305 MeV) is usually determined with another alpha-particle-emitting radioisotope of polonium, 208Po (E, = 5.116 MeV). However, the 208Po radioisotope was not available in our laboratory. Instead, a standard 210Pb solution in secular equilibrium with 2’oPo was used to check the overall efficiency of 2’oPo deposition/plating. The deposition time of polonium on the silver disk was optimized. The deposition efficiency reached above 90% after 5 h of deposition at 90°C and stayed constant thereafter.
The detector counting efficiency was determined using a 210Pb standard solution evaporated to dryness on a silver disk. The detector-sample distance was held at 08 cm to prevent the contamination of detector surface by the volatile polonium which might condense on the detector. The alpha particle counting efficiency was found to be 68% for this assembly.
There are different sources of errors in the 210Pb flux and sedimentation rate measurements. The total errors in the measured activity of 210Pb were propagated by adding the squares of the individual errors and found to be between 20 and 50% including counting errors.
RESULTS
The experimental parameters, surface 210Pb flux, mixing depth of sedi- ments and sedimentation rate for sediment cores from the sampling sites
Dating the Sea of Marmara sediments 99
M2, M5, M7 and M8 were obtained from the experimental data using the uniform mixing model. The experimental activity concentrations are given in Table 4 as a function of sediment thickness.
The program developed in this work for the computation of the three parameters 210Pb flux, P, mixing depth, x,, and sedimentation rate, S, was written by using a Turbo Pascal compiler. The computation was carried out in three steps. Firstly, the experimental activities were entered and the unsupported activities were computed by subtracting the supported activities (i.e. the constant activity zone in Fig. 2) from the measured activities. In the second step of the computation, the initial values of the three parameters, P, x, and S, were estimated. Finally, the optimum values of these parameters were obtained by the grid search algorithm as defined above. The search started with the initial parameters and continued until the change in x2 was less than 1%. The search for the minimum in the parameter space converged to the optimum values in less than 10 iterations.
The unsupported 210Pb activities of samples M2, M5, M7 and M8 as computed by the program are plotted in Fig. 4. The errors in the unsup- ported activities were given within lo.
The constant activity regions in the mixing zone of sediment cores are followed by a decreasing activity region with varying slopes. A steeper slope corresponded to a lower sedimentation rate as given in eqn (1).
The mass sedimentation rate o(g cmp2 year-‘) is related to the linear sedimentation rate, S, as follows (Durham & Joshi, 1984):
a(g cmp2 year-‘) = S(cm year-‘) p(g cm-3) (1 - 4) The results of computations are given in Table 5
(8)
TABLE 4
Experimental “‘Pb Activities (Bq g-‘) of Sediment Samples from Sites M2, MS, M7 and M8 Depth (cm) M2 M5 M7 M8 O-2 22-24 0.17 f 0.03 24 0.15 zt 0.03 4-6 0.18 f 0.04 6-8 0.17 f 0.04 8-10 0.14 zt 0.03 lo-12 0.10 zt 0.02 12-14 0.06 zt 0.0 1 14-16 0.10 + 0.02 1618 0.10 zt 0.02 1 S-20 0.05 f 0.01 2&22 0.04 f 0.01 0.06 IIC 0.01 0.52 f 0.05 0.39 zk 0.04 0.37 Ik 0.04 0.24 zt 0.03 0.18 f 0.03 0.14 i 0.02 0.19 + 0.03 0.1 I f 0.02 0.12 f 0.02 0.12 It 0.02 0.10 It 0.02
100 A. Gtikmen et al. Activity ((w&.. M2 M7 0 5 10 15 20 100 10 Z 0 5 10 15 20 Depth (cm)
Fig. 4. The activity profiles of sediment cores M2, M5, M7 and MS.
All the 210Pb fluxes determined for various samples were found to be identical within the uncertainties of measurements. An average 2’0Pb flux of 0,048 f O-01 Bq cm-2 year-’ was found for the Sea of Marmara sedi- ments. The mixing depth of the samples varied between 4 and 11 cm. The mass sedimentation rate was found to be largest, namely 0.19 g cm-’ year-‘, for the samples collected at the southern shelf of Bosporus and lowest, 0.055g cm-2 year-‘, at the northwestern basin of the Sea of
Dating the Sea of’kfarmara sediments 101 TABLE 5
Experimental Parameters, 2’0Pb Fluxes, Mixing Depths and Sedimentation Rates for Sediment Core Samples from the Sea of Marmara
Sample Flux, P Mixing depth Sedimentation Mass sedimentation (Bq cmm2 year-‘) x, (cm) rate, S (cm year-‘) rate w(g cm-’ year-‘)
M2 0.047 f 0.008 7*1 0.19 It 0.07 0.19 Ik 0.07 MS 0.046 f 0.005 4&l 0.12 * 0.03 0.064 It 0.014 M7 0.052 zt 0.006 7fl 0.08 f 0.02 0.055 & 0.014 M8 0.049 f 0.007 11 f 1 0.11 f 0.05 0.073 * 0.03 1 El“ 3 0.12 f 0.02 0.087 f 0.0 12 OEvans et al. (1989); see Fig. 1.
Marmara. The sedimentation rate found at the mid-northern basin, 0.064 g cmd2 year-’ (site M5), was slightly smaller than that measured by Evans et al. (1989), 0.087 gcme2 year-‘, at the eastern basin. The core sampled near the Dardanelles (MS) gave a much lower sedimentation rate, 0.073 g cmh2 year-‘, compared with a similar site near the Bosporus (M2). The sampling site M2 is located on the southern part of Bosporus and is subject to the highest particulate matter flux compared to other locations. The amount of particulate matter carried from the Black Sea via the surface currents in the Bosporus towards the Sea of Marmara is 1.5 million tons and a reverse bottom current transfers about 0.6 million tons of particulate matter from the Marmara Sea into the Black Sea annually, as given in Table 1. Thus, the net particulate matter flux into the Sea of Marmara is about 0.9 million tons annually from this source.
The particulate matter flux in the Dardanelles is just the opposite of the Bosporus. Here, O-9 million tons of particulate matter is carried from the Aegean Sea into the Sea of Marmara by bottom currents and 1.7 million tons of particulate matter is carried out in the reverse direction by surface currents. The net particulate matter outflux in the Dardanelles is about 08 million tons annually. The sedimentation rate measured at M8 location was found to be about half of that at M2 due to the above considerations.
The sedimentation rate measured in this work covers the top 15-20cm of the cores. Assuming an average sedimentation rate of 0.1 cm year-‘, the 210Pb activity is expected to die out within the top lo-15 cm. However, the homogenization of the activity within the top layers pushes the decaying 2’0Pb activity deeper into the sediment core (see Fig. 3).
Some sediment samples collected from the eastern basin of the Sea of Marmara as shown in Fig. 1 had been dated using the 14C (tl = 5730year) technique by Stanley and Blanpied (1980). The samples collected from the site G8 in that work dated as 4700 years at a depth of 100-I 1Ocm. This
102 A. Giikmen et al.
would roughly correspond to sedimentation rates of about O-01 cm year-’ at the top 60 cm and 0.07 cm year-’ between 60 and 1lOcm. The latter sedimentation rate, derived from the difference of two radiocarbon datings, is comparable to our findings. However, the former rate given in that work is nearly a factor of 10 lower than the recent sedimentation rates. The low sedimentation rate estimates from the radiocarbon dating of Stanley and Blanpied’s data was criticized by Evans et al., and it was attributed to the silty composition of the sediments and the long residence time of organic carbon in the sea water. The radiocarbon dates could lead to errors in age estimates of up to about 2000 years (Calvert et al., 1987). The geological composition of the G7, G8 and G9 cores of Stanley and Blanpied at the top 63, 47 and 38cm sections, respectively, were very similar to those of Evans et al. recovered at a site between G7 and G8. Assuming similar constant sedimentation rates in the last 1000 years in sites G7 and El, we estimated the sedimentation rates at G7, G8 and G9 as 0.087 g cme2 year-’ (Evans et al., 1989) 0.065 and 0.052 g cmA2 year-‘, respectively. The latter two values were obtained by scaling the sedi- mentation rate at G7 with respect to the thicknesses of the top layers of these cores with similar geological structure.
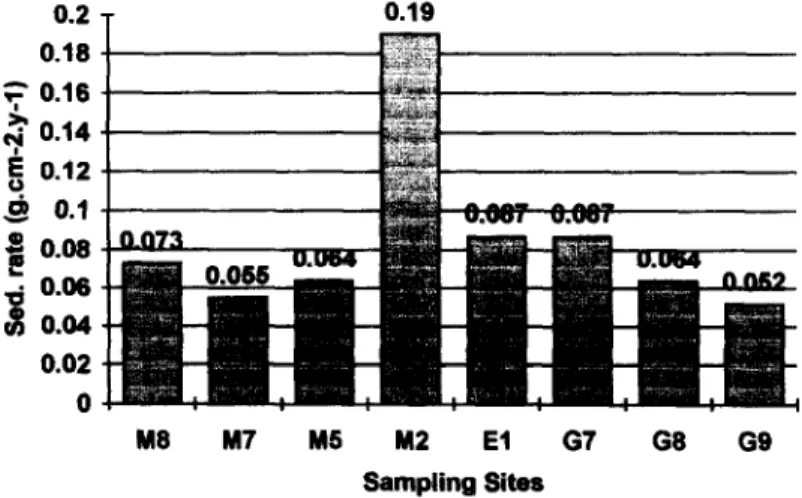
The mass sedimentation rate, co, measured at sampling sites M2, M5, M7 and M8 in this work, El of Evans et al. and the estimated mass sedi- mentation rates at sampling sites G7, G8 and G9 of Blanpied and Stanley are shown in Fig. 5. The locations of these sites have already been shown in Fig. 1. Here, the highest sedimentation rate at the sampling site M2 can be attributed to the large particulate matter flux from the Bosporus. As the distance from the M2 location increases. the sedimentation rates
0.2 0.18 7 0.18 3 0.14 $ 0.12 9 0.1 8 e 0.08 - ;w 0.08 0.04 0.02 0 Y8 M7 M6 M2 El G7 68 GS Sampling Sites
Dating the Sea of Marmara sediments 103
decrease at the three northern basin sites of the Sea of Marmara. The lower particulate flux in the Dardanelles as compared with the Bosporus is reflected in the lower sedimentation rate at MS.
REFERENCES
Basttirk, O., Saydam, A. C. , Salihoglu, I. & Yilmaz, A. (1986). Oceanography by the Turkish Straits, I.; Oceanography by the Turkish Straits, III: Health of the straits; II: Chemical and environmental aspects of the Sea of Marmara. Institute of Marine Science Institute, METU, Icel, Turkey.
Bevington, P. R. (1969). Data Reduction and Error Analysis for the Physical Sciences. McGraw-Hill, New York.
Calvert, S. E., Vogl, J. S. & Southon, J. R. (1987). Carbon accumulation rates and the origin of Holocene sapropel in the Black Sea. Geology, 15, 918-21. Carpenter, R., Bennett, J. T. & Peterson, M. L. (1981). ‘iOPb activities in and
fluxes to sediments of the Washington continental slope and shelf. Geochim. Cosmochim. Acta, 45, 1155-72.
Christensen,E. R. (1982). A model for radionuclides in sediments influenced by mixing and compaction. J. Geophys. Res., 87, 56672.
Durham, V. R. & Joshi, S. R. (1984). Quaternary Dating Methods. Elsevier Science, Amsterdam.
Eakins, J. D. & Morrison, R. T. (1978). A new procedure for the determination of lead-210 in lake and marine sediments. Znt. J. Appl. Rad. Isotopes, 29, 53 l-6.
El-Daoushy, F., Olsson, K. & Garcia-Tenorio, R. (1991). Accuracies in PO-210 determination for lead-2 10 dating. Hydrobiologia, 214, 43-52.
Ergin, M., Bodur, M. N. & Ediger, V. (1991). Distribution of surficial shelf sedi- ments in the northeastern and southwestern parts of the Sea of Marmara: strait and canyon regimes of the Dardanelles and Bosporus. Marine Geology, 96, 3 1340.
Erten, H. N., von Gunten, H. R., Rossler, E. & Sturm, M. (1985). Dating of sediments from Lake Zurich (Switzerland) with 2’0Pb and ‘s’Cs. Schweiz. Z. Hydrol., 47(l), 5-l 1.
Evans, G., Erten, H., Alavi, S. N., Von Gunten, H. R. & Ergin, M. (1989). Superficial deep-water sediments of the Eastern Marmara basin. Geo-Marine Lett., 9, 27-36.
Guinasso, N. L. Jr & Schink, D. R. (1975). Quantitative estimates of biological mixing rates in abyssal sediments. J. Geophys. Res., 80, 303243.
Koreneva, E. V. (1971). Spores and pollen in Mediterranean bottom sediments. In The Micropaleontology of Oceans, Eds B. M. Funnel & W. R. Riedel, Cambridge University Press, London, pp. 361-71.
Miller, A. G. (1983). Mediterranean Sea physical aspects. In Estuaries and Enclosed Seas (Ecosystem qf the World, 26), Ed. B. H. Ketchum. Elsevier, Amsterdam, pp. 2 19-3 1.
Robbins, J. A. & Edgington, D. N. (1975). Determination of recent sedimenta- tion rates in Lake Michigan using Pb-210 and Cs-137. Geochim. Cosmochim. Acta, 39, 285-304.
104 A. Gtikmen et al
Robbins, J. A., Krezoski, J. R. & Mozley, S. C. (1977). Radioactivity in sedi- ments of the Great Lakes: post depositional redistribution by deposit-feeding organisms. Earth Planet. Sci. Lett., 36, 325-33.
Smith, J. N. & Walton, A. (1980). Sediment accumulation rates and geochronol- ogies measured in the Saguenay Fjord using the Pb-210 dating method.
Geochim. Cosmochim. Acta, 44,225.
Stanley, D. J. & Blanpied, C. (1980). Late Quaternary water exchange between the eastern Mediterranean and the Black Sea. Nature, 285, 53741.