НС
ива
.• 3 6 5 î s e s
DECOMPOSITION OF TOTAL PUBLIC AND PRIVATE OUTPUT GROWTH OF MANUFACTURING SECTORS OF TURKEY BETWEEN 1970 AND 1991
A THESIS PRESENTED BY AYŞE BÖKE TO
THE INSTITUTE OF
ECONOMICS AND SOCIAL SCIENCES IN PARTIAL FULFILLMENT OF THE
REQUIREMENTS
FOR THE DEGREE OF MASTER OF ECONOMICS
BILKENT UNIVERSITY SEPTEMBER, 1995
Н С Н ^ 2
I certify that I have read this thesis and in my opinion, it is fully adequate, in scope and in
quality, as a thesis for degree o f Master of Economics / / ^
Assist. Prof Osman ZAIM
I certify that I have read this thesis and in my opinion, it is Rilly adequate, in scope and in quality, as a thesis for degree of Master of Economics
Assist. P ro f Fatma TAŞKIN
I certify that I have read this thesis and in my opinion, it is fully adequate, in scope and in quality, as a thesis for degree of Master o f Economics
Assist. P ro f Faruk SELÇUK Approved by the Institute of Economics and Social Sciences
Director:
ABSTRACT
DECOMPOSITION OF TOTAL PUBLIC AND PRIVATE OUTPUT GROWTH OF MANUFACTURING SECTORS OF TURKEY BETWEEN 1970 AND 1991
AYŞE BÖKE
MASTER OF ECONOMICS Supervisor: Assist. Prof. Osman Zaim
September 1995
The output growth o f the Turkish manufacturing industries are decomposed into three, the change in technical efficiency, change in technological progress and increased input usage between 1970 and 1991. There are various methods to decompose the output growth into two groups, which are the share o f productivity and that o f change in input usage. The method used in this thesis, in addition, enables one to differentiate the technical efficiency from the technological progress. The results o f the decomposition are analyzed in relation with the major macroeconomic variables o f the Turkish economy such as exports, imports and investments. Within this period, special emphasis is given to the years o f 1980 balance o f payment crisis and the following stabilization program. Furthermore, the decomposition is repeated for the public and private manufacturing industries separately. The contribution o f technological progress to output growth, was observed to be dominated by the contributions o f the other two components, for both the public and the private sectors.
Key Words: Output Growth, Technological Progress, Increased Input Usage, Technical Efficiency.
ÖZET
1970-1991 YILLARI ARASINDA TÜRKİYETSİİN TOPLAM, ÖZEL ve DEVLET SEKTÖRLERİ İMALAT SANAYİSİ ÜRETİM ARTIŞLARININ AYRIŞTIRILMASI
AYŞE BÖKE
YÜKSEK LİSANS TEZİ, İKTİSAT BÖLÜMÜ Tez yöneticisi: Assist. Prof. Osman Zaim
Eylül 1995
1970-1991 yıllan arasında, Türk imalat sanayisi üretimindeki büyüme, teknik verimlilikteki değişim, teknolojik ilerleme ve kaynak kullanımındaki artış olmak üzere üçe aynimıştır. Üretim artışını, üretkenlik ve kaynak kullanımındaki artış olmak üzere ikiye ayıran pekçok metot vardır. Bu tezde kullanılan metot, buna ilave olarak, teknik verimlilikteki artışı, teknolojik ilerlemeden ayırma olanağını sağlar. Aynştırma sonuçlan, ihracat, ithalat ve yatınm gibi, ekonominin temel makroekonomik değişkenleri ile bağlantılı olarak incelenmiştir. Bu süre dahilinde, 1980 ödemeler dengesi krizi ve sonrasındaki stabilizasyon programının yaşandığı yıllara ağırlık verilmiştir. Aynştırma işlemi, özel sektör ve kamu sektörü için ayn ayn tekrarlanmıştır. Özel ve kamu imalat sektörlerindeki üretim artışında, verimlilikteki artışı ve değişen kaynak kullanımı paylannın, teknolojik ilerlemenin payına göre daha fazla olduğu görülmektedir.
Anahtar Kelimeler: Üretim Artışı, Teknolojik İlerleme, Kaynak Kullanımındaki Artış, Teknik Verimlilik.
I would like to express my gratitude to Assist. Prof. Osman Zaim for his valuable supervision and interest in the improvement o f this study. I am grateful to Assist. P ro f Fatma Taşkın for her constructive suggestions. I am also grateful to Assist. Prof. Faruk Selçuk for his valuable comments.
Acknowledgements
Contents Abstract ii Özet iii Acknowledgements iv Contents V List o f Tables vi 1 Introduction 1
2 Economie Situation o f Turkey Between 1970 and 1991 3
3 The Method and Data Used in the Empirical Study 8
4 Discussion o f the Results 12
i. ) Decomposition Results o f the Total Output 14
ii. )Comparison o f the Output Growth Decomposition o f the Public
and Private Sectors 28
5 Conclusion 36
APPENDIX 38
L ist o f T ab les
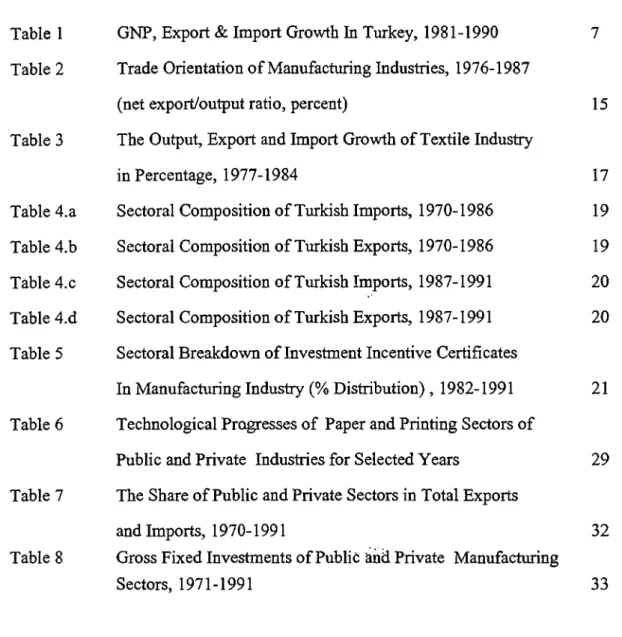
Table 1 GNP, Export & Import Growth In Turkey, 1981-1990 7
Table 2 Trade Orientation o f Manufacturing Industries, 1976-1987
(net export/output ratio, percent) 15
Table 3 The Output, Export and Import Growth o f Textile Industry
in Percentage, 1977-1984 17
Table 4.a Sectoral Composition o f Turkish Imports, 1970-1986 19
Table 4.b Sectoral Composition o f Turkish Exports, 1970-1986 19
Table 4 . C Sectoral Composition o f Turkish Imports, 1987-1991 20
Table 4.d Sectoral Composition o f Turkish Exports, 1987-1991 20
Table 5 Sectoral Breakdown o f Investment Incentive Certificates
In Manufacturing Industry (% Distribution) , 1982-1991 21
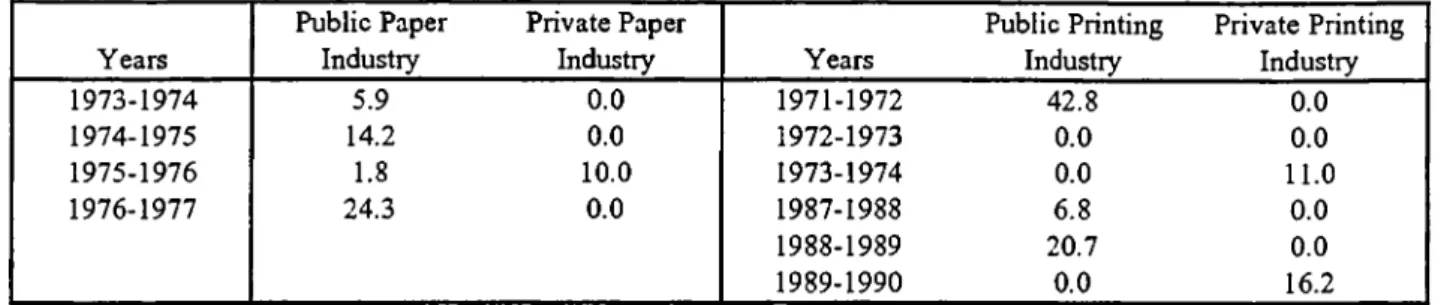
Table 6 Technological Progresses o f Paper and Printing Sectors o f
Public and Private Industries for Selected Years 29
Table 7 The Share o f Public and Private Sectors in Total Exports
and Imports, 1970-1991 32
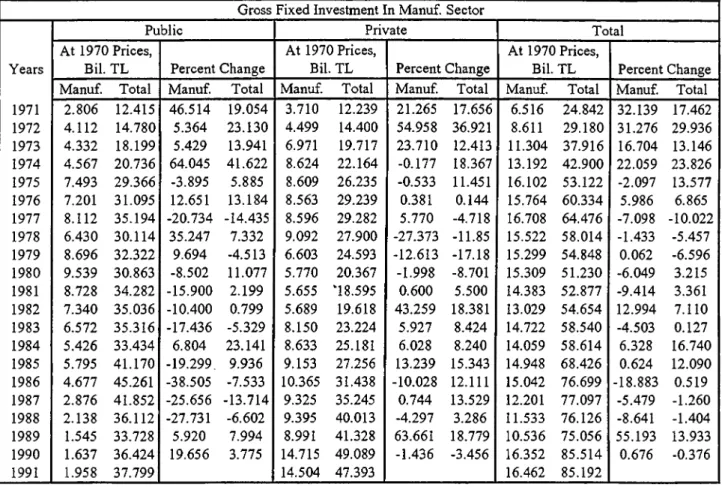
Table 8 Gross Fixed Investments o f Public and Private Manufacturing
Sectors, 1971-1991 33
I. INTRODUCTION
By observing the economic development o f both the industrialized and newly industrializing countries, it is safe to infer that industrialization is a necessary condition to achieve a desired and continuos level o f output growth. For the countries like Turkey, it can be considered as an indicator o f development.
The improvements in the manufacturing sector, consisting o f consumer goods, intermediate products and investment goods, therefore, carry the natural responsibility o f accelerating and reinforcing the other sectors' output growth.
The importance that an industrializing country gives to the development o f its manufacturing sectors is closely related to its social and economic objectives, political situation and also to the current balances and trends o f the world. These variables, in turn, affect the productivity, efficiency and technological progress o f the manufacturing sectors.
Turkey's industrialization process begins with the investments o f an interventionist state which is followed by the weak efforts o f the private sector. Until 1980's, it is thought that industrialization was essential and in order to make our industries survive they had to be protected fi'om foreign competition. The additional adverse effects o f the world crisis o f the 1970's lead to the import substitution policies which tie the domestic production and the domestic demand together. Following the debt crisis in 1980, the utilization o f a qualitatively different and radical reform program has become necessary. 1980 stabilization and the structural adjustment program was implemented under these circumstances. A considerable change in the structure o f the foreign trade policy and the new export-oriented grovrih strategy widely altered the scene o f the economy. All these policies had profound effects on the progress o f manufacturing industry.
In this study, Turkey's industrialization process between, 1970 and 1991 is investigated. The choice o f this period is justified when one remembers that, the economy has experienced the second stabilization program with the IMF in 1970, world economic crisis in 1970s, the government's debt crisis through the end o f 1970s, and the January 1980 stabilization program and the following expansion in the foreign trade during these years. The major objective o f this
-1-investigation is to decompose the rates o f the output growth in 26 manufacturing sectors into three groups, namely the change in technical efficiency, the technological progress and the increased input usage and then relate the patterns o f growth o f these three groups to some important economic variables such as foreign trade growth and investments. To classify the manufacturing sectors. International Standard Industrial Classification (ISIC) is used. State Planning Organization has been using this classification for five years. The decomposition is repeated for the public and private sectors' output, as well as the total output. The aim o f working on the private and public sectors separately is to evaluate the changing output and input levels, technologies and efficiencies o f each o f them, in relation with the other, to discover the leader one in carrying and imposing new technologies, if there exists one, and to observe that whether changing policies in the past, about the roles o f the public and private sectors could receive considerable response. The collected data includes the total output o f the 26 sectors between the years 1970 and 1991, however the number o f sectors which are examined, is not the same for the public and private output. The private industry has not been active in the petroleum refinery sector, that's why its output has been zero for most o f the time during the last two decades. As a result, the decomposition o f output o f only 25 sectors are available for private industry. Furthermore, the analysis could be repeated for only 20 sectors for the public manufacturing industry. Public sector has not been contributing to the production o f the furniture, leather products, rubber, plastics, cement and other non-metallic products and professional and scientific equipment in most o f the years during 1970-1991.
After clarifying the shares o f technology, efficiency and input usage in the output growth, the behaviour o f these shares is explained in relation vrith the major macroeconomic variables which were expected to have an impact on the trends o f the manufacturing industries' output.
The second section includes a brief survey on the economic portrait o f Tiukey in the last two decades. The third section describes the method and the data used in the empirical study on the output growth o f the manufacturing sectors and the fourth section discusses the reasoning behind the characteristics o f the output growth. Finally, the fifth section briefly concludes the study.
-II. ECONOM IC SITUATION OF TURKEY BETW EEN 1970 AND 1991
Turkish industrialization process, which began with the interventionist government enterprises, has been affected heavily by the import-substitution policies including the protection o f domestic industry. There have been various ways o f protectionism, which were used by the Turkish government from 1930s till 1980s, such as strong incentives given to the domestic investors, creating state enterprises in many o f the industrial sectors, and a number o f foreign trade policies including quotas and tariffs. In 1960, furthermore, State Planning Organization has come to a position o f guiding the private sector enterprises as well as controlling the State Economic Enterprises (§enses, 1994).
The conditions that carry Turkey to 1970s, were not so favorable. The conditions that made the 1970 stabilization program necessary were as follows:
A short glance at the economy shows an increasing trend in the growth o f production during 1960s and the first half o f 1970s. The annual percentage change o f real GNP per capita over preceding five years in 1965, 1970 and 1975, were 2.4, 4.1 and 5.0 respectively. Although 1960s and the beginning o f 1970s were characterized by rather high growth rates, there were problems such as the share o f exports in the composition o f GNP being very low, the accumulation o f high amounts o f debts to official and private investors, the uneven inflation rate and the inflationary effects o f government investment in infrastructure.
These indicators were observed by the government leading to an attempt o f avoiding the repetition o f the shortcomings o f the economic situation, such as low growth rates, balance o f payment crisis and import cuts experienced before 1958. The devaluation immediately follovring the 1970 program naturally brought an increase in the foreign trade receipts and in the volume o f exports. However even before the oil price increase in 1973, inflation has begun to go up during 1971-1973. Again during this period, foreign trade liberalization and export-oriented policies were tried to be imposed, but they were short-lived. Increase in public sector activity financed by the foreign exchange earnings and the remittances o f Turkish emigrant workers, both having been increased by the 1970s devaluation, had an impact on the industrialization process. However, the pattern o f industrialization, although leading to a growth in manufacturing output, has been
carrying the indicators o f interventionism and protectionism. A number o f foreign trade policies were being used to restrict the imports and exports. One example to these policies was the import licensing. Such import programs were provided to protect domestic manufacturers , regulate the imports as well as restricting them. They were utilized till the reform program in 1980 was implemented. As a similar process, export lists, which consisted o f items having the same exchange rate, have been put into practice in 1975. This practice was a derivative o f the commodity-specific export exchange rate. The variety o f tariff rates, periodically changing import lists, delays in getting the import licenses and the overvalued exchange rates constituted the complex trade regimes in 1970s. The constrained import capacity due to the above mentioned protectionist trade regime caused the capacity utilization rates to drop to such levels that the average annual growth rate o f manufacturing investments declined to -10.2 percent during 1977-80, whereas it was 7.5 percent in the period 1963-1977 (§enses, 1994).
Since the government was the main importer o f petroleum and it could not adjust the oil price properly within the country after the sharp increase in the price o f oil in 1973, a high bill o f oil was added to the current account, resulting in a serious fiscal deficit in the balance o f payment, in 1975. This deficit was tried to be supported by the heavy short-term borrowing from outside.
It was inevitable that manufacturing industries as well as other production facilities o f Turkey has been affected by these structure and policy changes. Manufacturing value added and manufacturing value added per man increased by 5.1 percent and 2.7 percent per annum on average for the period 1976-1987 respectively. I f these figures are compared with the ones belonging to the previous period 1961-1976, a significant deceleration can be observed. Annual increases o f these related variables were 9.5 percent and 5.4 percent for 1961-1976 respectively.
The structure o f the manufacturing output has changed as well as its magnitude. There has been a decrease in the share o f consumer goods and an offsetting increase in the share o f intermediate goods, especially in the chemicals and non-metallic products wdthin this group. The share o f manufacturing in GDP has risen also, from its level o f 14.1 percent in 1963 to 19.1 percent in 1979.
This growth performance, however, should not hide the fact that the trade payments and production regime before 1980s in Turkey were causing serious structural problems which would
-4-bring the economy into a bottleneck in the future. The import substituting industrialization policy, the maintenance o f a fixed nominal exchange rate, and a heavy protection for a long period o f time combined with the foreign currency shortage and the short-term credits spent on the infrastructure, have come together to result in the serious and extreme chaos in 1980. The serious declines in the levels o f output in most o f the manufacturing sectors between 1977 and 1980 were the evidences o f the 1980 crisis.
Krueger and Aktan (1992) have classified the conditions preparing the crisis towards the end o f 1970s into four groups on which all analysts agree. First one is the incapability o f government in adjusting the oil prices to the 1973 price increase; the second one is the excessive usage o f foreign currency reserves and foreign market debt instruments to finance the growth during 1973-1976; the third one is the obvious result o f heavy import-substitution policies, namely the inefficiencies o f the manufacturing sectors; and the final one is the low export earnings, mainly due to the overvalued exchange rates.
The 110 percent inflation rate at the beginning o f 1980, the 0.5 percent annual average growth in real GNP per capita, for the period 1975-1980, the small portion o f exports in the composition o f GNP, the shortages o f imported goods, the non-existence o f foreign exchange reserves, high fiscal deficit and foreign debt have led the government to take radical decisions about the structure o f the economy's working principles; foreign trade regime and industrialization policies. January 1980 program had some characteristics that made it different from the previous adjustment programs like the ones in 1970, 1977 and 1978. The reforms in 1980 were qualitatively different from the earlier programs in the sense that they included a general liberalization o f the economy as well as the usual stabilization measures. Exchange rate policy, foreign trade and internal pricing policies were among the items constituting the liberalization policy.
The fixed exchange rate policy which has been dominant among the determinants o f the restricted foreign trade was announced to be replaced with a more flexible exchange rate policy. As it has been the tradition o f all the stabilization programs o f Turkish economy, an immediate devaluation o f about 50% was realized. When this devaluation was combined with a number o f incentives for exporters, the export share in GNP has increased following the 1980 program. In addition to these, the Central Bank has given up the policy o f controlling interest rates and putting
maximum rates o f interests. In 1980, interest rates were deregulated and set free. The exchange rate was depreciated almost yearly after the first sharp devaluation. The duties on imports were ignored and export credits and subsidies were made more attractive. This encouraged the output growth o f some domestic products which has been using the imported goods as intermediate inputs. Heavy bureaucratic procedures were simplified in favor o f exporters. The average tariff rate has been reduced by almost 20 percent, the import lists were enlarged and administrative import procedures were simplified.
To minimize the budget deficit cumulated during the 1970s, government performed some adjustments on the prices o f the State Economic Enterprises' outputs. The first and simplest measure was to increase these prices, and left the determination o f them to the market. This had a negative impact on the domestic demand. These measures were among the structural adjustment measures on the fiscal policy o f the government.
The other side o f the coin showed that the situation o f labour force has been worse o f during the adjustment program. The decline in the index o f real wages from its level o f 100.0 in 1980 to 89.3 in 1988 and the index o f real labour costs from 100.0 in 1980 to 65.8 in 1988 are evidences o f the restricted collective bargaining wage negotiations, strikes and the weights o f the trade unions (Çenses, 1994) . The result has been a decline in the prime costs o f the producers during this period. Some economists consider this as a disincentive for the producers to implement new technologies to increase their profits, and therefore as a reason o f the mediocre productivity performance in 1980s.
After the elections in 1983, the objectives o f the government has shifted to the liberalization o f the trade regime. Conforming to the policies for liberalization o f trade, all the policies o f import substitution were eliminated except the price measures in 1990. Heavy tax rebates, export subsidies and credits, administrative efficiency and other encouraging incentives given to the exporters have risen the share o f exports subsidies in exports to 25 percent during the period 1981-1985 (Yeldan,
1994).
The decrease in the control o f government on the private sector investments and enterprises through State Planning Organization indicated the intents o f government in diminishing its role in industrialization and giving the more important role to the private sectors.
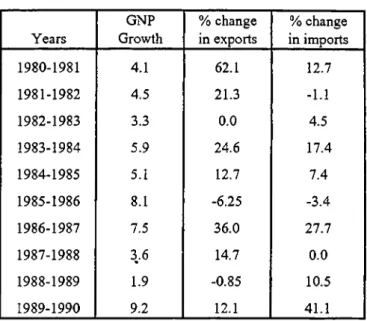
-6-The results o f all these trade liberalization efforts and measures taken can be observed in the percentage increases in the exports and imports as compared with the GNP growth in Table I. Between 1980-1985, exports grew at an average annual rate o f 22.2 percent and more importantly, the share o f 7.1 percent o f exports in GNP in 1980 has risen to 21.3 percent in 1987 (Krueger and Aktan). That is an evidence o f exports being the accelerator o f growth.
Years GNP Growth % change in exports % change in imports 1980-1981 4.1 62.1 12.7 1981-1982 4.5 21.3 -1.1 1982-1983 3.3 0.0 4.5 1983-1984 5.9 24.6 17.4 1984-1985 5.1 12.7 7.4 1985-1986 8.1 -6.25 -3.4 1986-1987 7.5 36.0 27.7 1987-1988 3.6 14.7 0.0 1988-1989 1.9 -0.85 10.5 1989-1990 9.2 12.1 41.1
Table I : GNP, Export & Import Growth In Turkey, 1981-1990 Source: Central Bank o f Turkey, Annual Report
Going parallel with the exports, the share o f imports in GNP has risen, from 15-17 percent towards the end o f 1970s to 22 percent per annum after 1984. This is not surprising since the huge tax burden and protectionist policies' effects were increasing the domestic price o f the imported goods before 1980. The figures above, are related to the overall growth o f exports and imports without emphasizing the individual sectors. Additional division indicates that industrial sectors have been the leading sectors among others from the point o f view o f increased export revenues. This, o f course, brought an increase in the share o f industrial goods in the export earnings. 57 percent share o f agricultural products in total export earnings in 1975 has fallen to 18 percent in 1989, whereas the share o f industrial goods in total export revenues has risen from 36 percent in 1975 to 78 percent in 1989. Furthermore, the composition o f industrial goods has shifted towards manufactures from processed agricultural products. Share o f manufactures in total export earnings
has risen from 24 percent to 68 percent for the same years, whereas the share o f processed agricultural products has declined from 9.2 percent to 7.9 percent in 1975 and 1989 respectively.
An outlook to the Turkish economy during 1980s shows that during the first three years o f the decade, the main objectives o f the 1980 stabilization program were succeeded. After 1983, the attention was given to the structure o f the economy and especially the structure o f the foreign trade regime. It is safe to infer that the stabilization and structural adjustment program has been effective and successful especially in the foreign trade regime and the financial markets, but failed to conform its initial purposes in the government expenditures.
III. THE M ETHOD AND DATA USED IN THE EM PIRICAL STUDY
The values o f the annual products in current prices o f 26 sectors for the total; 25 sectors for the private and 20 sectors for the public manufacturing industry between 1970 and 1991 are used in the empirical study to decompose the rate o f growth o f outputs into three parts. The first part is the rate o f change in technical efficiency, which is defined as the distance o f current production by using a set o f specified inputs, from the maximum feasible level o f production that could have been produced by using the same set o f inputs. The second part is the technological change that is defined as the change in the capability o f a manufacturing sector, in other words the change in the maximum level o f production that a technology can achieve by using some specified set o f inputs. The final part is the change in input usage which is the residual o f the growth in output when the changes due to the technical efficiency and the technology are subtracted from it.
The values o f output that are compiled in current Turkish Lira are converted into the real values by using 1970 constant prices with the utilization o f the industrial raw materials and semifinished goods index o f The Evaluation Department o f the Undersecreteriat o f Treasury and Foreign Trade, Prime Ministry. The set o f inputs includes three variables. They are the annual average number o f employees, the annual total converting power capacity and the real value o f the total inputs including raw materials. The nominal values o f the total inputs are converted into constant Turkish Lira by using the price index mentioned above. For some sectors, input and
-8-output values between 1973 and 1991 could be compiled, therefore the empirical analysis for these sectors was performed for this period.
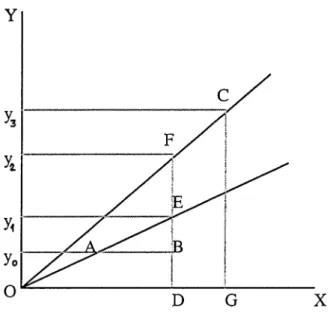
Figure 1 is taken from the 1988 study o f Aly and Grabowski to illustrate the decomposition o f output.
Fig. 1 : Output Decomposition
The input vector is shown on the horizontal axis and the output is shown on the vertical axis. The points A, B and C represent the data on all the past years, the current year and the next year respectively. The ray OA is the constant returns to scale production frontier constructed by using the points A and B, whereas the ray OF is the one constructed by using the points A, B and C. Between the years B and C, BE represents the share o f increased efficiency, EF represents the technological innovation and FC represents the increased input usage and they constitute the overall output increase from yo to y
3
.The decomposition is performed in three steps. In the first step, a production frontier is constructed for each year for the period 1970-1991. These frontiers give the values o f maximum possible output quantities by using the actually used input quantities for each year and the distance o f the output level to this frontier, namely the inefficiency o f production. The below written linear programming problem constructs the frontiers.
Max. Q; subject to: Z N (i)z (i)< N (n ) E P(i)z(i) < P(n)
£ I(i)z(i) < I(n)
£y(i)z(i)> Qy(ii) ;
where i changes from 1 to the current year's index number, which is n. N, P and I are the three inputs which are the annual average number o f employees, the annual total converting power capacity and the real value o f the total inputs including raw materials. The left hand sides o f the first three constraints, that are the input constraints, calculate the theoretically efficient observation for the year, n, which is actually some linear combination o f the current observation and all the previous observations. After finding these most efficient levels o f N, P and I; they are compared with the actual levels o f inputs. The input constraints make sure that the intensity vector z(i) is such that, it makes the theoretically efficient level o f observation at most equal to the realized level input. The left hand side o f the last constraint measures the theoretically efficient observation which must be at least equal to the actual output. If the actual output, y(n) is efficient, then Q is equal to 1, otherwise it should be greater than 1. If the figure above is considered, Q is yj/yo which is greater than 1.
Second step includes the construction o f a second type o f frontier for each year to calculate the extent o f technological progress by using the following linear programming.
Max. Q |; subject to:
' V i
2 N (i)z(i)< N(n)
ZP(i)z(i)< P(n)
£ I(i)z(i) < I(n)
£y(i)z(i)>Q iy(ii) ;
where i changes from 1 to n+1 this time. The new frontier, which is OF in Figure 1, is calculated by using the next year's observation as well as the past years' observations and the current year's observation. For the observation B in Figure 1, Q i is equal to y2/yo ·
Third step is to calculate the share o f the increased input usage in the output growth. It is fairly simple to find the annual increase in the output levels for each sector, therefore the subtraction o f the changes due to the technical efficiency and technology from the increase in production gives the change in input usage. The percentage output decomposition from the level B to C, shown in Figure 1, is summarized below.
-Efficiency Increase Technological change Increased Input Usage Output Growth
( y i / y o ) - i (y 2 -y iV y o (y 3 -y 2 )/y 0 (y 3 -y o )/y o
Q-1 Q i-Q calculated as the residual (y 3 - y o y y o
The decomposition o f public sectors' output and the private sectors' output have been performed separately in order to observe their efficiency performances, technology transfers and changing input usage in addition to the decomposition o f the total output.
The sector classification o f the State Planning Organization, called ISIC is used and it is given below.
Sectors
Consumer Goods
ISIC Code Num bers
Beverages 313 Tobacco 314 Textiles 321 Clothing Intermediates 322 Forestry Products 331 Furniture 332
Paper and Paper Products 341
Printing and Publishing 342
Leather Products 323
Shoe Industry 324
Rubber 355
Plastics classified elsewhere 356
Chemicals 351
Other Chemistry Products 352
Petroleum Refinery 353
Other Petroleum and Coal Derivatives 354
Glass 362
Pottery, China and Earthenware 361
Cement and Other Nonmetallic Products 369
Iron and Steel 371
Nonferrous Metals
Investment Goods and Consumer Durables
372
Metal Products 381
Non electrical Machinery 382
Electrical Machinery 383
Transport Equipment 384
IV. DISCUSSION OF THE RESULTS
In this section, the results o f the empirical study are given and the conditions that has possibly caused the outputs o f the sectors in manufacturing industry to grow in the described manner in Appendix in Tables A .l, A.2, A.3 are discussed within the environment o f Turkey during 1970-1991.
Within this period, the impacts o f the 1980 balance o f payments crisis and the following measures on Turkish development are the most important determinants o f the output growth. Many o f the items in the stabilization program have aimed the liberalization o f the trade regime, shifts in the composition o f exported and imported goods and the industrialization o f the economy which mean that, it is natural to expect the 1980 program to affect the output growth pattern o f the manufacturing industry both qualitatively and quantitatively.
The details o f the pattern o f the growth rates o f the 26 sectors will be discussed later in this section, however, it is useful to examine some common behaviours o f the manufacturing sectors.
The performance o f manufactured exports after 1980 is frequently cited in illustrating the success o f the 1980 reforms. It is a fact that, the commodity composition o f exports has shown a change, as manufactured exports grew faster than the total value o f exports. The share o f manufactures in total exports has increased from 36 percent in 1980 to above 70 percent by the mid-1980s. Further disaggregation o f this category, on the other hand, reveals that only three categories, textiles, clothing and iron and steel, have together constituted around two-thirds o f the total manufactured exports (Çenses,1990). Textiles have remained as the most important sector in export performance, with their share rising from 15 percent in 1980 to 25 percent in 1986. The iron and steel industry has emerged as the second most important export industry.
However, the growth in exports did not stem from the implementation o f new technologies due to the increased competitiveness and the establishment o f the new export industries, but from the existing capacity in industries that had been producing mostly for the domestic market before 1980. Prior to 1980, the decreasing input usage, which leads to contraction in output, have been common to many o f the sectors. Following the stabilization program, increases in efficiency and
-input, combined with the weak technological progresses were observed. The investigation o f the foreign trade and investment performance, and the output growth pattern o f the manufacturing sectors together results in four main factors that shaped the characteristics o f the most o f the sectors' output growth during 1980s.
i) There existed a contraction in most o f the sectors' output during the years o f crisis before 1980. This contraction was mainly due to the decreasing input usage which stemmed from the import shortages. It was unavoidable to have an excess capacity and losses in efficiency caused by the continues deceleration in input usage.
ii) The stabilization policies after 1980 led to a contraction in the domestic income. Depressed
domestic demand after 1980 has been a crucial factor in explaining the export boom without a considerable technological innovation. In this environment, exports provided an alternative to falling domestic demand for the producers.
iii) A strong factor affecting the production and trade performance was the link between the manufactured export growth and earlier experience with import substitution. Long periods o f protection encouraged the traditional import substitution industries such as textiles, iron and steel and glass, to enter export markets.
iv) With the elimination o f the domestic demand through the end o f 1980s and the adjustments o f production lines to the excess capacity o f 1970s, there is an urgent need to create new capacities in manufacturing through new investments. This is apparent from the sharp increase in the ratio o f exports to GNP during 1980s. In contrast, fixed investments in manufacturing has been decreasing. This was mainly due to the fall in public sector investments conforming to the objective o f the 1980 program o f decreasing the role o f government. On the other hand, private sector did not perform new investments in the manufacturing sectors required to develop technological progress. §enses thinks that, although it would be in conflict with the privatization objective o f the stabilization program, public sector investments in carefully selected projects may also be required to increase in capital goods producing sectors and may, in the process, create a favorable environment for private sector investment (§enses, 1990). The acceleration o f product diversification in the export markets, in favor o f the investment goods must be realized in order to continue the growth o f output and exports.
It will be more explanatory to divide this discussion into two parts where the first part includes the connection o f the trends o f the major macroeconomic variables such as exports, imports and investments with the decomposed growth values o f the total output o f the related sectors without separating it into the shares o f public and private industries. The second part includes the connection o f changing policies and economic balances with the public and private sectors' output growth characteristics.
/.) Decom position Results o f the Total Output
The composition o f total manufacturing output growth in 26 sectors, namely the increase in the efficiency, technological progress and the altered input usage are given in Appendix, Table A .I. To be able to evaluate the growth behaviors, it is useful to recall that these 26 sectors can be divided into three main groups as consumer goods, intermediates and investment goods and consumer durables. The first group includes food, beverages, tobacco, textiles and clothing whereas the second group includes wood products, paper and its products, printing and publishing equipment, leather products, rubber and plastics, chemicals, petroleum products, glass, pottery, china and earthenware, cement and other nonmetallic products, iron and steel and nonferrous metals. The last group involves the engineering products which are metal products, non-electrical machinery, electrical machinery, transport equipment and scientific equipment.
I f the performances o f the above mentioned three broad groups are analyzed, the following results are obtained.
1. Consum er goods: For the period 1970-1978, the dominant determinant o f change in output has been the change in input usage for the consumer goods except for the beverages. While the highly fluctuating quantity o f inputs has been almost the only effect changing the output in the tobacco industry in this period, the other two determinants o f output path have had a role, although limited, in the textile and clothing industries. The economy has been specializing in the consumer goods excluding the beverages after 1980. The output o f these sectors have been increasing mainly due to the increased input usage, and the increasing output has been shifted to the world markets. As a result, the net export/output ratio o f consumer goods in general has been going up in 1980s (See Table I I ) .
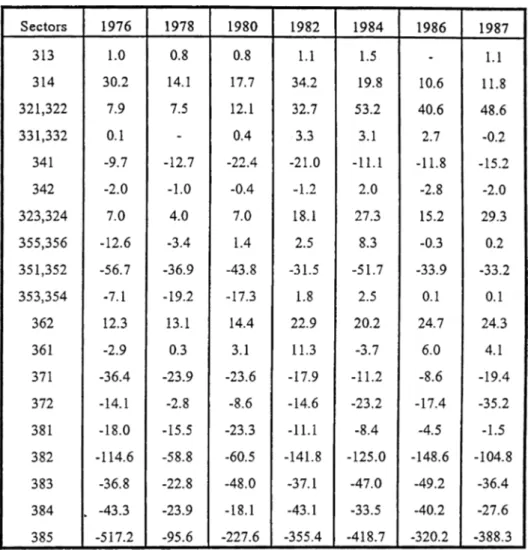
-14-TABLE I I : Trade Orientation of Manufacturing Industries, 1976-1987 (net export/output ratio, percent) Source: Türel, 1993, computed from SPO Annual Programs.
First o f all, the beverages, with ISIC code number 313, which has been an exception within the consumer goods group, is analyzed. The technological progress in this sector was confined to rates less than 10 percent and was not a major determinant o f output growth. Conforming to the petroleum crisis in 1973, the output has fallen 25.8 percent and 2.2 percent during 1972-1973 and 1973-1974. During next year, an efficiency increase o f 22.4 percent and an input usage rise o f 54.2 percent have come together to make a peak o f 81 percent, in the output growth o f beverages. Both the export and import values o f beverages have been going up gradually most o f the time between
1987 and 1991, but the share o f this sector in total exports and imports have not been so high.
-There were two peak values in the quantity o f input usage in the tobacco industry, whose code number is 314, first between 1970-1971 and the second between 1974-1975. The first increase amounted to 45.0 percent and partly offset during the following two years and the second increase was 36.7 percent which was offset by a 38.1 percent decrease during 1977-1978. At the beginning o f the 1970s, Turkish tobacco industry has been a net exporter. In 1976 for example the difference between exports and imports divided by total output, which is the net export/output ratio, was 30.2 percent, a comparatively high ratio for the overall economy (See Table II). The sharp increase in input usage between 1974-1975 has made this much o f net exports possible. Following the steep decline in the output for the tobacco industry in 1978 with respect to 1977, an efficiency increase between 1978-1979 has partly offset the 49.5 percent decrease in input usage in the same year. From 1978 on, input usage has been declining considerably. This fall roughly conforms to the slowing down o f both the public sector and the private sector investments in tobacco industry between 1980 and 1987 (For the values o f investment, see Türel, 1992). Meanwhile efficiency increases have been working to diminish the effects o f input cuts. The years during which input cuts were experienced were almost always followed by inefficient productions. A 29.8 percent decrease in output in tobacco industry between 1979 and 1980 has found its roots in the 47 percent decrease in the input usage. This was followed by a 27.2 percent increase in output which owed itself to the large increase in efficiency between 1980 and 1981. This increase in the efficiency coincided with the highest public sector investment in the tobacco industry during the period 1976-1987 , which was 14.7 billion TL. and that o f private sector investment which was 7.4 billion TL. at 1983 prices (Türel, 1992). The imports in this sector has been increasing from 1988 until 1991. The related values can be observed in Table IV-c. This rise in imports, could be connected to the climbing imports o f the final products which in turn was a result o f the liberalization efforts in trade policies during the first years o f 1980s.
The textile and clothing industries have been the leading ones in the export growth during 1980s and their output growth patterns represented the effects o f the foreign trade liberalization policies after 1980, clearly. Therefore, they will be analyzed in a more detailed manner. During the years o f crisis through the end o f 1970s, the input usage in textile industry has decreased considerably, and these decreases have accounted for the large portion o f the fall in output.
-16-Beginning from the period 1977-1978, both the input used and the output o f the textile industry have declined for three years. The percentage fall in input usage has been 14.6, 21.0 and 24.5; and that o f output has been 8.5, 13.1 and 17.6 for these three years. Table m shows the output growth o f textile industry in relation with the sectoral exports and imports for the years around 1980. For the following ten years, efficiency increases have accompanied the decreased input usage and the result is an overall increase in output. The contraction in the production o f textile industry was replaced by a continues and considerable rise in output through the 1980s. At this stage, the role o f private sector, which has taken its power fi’om 1980 incentives, in realizing new investments and projects, should be mentioned. The most clear indicator o f the improvements in the textile industry was the increases in the exports which are 37.6 percent, 106.2 percent, 41.0 percent, 37.5 percent and 60.8 percent between the years 1979-1980, 1980-1981, 1981-1982, 1982-1983 and 1983-1984 respectively. The percentage growth rates o f exports and imports for the textile industry are available in Table III.
Years Efficiency Increase Technological Progress Inc. Input Usage Output Growth Exports Imports 1977-1978 5.2 0.9 -14.6 -8.5 -7.0 -23.4 1978-1979 6.6 1.3 -21.0 -13.1 -8.7 -31.3 1979-1980 6.9 0.0 -24.5 -17.6 37.6 103.55 1980-1981 9.9 1.7 10.8 22.4 106.2 11.3 1981-1982 13.1 0.0 -4.2 9.0 41.0 41.8 1982-1983 14.0 0.0 -6.4 7.6 37.5 6.44 1983-1984 17.0 0.0 -9.1 7.9 60.8 33.2
Table III; The Output, Export and Import Growth o f Textile Industry in Percentage, 1977-1984. ( For the rest o f the years see Tables IV-a, FV-b and A .l)
Source: Last two columns are calculated from Tables IV-a and IV-b, the rest is taken from Table A .l
By looking at the trends o f investments and increasing net exports, it can be inferred that the economy has been increasingly specializing in textile industry during the 1980s. Although the rising competitiveness fi"om outside the country have not reflected to the technological progress dominantly, small rises were observed between 1980-1981 and 1986-1987 (See Table A .l, sector 321). The exports o f the textile industry could have increased more steeply, however the import barriers o f the western European countries have avoided this acceleration.
The movements in the decomposition o f output o f the clothing industry have behaved almost in the same way as the textile industry, except that the dominant share in the increased output has been the share o f input usage. The changing pattern o f consumption o f the society put pressure on the inputs used to produce clothing. Excluding only the period 1984-1985, both the efficiency and the input usage have functioned to rise the output, although their shares have differed from year to year (See Table A .l, sector 323).
On the textile and clothing industry's export performance during the early 1980s, various factors have been influential including the structure and the available natural inputs. During the
import substitution period, the textile production has utilized specific incentives and the
technological capabilities have accumulated. The cheap labor and the leadership o f Tiurkey in the cotton production in the world have been the two more advantages o f the Turkish industry in international markets. Although the textile and the clothing industries have been heavily protected before the liberalization program, they were more competitive in the international market compared with the other industries. In addition to the mentioned factors, the support o f government export incentives led the domestic firms to open to the world markets. The share o f textile and clothing industry in the total manufacturing industry when the investment incentive certificates are concerned has been rising after 1982 (See Table V). While this share was 7.9 percent in 1982, it was 20.1 percent in 1991, whereas the same figures for the share o f manufacturing industry in total economy, were 41 percent and 62.6 percent respectively. Continuous devaluation o f the exchange rate during 1980s and export credits were among the factors that facilitated export growth. The improvements in export competitiveness and the importance that the Turkish economy has been giving to the textile and clothing industry explains the efficiency gains and the growing output.
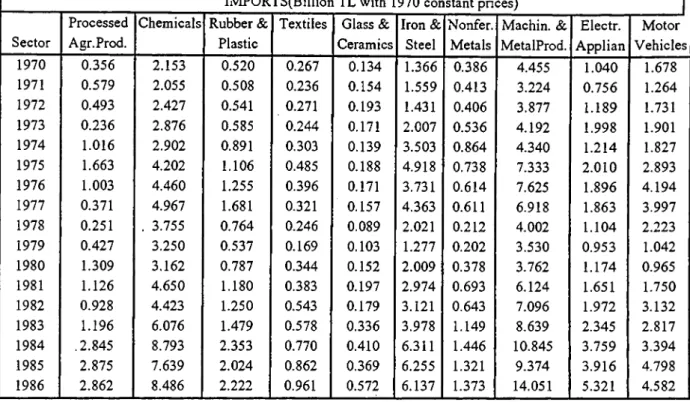
-18-IMPORTS(BilIion TL with 1970 constant prices)
Sector
Processed Agr.Prod.
Chemicals Rubber & Plastic
Textiles Glass & Ceramics Iron & Steel Nonfer. Metals Machin. & MetalProd. Electr. Applian Motor Vehicles 1970 1971 1972 1973 1974 1975 1976 1977 1978 1979 1980 1981 1982 1983 1984 1985 1986 0.356 0.579 0.493 0.236 1.016 1.663 1.003 0.371 0.251 0.427 1.309 1.126 0.928 1.196 .2.845 2.875 2.862 2.153 2.055 2.427 2.876 2.902 4.202 4.460 4.967 . 3.755 3.250 3.162 4.650 4.423 6.076 8.793 7.639 8.486 0.520 0.508 0.541 0.585 0.891 1.106 1.255 1.681 0.764 0.537 0.787 1.180 1.250 1.479 2.353 2.024 2.222 0.267 0.236 0.271 0.244 0.303 0.485 0.396 0.321 0.246 0.169 0.344 0.383 0.543 0.578 0.770 0.862 0.961 0.134 0.154 0.193 0.171 0.139 0.188 0.171 0.157 0.089 0.103 0.152 0.197 0.179 0.336 0.410 0.369 0.572 1.366 1.559 1.431 2.007 3.503 4.918 3.731 4.363 2.021 1.277 2.009 2.974 3.121 3.978 6.311 6.255 6.137 0.386 0.413 0.406 0.536 0.864 0.738 0.614 0.611 0.212 0.202 0.378 0.693 0.643 1.149 1.446 1.321 1.373 4.455 3.224 3.877 4.192 4.340 7.333 7.625 6.918 4.002 3.530 3.762 6.124 7.096 8.639 10.845 9.374 14.051 1.040 0.756 1.189 1.998 1.214 2.010 1.896 1.863 1.104 0.953 1.174 1.651 1.972 2.345 3.759 3.916 5.321 1.678 1.264 1.731 1.901 1.827 2.893 4.194 3.997 2.223 1.042 0.965 1.750 3.132 2.817 3.394 4.798 4.582 Table rV-a : Sectoral Composition of Turkish Imports, 1970-1986
Source : SPO Annual data and SIS, various years
EXPORTS(Billion TL with constant 1970 prices) Sector Processed Agr.Prod. Chemicals Rubber& Plastic Textiles Glass& Ceramics Iron& Steel Nonfer Metals Machin. & MetalProd Electr. Applian Motor Vehicles 1970 0.683 0.149 0.030 0.386 0.015 0.045 0.119 0.030 0.000 0.000 1971 0.709 0.106 0.012 0.461 0.035 0.024 0.047 0.035 0.012 0.012 1972 0.919 0.106 0.010 0.532 0.039 0.068 0.058 0.048 0.010 0.000 1973 1.292 0.114 0.016 0.877 0.057 0.106 0.138 0.073 0.008 0.008 1974 0.963 0.191 0.033 0.983 . 0.086 0.125 0.224 0.106 0.007 0.040 1975 0.933 0.239 0.036 0.918 0.130 0.145 0.094 0.080 0.007 0.058 1976 0.668 0.300 0.020 1.807 0.143 0.150 0.116 0.109 0.007 0.061 1977 0.856 0.208 0.019 1.637 0.170 0.088 0.126 0.088 0.019 0.057 1978 0.542 0.118 0.010 1.523 0.148 0.103 0.059 0.089 0.020 0.030 1979 0.556 0.088 0.011 1.391 0.136 0.114 0.055 0.066 0.018 0.099 1980 0.826 0.331 0.070 1.914 0.157 0.148 0.078 0.130 0.052 0.217 1981 2.025 0.462 0.354 3.947 0.501 0.492 0.147 0.418 0.128 0.541 1982 2.995 0.780 0.322 5.567 0.548 1.909 0.237 0.754 0.395 0.580 1983 3.948 0.707 0.454 7.655 0.636 2.399 0.466 0.719 0.407 0.743 1984 5.303 1.133 0.639 12.306 0.958 3.782 0.561 0.883 0.654 0.885 1985 3.816 1.568 0.637 10.561 1.119 5.718 0.682 2.658 0.702 0.865 1986 3.979 2.090 0.839 11.045 0.942 4.796 0.664 1.569 0.773 0.492
Table IV-b : Sectoral Composition of Turkish Exports, 1970-1986 Source : SPO Annual data and SIS, various years
IMPORTS(BilIion TL with constant 1970 prices) Sectors 313 314 321 322 323 324 331 332 341 342 352 351 1987 0.052 1.038 0.642 0.010 0.428 0.031 0.312 0.017 1.017 0.098 7.685 6.674 1988 0.089 0.991 0.639 0.013 0.292 0.020 0.153 0.021 1.543 0.110 7.863 7.064 1989 0.020 0.997 0.721 0.023 0.313 0.032 0.070 0.009 1.254 0.113 6.198 6.076 1990 0.043 1.311 1.678 0.032 0.476 0.091 0.123 0.047 1.106 0.156 6.180 6.890 1991 0.087 1.599 1.835 0.071 0.499 0.120 0.128 0.064 1.450 0.160 6.876 7.421 Sectors 353 354 355 356 362 369 371 372 381 382 383 384 385 1987 1.359 0.118 0.384 0.190 0.197 0.625 8.172 2.323 1.717 12.852 5.908 4.046 1.787 1988 1.459 0.090 0.371 0.237 0.177 0.714 8.580 2.255 2.336 11.698 0.684 4.914 1.755 1989 1.508 0.072 0.336 0.160 0.134 0.545 9.376 1.830 1.599 8.678 4.848 3.976 1.606 1990 2.146 0.079 0.768 0.347 0.213 0.598 6.831 2.022 1.652 13.245 6.517 6.760 2.407 1991 2.841 0.109 0.832 0.486 0.322 0.570 7.624 1.684 2.471 15.222 8.663 6.759 2.820
Table rV-c : Sectoral Composition of Turkish Imports, 1987-1991 Source : SPO Annual data and SIS, various years
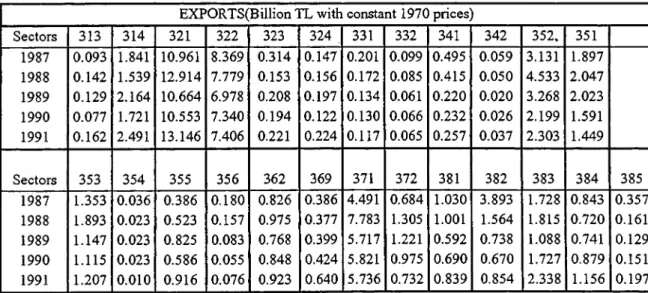
EXPORTS(Billion TL with constant 1970 prices)
Sectors 313 314 321 322 323 324 331 332 341 342 352. 351 1987 0.093 1.841 10.961 8.369 0.314 0.147 0.201 0.099 0.495 0.059 3.131 1.897 1988 0.142 1.539 12.914 7.779 0.153 0.156 0.172 0.085 0.415 0.050 4.533 2.047 1989 0.129 2.164 10.664 6.978 0.208 0.197 0.134 0.061 0.220 0.020 3.268 2.023 1990 0.077 1.721 10.553 7.340 0.194 0.122 0.130 0.066 0.232 0.026 2.199 1.591 1991 0.162 2.491 13.146 7.406 0.221 0.224 0.117 0.065 0.257 0.037 2.303 1.449 Sectors 353 354 355 356 362 369 371 372 381 382 383 384 385 1987 1.353 0.036 0.386 0.180 0.826 0.386 4.491 0.684 1.030 3.893 1.728 0.843 0.357 1988 1.893 0.023 0.523 0.157 0.975 0.377 7.783 1.305 1.001 1.564 1.815 0.720 0.161 1989 1.147 0.023 0.825 0.083 0.768 0.399 5.717 1.221 0.592 0.738 1.088 0.741 0.129 1990 1.115 0.023 0.586 0.055 0.848 0.424 5.821 0.975 0.690 0.670 1.727 0.879 0.151 1991 1.207 0.010 0.916 0.076 0.923 0.640 5.736 0.732 0.839 0.854 2.338 1.156 0.197
Table rV-d : Sectoral Composition of Turkish Exports, 1987-1991 Source : SPO Annual data and SIS, various years
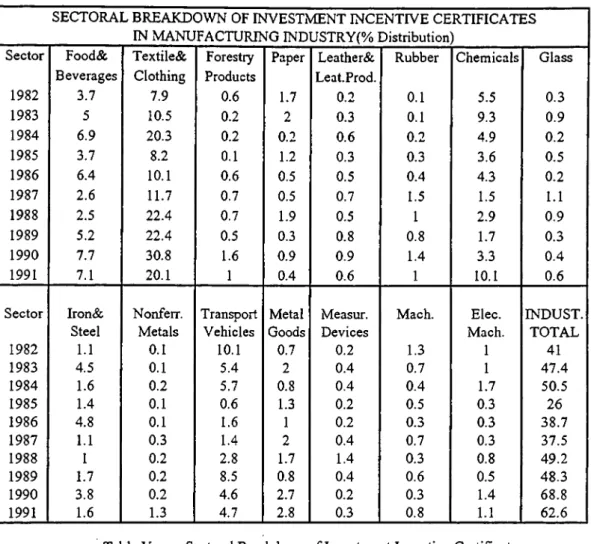
-SECTORAL BREAKDOWN OF INVESTMENT INCENTIVE CERTIFICATES IN MANUFACTURING INDUSTRY(% Distribution)
Sector Food& Textile& Forestry Paper Leather& Rubber Chemicals Glass
Beverages Clothing Products Leat.Prod.
1982 3.7 7.9 0.6 1.7 0.2 0.1 5.5 0.3 1983 5 10.5 0.2 2 0.3 0.1 9.3 0.9 1984 6.9 20.3 0.2 0.2 0.6 0.2 4.9 0.2 1985 3.7 8.2 0.1 1.2 0.3 0.3 3.6 0.5 1986 6.4 10.1 0.6 0.5 0.5 0.4 4.3 0.2 1987 2.6 11.7 0.7 0.5 0.7 1.5 1.5 1.1 1988 2.5 22.4 0.7 1.9 0.5 1 2.9 0.9 1989 5.2 22.4 0.5 0.3 0.8 0.8 1.7 0.3 1990 7.7 30.8 1.6 0.9 0.9 1.4 3.3 0.4 1991 7.1 20.1 1 0.4 0.6 1 10.1 0.6
Sector Iron& Nonferr. Transport Metal Measur. Mach, Elec. INDUST.
Steel Metals Vehicles Goods Devices Mach. TOTAL
1982 1.1 0.1 10.1 0.7 0.2 1.3 1 41 1983 4,5 0.1 5.4 2 0.4 0.7 1 47.4 1984 1.6 0.2 5.7 0.8 0.4 0.4 1.7 50.5 1985 1.4 0.1 0.6 1.3 0.2 0.5 0.3 26 1986 4.8 0.1 1.6 1 0.2 0.3 0.3 38.7 1987 1.1 0.3 1.4 2 0.4 0.7 0.3 37.5 1988 1 0.2 2.8 1.7 1.4 0.3 0.8 49.2 1989 1.7 0.2 8.5 0.8 0.4 0.6 0.5 48.3 1990 3.8 0.2 4.6 2.7 0.2 0.3 1.4 68.8 1991 1.6 1.3 4.7 2.8 0.3 0.8 1.1 62.6
Table V : Sectoral Breakdown of Investment Incentive Certificates In Manufacturing Industry (% Distribution) , 1982-1991 Source : SPO Annual data and SIS, various years
2. Interm ediate goods and consumer durables: The intermediate products that have had a
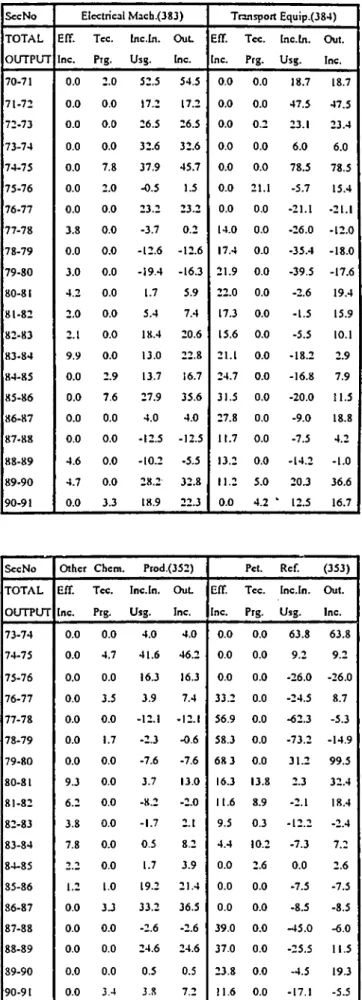
remarkable share in trade, were, paper products, chemicals, iron and steel, non-ferrous metals and glass. Chemicals, non-ferrous metals and paper products could not record considerable technological innovations except for the 15.1 percent increase in output due to technological progress o f the chemicals industry between 1987-1988 and they have been keeping their net importer positions in 1980s. In contrast, iron and steel industry has been reducing its import surplus in relation with its increasing output due to the three o f the components o f the output growth together. The pattern o f output growth o f these sectors, within the group o f intermediates are analyzed first.
The output growth in the paper and paper products industry has been changing a lot for the last two decades. One observed characteristics o f this sector is that, there existed an adverse effect o f the decrease in input usage on the technical efficiency. Among the three determinants o f the output growth, efficiency change has been the most dominant one. It has raised to 23.3 percent between 1979 and 1980 then stayed at such high levels for five years. The net export/output ratio shows that, although the extend has been changing fi'om year to year, Turkey has been keeping its net importer position in this industry. Table II indicates that, while this ratio was -9.7 percent in 1976, it has risen up to -22.4 percent around 1980. Excluding the years 1985 and 1988, the share o f paper products in the total investment incentive certificates has been below 1 percent and going down between 1982 and 1991.
Iron and steel industry has recorded continuous technical progress between 1983 and 1987, whereas the non-ferrous metals industry has not experienced any during 1980s. Generally, their output growth levels have been shaped by the changes in input usage and the accordingly changing efficiencies. In 1976, the net export/output ratio for the iron and steel industry was around -36.9 percent which shows the high import dependency o f this sector. Since the years 1978 and 1979 were affected by the continuing unresolved crisis; the negative effects o f the balance o f payment problems and the non-existence o f the foreign currency reserves, naturally contracted the imports and in turn outputs o f the sectors which were in a net importer position. Imports o f iron and steel industry were amounting to 4363 million TL in 1977 with 1970 constant prices whereas this value has dropped to 2021 million TL in 1978 with 1970 prices, with a 53.7 percent decrease. It further decreased to 1277 million TL in 1979 (See Table IV-a). These decreases have resulted in parallel contractions in output o f iron and steel industry. Between 1977 and 1978, output has descended 13.7 percent and it has continued to descend between 1978-1979 and 1979-1980, 20.2 percent and 2.9 percent respectively. The causes o f these losses in output was the decreases in the input usage. The exports o f iron and steel industry has continued to go up smoothly during 1977-1985. While iron and steel exports were 88 million TL in 1977 with 1970 prices, they were 103 million TL in 1978, 114 million TL in 1979 and 148 million TL in 1980 all in 1970 prices (See Table IV-b). Exports have more than doubled between 1980 and 1981 in which period the increased efficiency has made the output grow 4.7 percent. From then on, until 1991, output has been going up pulling
-the exports up in a similar fashion. Economy has been reducing -the import surplus in iron and steel industry during 1980s in comparison to the 1970s and even increasing the exports o f some products o f this sector. The continuous deceleration in the imports before 1980 has been broken by the newly imposed policies in 1980. While efficiency has begun to its consistent rise in 1980, imports have gone up 48 percent and reached 2974 million TL with 1970 prices in 1981 (See Table IV-a). A very similar trend in the movements o f exports, imports, efficiency and output growdh was observed for the non-ferrous metal industry. Table V shows that iron and steel industry has had a considerable share o f investment incentive certificate in industry total.
Turkey has been a net exporter o f glass and the net export/output ratio o f glass industry has been the highest among the intermediates and the second highest follovang the textile industry among the manufacturing industries. While output has had a routine gro^vth during 1970s, it has begun to contract in 1977. This contraction has continued during the years o f 1980 crisis and 17.7 percent, 14.0 percent and 30.1 percent decreases have been experienced between 1977 and 1980. The sector replied the 1980 measures very quickly and input usage has jum ped during 1980-1981 with an amount o f 81.0 percent. Excluding small disturbances, sectoral output has grown between 1980 and 1991. As a result o f the output rise in 1981, the exports o f glass and ceramics have reached a value o f 501 million TL in 1981 with the 1970 constant prices, more than three fold o f the export value o f the year 1980 (See Table IV-b). The 1980 measures accelerated the improvement in the net export/output ratio reaching almost 25 percent through the end o f 1980s. This growth was realized in spite o f the fall in the percentage share o f investment incentive certificates.
Although, the effects o f the 1980 program on the technological progress o f the manufacturing industries could not satisfy the expectations, considerable increases in the efficiencies were observed for most o f the sectors after 1980. Leather products and shoe industry are two examples for these sectors.
The continuous rise in the output and efficiency o f the leather products (323), and the shoe industries (324), after 1980, could find its expression in the incentives o f the 1980 program. The development o f efficiency in these industries have immediately followed the falls in the input usage, offset and sometimes even exceeded them. The technological progresses for the leather
industry and the shoe industry have been marginal. Only considerable shifts in the technology have been the 5.8 percent increase between 1986 and 1987 and the 7.5 percent increase between 1990 and 1991 for the shoe industry. While the input usage has been decreasing for the shoe industry during 1980s, it has been fluctuating between -35.1 percent and 61.2 percent for the leather industry. The increase in efficiencies in both o f the sectors has accelerated after 1980, since they have utilized the incentives o f January 1980 stabilization program. For the leather products as a whole, for instance, value o f corporate income tax deduction has raised fi'om 0.02 percent o f the economy wide deductions in 1981 to 0.17 percent in 1989 (Krueger and Aktan, 1992).
Forestry products and furniture are within the group o f intermediates. The ISIC code numbers for these sectors are 331 and 332 respectively. These two sectors have had small shares in exports, imports and investment. One point to consider is that there was a six fold increase in the share o f forestry products in the sectoral composition o f the investment incentive certificates within the manufacturing industry between 1985 and 1986. Following this incentive, the almost only considerable jump in technological progress for the forestry products was realized for the period 1986-1987 and it was 12.9 percent. This increase has reflected to the output increase o f 33.9 percent for the forestry products between 1986 and 1987.
The effects o f efficiency increase and the technological progress on the output gro'wth have been very small for the years considered for printing and publishing sector numbered as 342. Tiukish economy has been a net importer when this sector is considered. In spite o f a very smooth increase in imports and smoothly fluctuating exports, it couldn't be said that printing and publishing sector's foreign trade balance was mainly affected by the 1973 crisis and 1980 program. However, there have been striking progresses in technology after 1980. This sector was characterized by the unusual technological innovations during 1979-1980, 1980-1981, 1985-1986 and 1989-1990 (See Table A.1 for the sector number 342). Unlike the other intermediate products, output growth has been shaped by the changes in the technology. In addition, the domestic market has been another factor that put pressure on the input usage through the changes in the domestic demand.
Rubber and plastics are two industries with code numbers 355 and 356 respectively, whose output profiles have mostly been affected by the change in input usage. After the 1973 balance o f