Progress In Electromagnetics Research C, Vol. 43, 29–40, 2013
EXPERIMENTAL CONDITIONS FOR THE EXCITATION OF THIN DISK WHISPERING-GALLERY-MODE
RESONATORS
Vladimir B. Yurchenko1, *, Ayhan Altintas2, Mehmet Ciydem3,
and Sencer Koc4
1O. Ya. Usikov Institute for Radiophysics and Electronics of the
National Academy of Sciences of Ukraine, 12, Proskura St., Kharkiv 61085, Ukraine
2EEE Department, Bilkent University, Ankara 06800, Turkey 3EEE Department, Gazi University, Ankara 06500, Turkey
4EEE Department, Middle East Technical University, Ankara 06531,
Turkey
Abstract—Measurements of mm-wave excitation spectra of high-order whispering gallery modes in free-space cylindrical disk resonators as functions of resonator thickness have been made. Resonators in the form of tight stacks of thin dielectric disks excited via dielectric waveguides have been used in the experiment. Experimental conditions for the excitation of thin-disk resonators have been found. A simple approach for the modeling of resonator spectra and recovery of dielectric parameters has been proposed.
1. INTRODUCTION
Whispering gallery mode (WGM) resonators (dielectric disks, cones, spheres, toroids, and other structures [1, 2]) are known for their exceptional performance as nearly perfect frequency filters, resonators for oscillation sources, dielectric resonator antennas, etc. [3, 4]. They possess record-breaking characteristics in a broad frequency range extending from optics to millimeter waves (e.g., quality factor Q exceeding 850 millions has recently been achieved in optics [5]). Consequently, high-Q resonators provide huge enhancement to other characteristics of devices exploiting the resonance effects, e.g., material
Received 28 June 2013, Accepted 13 August 2013, Scheduled 23 August 2013 * Corresponding author: Vladimir B. Yurchenko ([email protected]).
characterization tools [6–9], biological and chemical sensors [10] (the latter can detect a single nanoparticle [11] or even a single atom [12]), ultralow threshold and super-directional lasers [13, 14], and so on.
Though the best characteristics of WGM resonators are achieved in optics, millimeter (mm) and sub-millimeter (sub-mm) wave devices have also strong potential. One of the new devices in this range is the laminar WGM resonator [15, 16] proposed for making it more sensitive to gaseous or liquid substances surrounding the device and, therefore, facilitating the measurements of dielectric parameters of these substances.
When measuring characteristics of laminar WGM resonators suspended in free space [16], it was found that their quality factors degrade as compared to those of monolithic devices of the same diameter D and total thickness L. Laminar WGM resonators of low thickness were also more difficult to excite so as, at the thickness below a certain critical value Lc, devices were not excited. Provisional measurements of monolithic WGM resonators suspended in free space (more precisely, of a stack of a few cylindrical disks of fused quartz with no air slots between disks) have shown the same tendency, i.e., a stack of small thickness L could not be excited.
The issue of conditions for the excitation of thin disk resonators suspended in free space, to our knowledge, has not been addressed in the literature, though form-factor dependencies of excitation spectra (form-factor is the ratio of disk radius R to thickness L) have been investigated when the excitation occurs [2]. This is, probably, because of difficulty of computing free-space disk spectra when the continuity of tangential fields at all disk surfaces is required and uniform axial modes are not supported [17]. So, it is more common to consider a cylindrical resonator which is either of an infinite length [18] or placed between metallic plates [19] where uniform axial modes can be excited at any thickness (metallic plates simplify simulations but reduce Q factors due to limited conductivity of metal). In other cases, the issue is merely ignored, with all the attention focused on the situations where the excitation takes place.
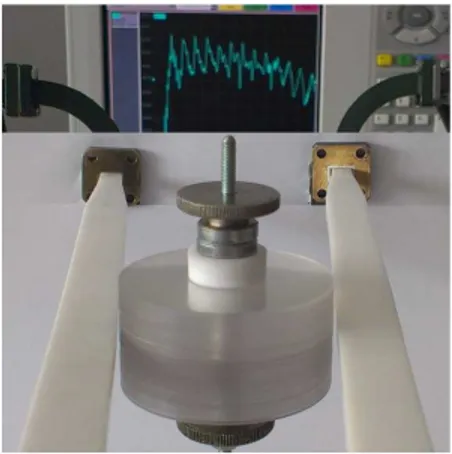
The aim of this work is, therefore, to investigate experimental conditions for the excitation of whispering gallery modes in a thin disk dielectric resonator suspended in free space with no metallic enclosure. 2. EXCITATION OF A PETG STACK RESONATOR Setup for the measurement of excitation spectra of disk resonators is of the kind as explained in [16] and shown in Figure 1. The spectra are measured with vector network analyzer PNA E8361A in the frequency
Progress In Electromagnetics Research C, Vol. 43, 2013 31
Figure 1. Setup for the measurement of S21signal from a
whispering-gallery-mode resonator made as a stack of thin cylindrical disks. band f = 24–40 GHz. The resonator is excited via Teflon dielectric waveguides (DWGs) connected through standard rectangular metallic guides and coaxial cables to the transmitting and receiving ports of the analyzer. The quantity measured by the analyzer is the S21 transmission signal propagated via the disk resonator from one port to another thanks to the evanescent wave coupling between the dielectric disk and DWGs.
Each DWG is made as a rectangular strip of cross-section a × b where the side b is parallel to the disk axis chosen as the z axis of coordinate frame. In all cases, Ez polarization has been used, in the
sense that Ezis the major component of the electric field being excited.
The case of a À b (narrow E-wall) is considered as the basic case of DWG geometry (typically, a = 12 mm, b = 4 mm). Yet, for a more uniform field excitation along the axis of a thick resonator, the case of a ¿ b (wide E-wall) has also been employed (with a = 4 mm and
b = 40 mm at the same Ez polarization, when gradually increasing b
size starting from the metallic waveguides).
Disk resonator has been made as a tight stack of thin circular plastic disks, each of specified thickness t, so as the entire resonator thickness L as verified by direct measurements is close to tN = N t where N is the number of elementary disks. When measured thickness
L at various N is slightly different from expected tN due to uncertainty
of t, a slightly corrected value of t has been used so as to obtain
L = tN = N t in average for all numbers N in the given set of
elementary disks.
with PETG disk resonators (PETG is the polyester plastic available as flat sheets of standard thickness, in our case of t = 0.525 mm). The resonators are assembled of N elementary disks of external diameter
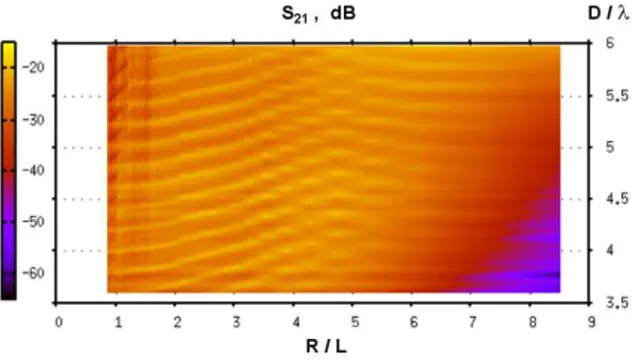
D = 44.8 mm, with N increasing from 1 to 50 (L = tN = 0.525– 26.25 mm). In this case, WGMs of large azimuthal index should be excited in the resonators. All the measured S21 spectral curves are
assembled together and the results are presented as a two-dimensional (2D) plot of S21 as a function of two variables, R/L (the resonator
form-factor) and D/λ (λ is the free-space radiation wavelength), which are conventional variables for this kind of analysis [2] (Figure 2).
Data in Figure 2 contain long sequences of S21signals as functions
of resonator thickness L measured in a wide range of L at small increments. They show that, indeed, the excitation is absent in sufficiently thin disks (at L < Lc) and the critical thickness Lcincreases
with decreasing the frequency.
Figure 2. S21 signal from a PETG stack resonator measured at
different numbers of disks when presented as a 2D plot S21(R/L, D/λ).
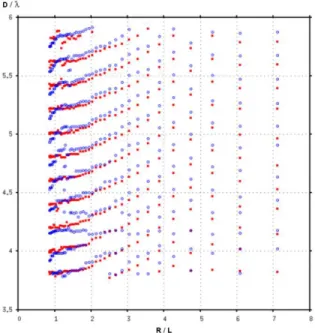
For a more detailed analysis, we identified resonant peaks of
S21(f ) curves at each value of L = tN (N = 1–50) and plotted
them as functions of R/L and D/λ (Figure 3). The results show that, with increasing the form-factor parameter R/L, resonant peaks align along the ascending curves, which indicate the evolution of resonant frequencies fm with decreasing the resonator thickness L (notice,
interpolation software in Figure 2 does not represent correctly the ascending character of fm(R/L, D/λ) curves when the increment of
R/L is getting large at small values of L).
To reveal the conditions for the excitation of a free-space disk resonator, we divide the resonator thickness L by the wavelength in the resonator material λd = λ/n where n = Re(√²) is the refraction
Progress In Electromagnetics Research C, Vol. 43, 2013 33
Figure 3. Form-factor dependence of resonant frequencies of a PETG resonator made of N elementary disks; discrepancy between the narrow (filled squares) and wide (empty circles) E-wall cases is expected to be, mainly, due to the difference in DWGs excitation fields.
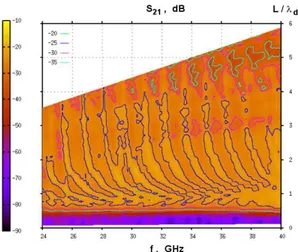
Then, plotting the measured signal S21 as a function of f and L/λd,
we can see that the excitation appears when the resonator thickness is exceeding half of the wavelength in the resonator material, L > 0.5λd
(Figure 4).
The effect is explained by behavior of guided modes in a planar dielectric waveguide [20]. It is known that a thin waveguide (L ¿ λd)
looses its guidance ability, the modes are less confined, and the effective dielectric constant that defines the propagation speed of guided waves, as one can find, reduces to unity. So, a thin-disk material cannot provide total internal reflection for the guided waves, thus, making impossible to support whispering gallery modes. The internal reflection can only arise when the guided waves in a dielectric are well confined, i.e., at L > 0.5λd.
In practice, a clear and well-developed spectrum is observed in the range of thickness λd < L < 3λd. At the greater thickness, the excitation is weaker and the spectrum is contaminated with spurious modes which are hard to control and suppress (e.g., even with wide
Figure 4. S21 signal from a PETG stack resonator presented as a 2D
plot S21(f, L/λd) where λdis the wavelength in the dielectric material.
3. ESTIMATE OF SPECTRUM AND MATERIAL PARAMETERS
Correct normalization of disk thickness requires the knowledge of dielectric constant ². The latter can be found from the same set of data being measured. Once precise computing of spectrum is complicated [17], we can use an approximate approach assuming the axial dependence of the field to be of the kind Ez∼exp(ikzz) where kz = π/L (tangential field components are the same both inside and
outside the disk). Using a well-known dispersion equation Dm(f, kz) =
0 for the m-th order azimuthal mode in an infinite cylinder with non-uniform axial field specified above [2, 18], we can define the functions
Pm(f, L) = 20 lg(1/Dm(f, kz)) [dB] (1) and P (f, L) = 20 lg à M X m=0 1/Dm(f, kz) ! [dB] (2)
which represent, approximately, the response of a disk resonator to the external excitation when either one (m-th) or all azimuthal modes (m = 0, . . . , M , M → ∞) are excited, respectively. Then, peaks of
P (f, L) identify the spectrum of resonator as defined by transmission
signal S21(f, L) at each value of L.
The approach is explained as follows. Assuming the mode m is excited, a representative field component Um (e.g., in the frequency
Progress In Electromagnetics Research C, Vol. 43, 2013 35
domain) is defined by generic equation LmUm = Fm where Lm is the linear operator acting on the field and Fmis the excitation force. Then, the field Um is defined via the Green’s function Gm as Um = GmFm
where Gm has a typical form Gm = Nm/Dm. Here, denominator Dm
is the function whose zeros (the poles of Gm) define the excitation
spectrum, corresponding to the dispersion equation Dm = 0 specified
above. Though details of excitation curves depend on Nm and Fm
as well, resonant frequencies and even the curve shapes near the resonances are defined, mainly, by the denominator Dm(yet, we adjust
reference level of P and introduce a slight slope to P (f ) curves so as to account for exponential weakening of evanescent wave coupling with increasing the frequency).
Thus, the function P (f, L) as given by Eq. (2) should be able to represent basic features of excitation spectrum including the values and parametric dependencies of resonant frequencies fm(L). Essential
requirement is only to have a sufficient thickness of the resonator so as the dispersion equation Dm = 0 would be a good approximation (the condition λd< L < 3λd mentioned above appears to be sufficient).
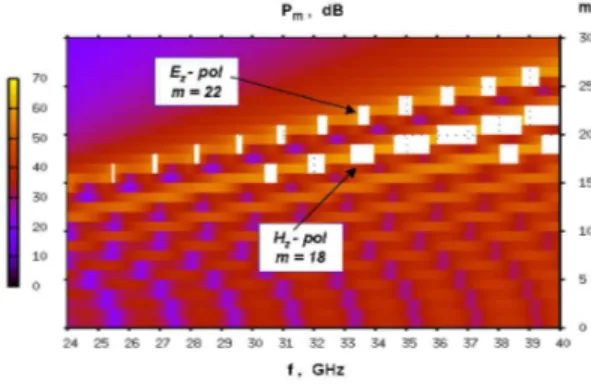
The ideas expressed above are illustrated by the results presented in Figures 5 and 6. Figure 5 shows the contributions of different modes to the total signal as defined by Eq. (1). It provides a useful insight into effects such as coincidence of resonant frequencies of some Ez and Hz modes, e.g., m = 22 (Ez) and m = 18 (Hz) at f = 33.5 GHz. This
could smear the peaks and reduce quality factors if both the modes are excited but resonant frequencies are slightly different.
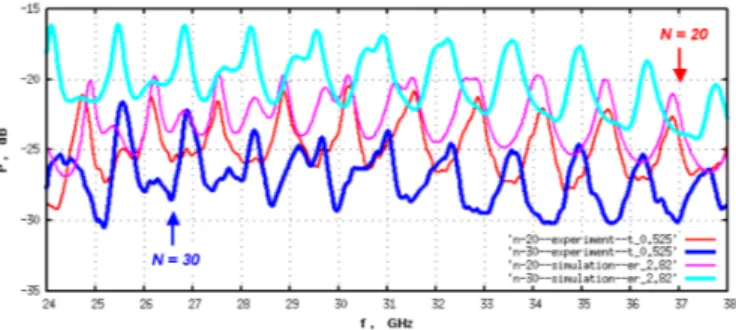
Figure 6 shows the spectral curves measured and simulated for the resonators of N = 20 and 30 disks (L = 10.50 mm and 15.75 mm,
Figure 5. Azimuthal mode contributions Pm(f, L) to the total signal
from a PETG resonator assembled of N = 30 disks (kz = π/L); white
Figure 6. Spectral signal from a PETG resonator at N = 20 (thin curves) and N = 30 (bold curves) elementary disks, experiment versus simulation (two lower and two upper curves, respectively).
respectively). The simulations assume the dielectric constant ² = 2.82 and the loss tangent tan δ = 0.01 that yields the best fitting of shapes of measured and simulated curves (the mean level is irrelevant) through the whole frequency band at all values of L considered (L/λd varies
from minimum 1.47 to maximum 3.53 in this domain).
Notice, the loss tangent here is just the upper bound (because overcoupling has been used in the experiment), whereas the dielectric constant is quite precise (its minor variation alters the curves in either one or another part of the frequency band). The numbers correlate with known values, though exact comparison is not available since the parameters are, usually, much too sensitive to plastic technology, chemical composition, measurement method and frequency band, and may differ significantly for different samples and suppliers.
4. EXCITATION OF PP AND PAM RESONATORS
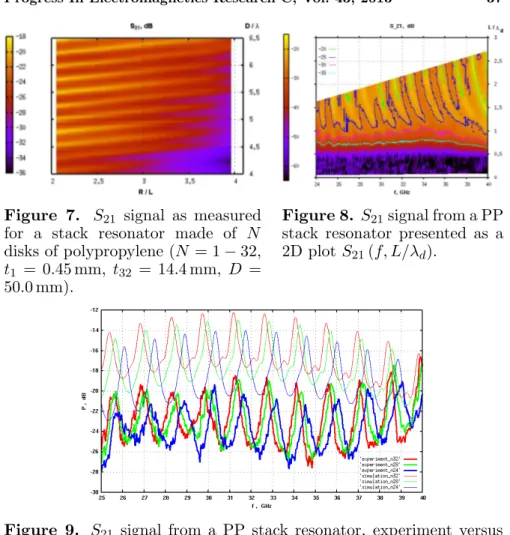
Measurements and simulations described above have also been made for resonators assembled of thin disks of polypropylene (PP), Figures 7–9, and for a cylindrical resonator cut of a single block of polyamide (PAM), Figure 10.
Figures 7 and 8 show the plots similar to those in Figures 2 and 4. They confirm the excitation of PP resonators appears at the same generic condition L > 0.5λd. The dielectric constant of PP disks is
found to be ² = 2.00 and tan δ = 0.01.
Figure 9 shows the comparison of measured and simulated curves at different numbers of disks (N = 24, 28, 32). The plot illustrates the consistency of fitting at the given parameters through all the frequency and thickness domain. For this, though, the effective thickness t has to be chosen as t = 0.48 mm that differs slightly from the measured
Progress In Electromagnetics Research C, Vol. 43, 2013 37
Figure 7. S21 signal as measured
for a stack resonator made of N disks of polypropylene (N = 1 − 32,
t1 = 0.45 mm, t32 = 14.4 mm, D =
50.0 mm).
Figure 8. S21signal from a PP
stack resonator presented as a 2D plot S21(f, L/λd).
Figure 9. S21 signal from a PP stack resonator, experiment versus
simulation (N = 24, 28, 32).
value t = 0.45 mm (otherwise, the fitting is less consistent through the entire domain). The correction, probably, accounts for the fact that PP disks have slightly rough surfaces and minor slots may exist between the disks in the stack assembly.
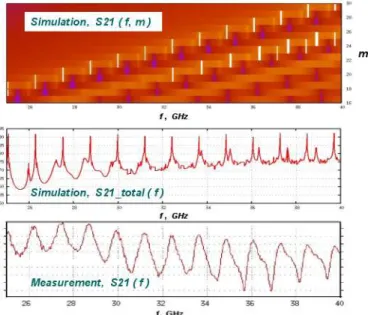
Figure 10 shows a sequence of plots of (a) simulated contributions of different modes, (b) simulated total signal, and (c) measured signal of the PAM resonator. Here, for obtaining correct resonant peaks in simulations, we had to reduce the signal from the modes of orthogonal polarization (Hz) which, ideally, should not be excited
(unlike the previous cases, this time they are hardly excited, indeed, yet the dispersion function Dm(f, kz) should account for them as well).
Dielectric parameters of PAM as obtained in these simulations are
Figure 10. S21 signal from a PAM disk resonator (D = 50.2 mm,
L = 27.2 mm), (a) simulated modal contributions, (b) simulated total
signal, and (c) measured signal. 5. CONCLUSIONS
We carried out measurements of mm-wave excitation spectra of high-order whispering gallery modes in free-space cylindrical disk resonators as functions of resonator thickness L by using the resonators in the form of tight stacks of thin dielectric disks. We found experimental conditions for the excitation of thin-disk resonators and proposed a simple approach for the modeling of their spectra and recovery of material dielectric parameters.
The excitation of Ez polarized WGM modes in a disk resonator
(z is the disk axis) occurs when the disk thickness exceeds the half wavelength in the dielectric material, L > 0.5λd. Optimal conditions
for the observation of clear spectra with no spurious modes are found to be 1 < L/λd < 3. When L > 3λd, the spectra become unstable
and contaminated with spurious modes. Narrow E-wall dielectric waveguides are preferable for the excitation of clear spectra.
Simulations based on the circular cylinder dispersion equation with an axial propagation constant chosen as kz = π/L provide a good estimate for the excitation spectra of disk resonators whose thickness is not too small (the optimum appears to be 1 < L/λd< 3).
Progress In Electromagnetics Research C, Vol. 43, 2013 39
ACKNOWLEDGMENT
The work was, partially, supported by the National Academy of Sciences of Ukraine through the research project “Centaur-5”.
REFERENCES
1. Practical Applications of Microresonators in Optics and
Photon-ics, A. B. Matsko, Ed., CRC Press, New York, 2010.
2. Kirichenko, A. Y., Y. V. Prokopenko, Y. F. Filippov, and N. T. Cherpak, Quasi Optical Solid State Resonators, Naukova Dumka, Kiev, 2008 (in Russian).
3. Dormidontov, A. V., A. Y. Kirichenko, Y. F. Lonin, A. G. Pono-marev, Y. V. Prokopenko, G. V. Sotnikov, V. T. Uvarov, and Y. F. Filippov, “Auto-oscillatory system based on dielectric res-onator with whispering-gallery modes,” Tech. Phys. Lett., Vol. 38, No. 1, 85–88, 2012.
4. Ouyang, X. and B.-Y. Wang, “Inline TE01δ mode
dielectric-resonator filters with controllable transmission zero for wireless base stations,” Progress In Electromagnetics Research Letters, Vol. 38, 101–110, 2013.
5. Lee, H., T. Chen, J. Li, K. Y. Yang, S. Jeon, O. Painter, and K. J. Vahala, “Chemically etched ultrahigh-Q wedge-resonator on a silicon chip,” Nature Photonics, Vol. 6, 369–373, 2012.
6. Kheir, M. S., H. F. Hammad, and A. Omar, “Broadband material characterization using traveling-wave whispering-gallery-mode dielectric resonators,” Progress In Electromagnetics Research B, Vol. 43, 35–52, 2012.
7. Paez, E., M. A. Azpurua, C. Tremola, and R. C. Callarotti, “Uncertainty estimation in complex permittivity measurements by shielded dielectric resonator technique using the Monte Carlo method,” Progress In Electromagnetics Research B, Vol. 41, 101– 119, 2012.
8. Yurchenko, V. B., “High-Q reflection notch method for mm-wave measurements of large dielectric losses using a stack resonator: Analysis and simulations,” Progress In Electromagnetics Research
M, Vol. 24, 265–279, 2012.
9. Shaforost, E. N., A. A. Barannik, N. Klein, S. A. Vitusevich, and A. Offenhaeusser, “Nanolitre liquid characterization by open whispering-gallery mode dielectric resonators at millimeter wave frequencies,” Journal of Applied Physics, Vol. 104, 074111, 2008.
10. Taeb, A., M. Neshat, S. Gigoyan, and S. Safavi-Naeini, “A low-cost millimeter-wave whispering gallery-mode-based sensor: Design considerations and accurate analysis,” International
Journal of Microwave and Wireless Technologies, Vol. 4, No. 3,
341–348, 2012.
11. Shen, Y. and J.-T. Shen, “Nanoparticle sensing using whispering-gallery-mode resonators: Plasmonic and Rayleigh scatterers,”
Phys. Rev. A, Vol. 85, 013801, 2012.
12. Rosenblit, M., P. Horak, S. Helsby, and R. Folman, “Single-atom detection using whispering gallery modes of microdisk resonators,”
Phys. Rev. A, Vol. 70, 053808, 2004.
13. Nozaki, K., A. Nakagawa, D. Sano, and T. Baba, “Ultralow threshold and single-mode lasing in microgear lasers and its fusion with quasi-periodic photonic crystals,” IEEE Journ. Selected
Topics Quant. Electron., Vol. 9, No. 5, 1355–1360, 2003.
14. Wanga, Q. J., C. Yan, N. Yu, J. Unterhinninghofen, J. Wiersig, C. Pfeugl, L. Diehl, T. Edamura, M. Yamanishi, H. Kan, and F. Capasso, “Whispering-gallery mode resonators for highly unidirectional laser action,” PNAS, Vol. 107, No. 52, 22407–22412, 2010.
15. Dobromyslov, V. S. and A. E. Bereza, “Features of intrinsic oscillations of laminar dielectric resonators,” Inter-University
Topical Collection, No. 48, 38–44, 1984.
16. Kirichenko, A. Y., G. V. Golubnichaya, I. G. Maximchuk, and V. B. Yurchenko, “Q-factor and excitation efficiency of laminar quasioptical dielectric resonators,” Radiophysics and Electronics, Vol. 4(18), No. 2, 91–95, 2013 (in Russian).
17. Tsuji, M., H. Shigesawa, and K. Takiyama, “Analytical and experimental investigations on several resonant modes in open dielectric resonators,” IEEE Trans. Microwave Theory Techn., Vol. 32, 628–633, 1984.
18. Annino, G., M. Cassettari, I. Longo, and M. Martinelli, “Whis-pering gallery modes in a dielectric resonator: Characterization at millimeter wavelength,” IEEE Trans. Microwave Theory Techn., Vol. 45, 2025–2034, 1997.
19. Akay, M. F., Y. Prokopenko, and S. Kharkovsky, “Resonance characteristics of whispering gallery modes in parallel-plates-type cylindrical dielectric resonators,” Microwave Opt. Techn. Lett., Vol. 40, 96–101, 2004.
20. Syms, R. R. A. and J. R. Cozens, Optical Guided Waves and