https://doi.org/10.1007/s12041-019-1129-7
REVIEW ARTICLE
Construction, characteristics and high throughput molecular screening
methodologies in some special breeding populations: a horticultural
perspective
HASAN CAN1∗ , UNAL KAL2, IBRAHIM ILKER OZYIGIT3,4, MUSTAFA PAKSOY1,5
and ONDER TURKMEN5∗
1Faculty of Agriculture, Department of Field Crops and Horticulture, Kyrgyz-Turkish Manas University, Bishkek 720038, Kyrgyzstan
2Applied Science School of Kadirli, Department of Organic Farming Management, Osmaniye Korkut Ata University, Osmaniye 80000, Turkey
3Faculty of Science and Arts, Department of Biology, Marmara University, Goztepe 34722, Istanbul, Turkey 4Faculty of Science, Department of Biology, Kyrgyz-Turkish Manas University, Bishkek 720038, Kyrgyzstan 5Faculty of Agriculture, Department of Horticulture, Selcuk University, Konya 42130, Turkey
*For correspondence. E-mail: Hasan Can, [email protected]; Onder Turkmen, [email protected]. Received 23 February 2019; revised 23 April 2019; accepted 13 May 2019; published online 28 August 2019
Abstract.
Advanced marker technologies are widely used for evaluation of genetic diversity in cultivated crops, wild ancestors, landraces or any special plant genotypes. Developing agricultural cultivars requires the following steps: (i) determining desired characteristics to be improved, (ii) screening genetic resources to help find a superior cultivar, (iii) intercrossing selected individuals, (iv) generating genetically hybrid populations and screening them for agro-morphological or molecular traits, (v) evaluating the superior cultivar candidates, (vi) testing field performance at different locations, and (vii) certifying. In the cultivar development process valuable genes can be identified by creating special biparental or multiparental populations and analysing their association using suitable markers in given populations. These special populations and advanced marker technologies give us a deeper knowledge about the inherited agronomic characteristics. Unaffected by the changing environmental conditions, these provide a higher understanding of genome dynamics in plants. The last decade witnessed new applications for advanced molecular techniques in the area of breeding, with low costs per sample. These, especially, include next-generation sequencing technologies like reduced representation genome sequencing (genotyping by sequencing, restriction site-associated DNA). These enabled researchers to develop new markers, such as simple sequence repeat and single- nucleotide polymorphism, for expanding the qualitative and quantitative information on population dynamics. Thus, the knowledge acquired from novel technologies is a valuable asset for the breeding process and to better understand the population dynamics, their properties, and analysis methods.Keywords. population; backcross; double haploid; recombinant inbred line; near-isogenic line; nested association mapping; multiparent advanced generation intercross.
History of breeding
Since the transition from hunter-gatherer primitive human communities to settled lifestyle, mankind has made immence efforts in cultivating a wide range of plant species, giving rise to agriculture (Gepts 2014;Milla et al. 2015;
Abbo and Gopher 2017). Researchers estimated that this trend in cultivation started in the late Paleolithic age, nearly 10,000 years ago; it was concentrated in four different
locations in the middle latitudes of the world. The major origins of the Neolithic agriculture were near Eastern cen-tre, Central American cencen-tre, Chinese centre and New Guinean centre (Mazoyer and Roudart 2006). These centres were further extended with two or three sec-ondary diversification centres. According to one theory, the hunter-gatherer communities were divided into sub-populations and found marginal places (Neolithic agricul-ture centres) to live in Pleistocene age (Flannery 1969). To
meet the basic necessities for their survival, these subpop-ulations enlarged their dietary resources with deliberately selected, protected, germinated and planted weed types in addition to their original hunter diet. Morgan(2015) termed this deliberate usage of plants as ‘intensification’ (Morgan 2015). Therefore, with these initiatives, early applications of domestication process have begun long time ago. Natural and artificial selections (especially long-term artificial selection) were two indispensable forces for domestication (Gregory 2009;Flint-Garcia 2013). These led to permanent heritable genetic alterations via gene recombinations, transposable elements, shifts, mutations, and polyploidization (Soltis and Soltis 1999;Doebley et al. 2006;Pathirana 2011;Belyayev 2014;Sidhu et al. 2017). As a result of fixed genetic differences throughout genera-tions, newly formed alleles spread to the weed populations in some of those marginal places. Further, long-term culti-vation of weeds with the new alleles increased the desirable allele frequency and gradually differentiated in genetic, morphological, and physiological properties. Hence, the domestication process by the early farmers shaped the modern cultivars that emerged from the ancestral popu-lations (Gepts and Harlan 2012;Turcotte et al. 2017).
Breeding is an important process for the domestication of plants. Plant breeding is a manipulation method for generating highly heritable variations among populations and selecting the desirable ones beneficial for humanity. The breeding activity can also be defined as an accelerated way of domestication. This also indicates that the origin of breeding is as old as domestication.
Breeders, who professionally manage breeding activi-ties, determine the ultimate direction of the programme and design the details to be implemented. The direction of a breeding programme depends on many factors, such as productivity, nutritional value, disease and environmental stress resistance, adaptation to agricultural lands and/or climatic conditions, agricultural mechanization and food processing (Dwivedi et al. 2016;Li et al. 2018b). Among these, productivity could be increased by introducing new genes to resist pathogens and to increase tolerance to envi-ronmental stress, screening and bringing major polygenic traits into new cultivars, and using effective biofertilizers, conventional fertilizers and irrigation systems (Ashikari and Matsuoka 2006;Wahid et al. 2007;Balconi et al. 2012;
Nadeem et al. 2013). The nutritional value of a plant is directly correlated to its protein composition, amino acid content, macronutrient and micronutrient composition, fibre content, and increased oil and sugar content; addi-tionally, it is inversely correlated to the toxic components (Hayat et al. 2014;Strobbe et al. 2018).
The key factor for improvement of any given char-acteristic is the variation among individual genotypes or populations. Breeding programmes, effecting these improvements, are built on three main foundations: vari-ation, heritability and selection. Genetic variation within a population or its diversity index is measured by fixation
index (FST), widely estimated using simple sequence repeat (SSR) and single- nucleotide polymorphism (SNP) mark-ers. Other equivalents of FSTare (i) QST, metric measure-ment units of genetic differentiation used for analysing quantitative traits, (ii) GST, multiallelic version of FST, (iii) Nei’s D, genetic distance, (iv) Jost’s D, and (v) sequence divergence (Nei 1973; Hedrick 2005, 2011; Jost 2008;
Whitlock and Guillaume 2009;Ma et al. 2015;Filiz et al. 2018). DNA sequence divergence or variations are not always morphologically and physiologically observable. In any case, base-pair differences create variations within individuals. Various agricultural traits, e.g. yield, are poly-genic and quantitative in nature. Distinct genes on the same or different chromosomes and their interactions under different environmental conditions are responsible for such traits (Nadeem et al. 2018; Saba Rahim et al. 2018). Demographic, genetic, or environmental factors could be the reason for the variability in quantitative traits (Heino 2014).
From early farmers to modern breeders, the agro-morphological traits selected in edible crops include higher yield, larger fruit and seed size, uniform germination and ripening of seeds and fruits, annual nature of crop, and enhanced taste and fragrance (Taiz 2013). Phenotypic selection of these traits in every generation allows desir-able and uniform production, at the cost of reduced genetic variation (Nogue et al. 2016). Thus, continuously choosing an allele results in some undesirable consequences. Gene frequencies in a population change dynamically under the pressure of natural selection. Natural selection along with artificial selection sometimes could result in a genetic bottleneck in breeding by the accumulation of specific genes among the cultivated forms (Wright 2005). On one hand, uniformity of genes is a desired property; on the other hand, induced uniformity at the hands of breed-ers is dangerous in many ways, particularly for large-scale production. According tovan de Wouw et al.(2010), the replacement of landraces with modern cultivars led to a gradual loss of variations in crops. Finally, the loss of vari-ation due to the introduction of uniformity makes large cultivation areas susceptible to the new emerging epidemic threats. Such epidemics were previously recorded in some locations of the world.
Subsequent to ancient practices, the earliest efforts for breeding were observed in the 18th century. The detail elucidation of sexual reproduction system in plants led to the initiation of modern-day breeding. The first report of sexual reproduction in plants was recorded by Ceam-erarius (1694). Sexual reproduction—selfing, crossing, incompatibility or sterility—have been one of the most significant features in determining breeding methodol-ogy. Thomas Fairchild performed the first hybrid cross, a cross between two distinct species (Qaim 2016). Major milestones in plant improvement emerged over time that included the pedigree method of breeding, first scien-tific hybrid, hybridization by Mendel, pure-line theory of
selection, the law of equilibrium of populations, devel-opment of inbreeds to produce hybrids, bulk-breeding selection method, recurrent selection method, and finally the development of genetically modified organisms. The emergence of new methods had a cumulative effect on plant improvement and triggered many reactions toward agricultural speciation.
Importance of breeding
Today, there are 7.53 billion people in this world, and is estimated that they may reach 9.7 billion by 2050. Accord-ing to the Food and Agriculture Organization (FAO) of the UN, 815 million people (about 11% of the global popula-tion) will suffer from undernourishment, where individuals would lack enough calories, proteins or micronutrients. Both, population and production growth rates are increas-ing, but the production rate is far slower than that of the population. According to the FAO statistics, food pro-duction rate must be increased by at least 70% to supply enough nutrients for humanity (FAO 2017).
In the coming decades, mankind will have to face major, inevitable food crisis. Due to population growth as well as fragile climatic and environmental factors, a new green rev-olution is of vital importance to meet global food demands. Until now, cereals have been the most important part of the human diet. In addition, the consumption of vegetables is expected to increase significantly in the next decade due to their indispensable role in the human diet (Slavin and Lloyd 2012). Vegetable-based diets have proven to increase the quality of life and prevent many diseases, owing to the rich nutritional values in the form of dietary fibres, pro-teins, vitamin, antioxidants, and minerals. In 2013, over one billion tons of food was produced in a harvested area of 58.1 million hectares (FAO 2017). From the point of land usage, vegetable production has almost reached its upper limits. Inevitably, this has led the breeders to develop new, more resistant (to diseases and pests) and tolerant (to abi-otic stress factors) varieties to increase yield per unit area. The screening of plant offspring with markers, guides the breeders to select the desirable traits, thus accelerat-ing the process. Since selection is the simplest, longest and most continuous activity of plant improvement, the early selection of desirable offspring among created populations speeds up the releasing new cultivars (Hallauer 2011). Con-sidering the above reasons, incorporating genomic tools with conventional breeding will accelerate the develop-ment of varieties with higher yields, richer nutritional values, and wider adaptation capabilities.Eathington et al.
(2007) reviewed this evidence of acceleration.
The effectiveness of breeding may be increased many folds by using molecular marker technologies in vegetable crops. This means that the genomic tools integrated into the selection of progeny increase and accelerate the breed-ing programmes, which conventionally depended on the
labour-intensive and time-consuming selection process. Next-generation sequence (NGS) analysis applied to plant science provides an abundance of information at low cost, as well as generates quick, accurate and reliable results. Hence, the breeders use it extensively in population screen-ing studies. Particularly, marker-assisted selection (MAS) and quantitative trait loci (QTL) analysis were employed in screening to develop superior cultivars from individuals in a population (Varshney et al. 2014;Torkamaneh et al. 2018). In this case, the positions of QTL must be exactly known to minimize the number of recombinations between the QTL and markers used for selection. Phenotypic vari-ations arising from QTLs must be well documented to eliminate any negative impacts that may lead to false positive results. Thus, cross-validation is required for the detected QTLs. For this, each population should be divided into two subsets: an estimation subset and an independent validation subset. To achieve precise selection, researchers employ whole genome sequencing (WGS), resequencing (RS) and NGS-based reduced representation sequencing. These high-throughput analyses produce endless data for discovering new SNP, SSR, cleaved amplified polymorphic sequence (CAPS) and other markers, detecting new major and minor QTLs, understanding genetic variations among individuals, and associating traits and DNA sequence with high accuracy (Barabaschi et al. 2016; Gramazio et al. 2018).
This review aims to meet the following objectives: (i) pro-vide a detailed insight on creating breeding populations, (ii) explain properties of these populations, (iii) intro-duce newly developed breeding populations and (iv) to build a bridge between these populations and the appro-priate high-throughput molecular screening methods. For this, the populations are discussed according to their con-tribution rates from parental lines as being biparental population (derived from two parental lines) and multi-parental population (derived from multiple multi-parental lines).
Biparental crossing populations
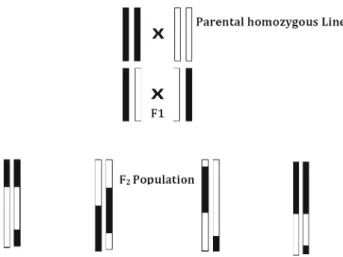
F2populationsAn F2 population depends on the crosses between two selected parents. F2progenies are the most preferred pop-ulations for a variety of studies because they can be easily produced and screened at molecular and morphological levels. Most of the derived special populations depend on the production of F1–F2hybrid genotypes. F2 proge-nies emerge as a reflection of Mendel’s laws (Kumar et al. 2018). The F2populations are ideal for basic and advanced studies, as they allow applying all three marker systems (restriction, PCR, and sequence-based), and also certain morphological markers owing to their distinct genetic background.
Figure 1. Schematic representation of an F2 population. Parental homozygous lines are represented as diploid 2 chro-mosomes with black and white colours. F1, first cross between parental homozygous lines; F2, selfed of each F1 individuals, modified fromZhang(2012).
Certain criteria need to be met when creating an F2 population. In general, parental genotypes should be pure and express different phenotypes. If they are not pure, F1 progeny will not be uniform as expected. According to Mendelian inheritance, 100% of the F1population must have the same phenotype. Thus, the purity level of parental lines is very important for creating the F2 population (Baret et al. 1998). Production of doubled haploids is an alternative way to produce pure lines. It eliminates any chance of heterozygous genotype in the parental lines. In addition to pure genotypes, phenotypes of the parental lines should be different from one another (Muylle et al. 2005; Anhalt et al. 2008). In this way, the genetic and morphological polymorphisms between individuals can be identified and be associated correctly with specific charac-teristics. Although genetic and morphological diversities in parental lines can increase polymorphism rate, high levels of differences—arising from close relatives or interspecies crosses—sometimes cause fertility barriers in offspring. In conclusion, the derived F2 population includes the largest diversity and gene combinations of the following generations (figure 1) (Feldman and Levy 2005). There-fore, codominant markers generate maximum information about this population.
Intentional selfing or backcrossing or a combination of both could be applied to the next generations for seg-regating any desired trait. The number of individuals in an F2 population may vary from 50 to 1000 (Ferreira
et al. 2006). Ideally, 100–300 F2 progenies are sufficient to associate morphological traits with screened genetic markers and to detect QTLs (Mackay 2001; Zhang and Xu 2004). An F2population is also widely used to create other populations (Zhu et al. 2007). The reliability and resolution of the constructed genetic maps are directly
proportional to the population size. Populations used in genetic studies are classified at two levels: temporary struc-ture and permanent strucstruc-ture. The main disadvantage of the F2population is that it becomes unstable or unsustain-able structure (Schneider 2005).
As seen in table 1, F2 populations are mainly used for detecting QTLs, screening for resistant genes, con-structing linkage maps and screening for special char-acteristics for different purposes. Populations that are suitable for all marker systems—codominant (e.g. SSR), dominant (e.g. ISSR, RAPD) and sequence-based (e.g. SNP) markers—for detection and genotyping enable the researchers to implement high-throughput methodologies (e.g. KASP genotyping, InDel, RNA-seq, WGS/R whole genome sequencing, whole genome resequencing, QTL-sequencing) on vegetables (Pradhan et al. 2018;Han et al. 2019;Jat et al. 2019). For instance, average SNP detection per study produces thousands of data points for map-ping or converting previously detected SNP markers to dCAPS. SNP markers are detected in two different ways: (i) whole genome resequencing, used for detection in plants with small genome structures and (ii) reduced libraries, used for detection in highly repetitive or polyploidy and complex plants (Deschamps et al. 2012). For SNP call-ing, a reference genome can be used to align sequence data.
Backcross populations
A backcross population is derived from traditional breed-ing techniques and allows researchers to detect specific fragments of DNA (single dominant/recessive allele or sev-eral alleles) from a desirable parental line (Peng et al. 2014;
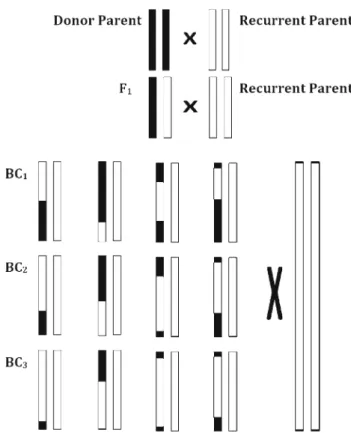
De Beukelaer et al. 2015). The two parental lines, donor parents with desirable alleles and recurrent parents with more cultivation properties can generate a backcross pop-ulation. It is derived from F1 and F2 generations, and advanced by repeatedly crossing with a recurrent parent (figure2). The choice of recurrent parents depends on the alleles that carry certain characteristics. These alleles can be found either in wild relatives, as in the case of wild tomatoes (Celik et al. 2017), or in different populations of the same species (Kumar et al. 2014). Backcrossing achieves two main purposes: (i) decreasing undesirable traits of the donor DNA without losing the desirable traits, and (ii) reducing the observed number of individ-uals in a backcross population (Schneider 2005). Each backcross generation results in decrease in the percent-age of donor genome at the rate of 1−(1/2)t+1, where t is the number of generations (Babu et al. 2004). The recovery rate of the created population reaches 99.2% at the end of six generations of continuous backcross activi-ties.
Backcrosses are mostly applied to the populations as MAS or marker-assisted breeding. MAS is composed
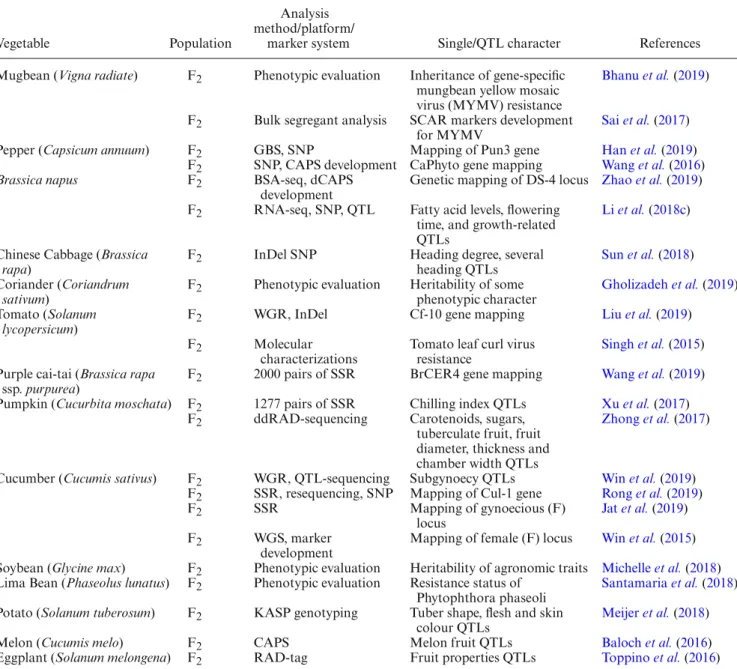
Table 1. F2population studies from some vegetables and their analysis methods.
Vegetable Population
Analysis method/platform/
marker system Single/QTL character References Mugbean (Vigna radiate) F2 Phenotypic evaluation Inheritance of gene-specific
mungbean yellow mosaic virus (MYMV) resistance
Bhanu et al.(2019)
F2 Bulk segregant analysis SCAR markers development for MYMV
Sai et al.(2017) Pepper (Capsicum annuum) F2 GBS, SNP Mapping of Pun3 gene Han et al.(2019)
F2 SNP, CAPS development CaPhyto gene mapping Wang et al.(2016)
Brassica napus F2 BSA-seq, dCAPS
development
Genetic mapping of DS-4 locus Zhao et al.(2019) F2 RNA-seq, SNP, QTL Fatty acid levels, flowering
time, and growth-related QTLs
Li et al.(2018c)
Chinese Cabbage (Brassica
rapa)
F2 InDel SNP Heading degree, several heading QTLs
Sun et al.(2018) Coriander (Coriandrum
sativum)
F2 Phenotypic evaluation Heritability of some phenotypic character
Gholizadeh et al.(2019) Tomato (Solanum
lycopersicum)
F2 WGR, InDel Cf-10 gene mapping Liu et al.(2019) F2 Molecular
characterizations
Tomato leaf curl virus resistance
Singh et al.(2015) Purple cai-tai (Brassica rapa
ssp. purpurea)
F2 2000 pairs of SSR BrCER4 gene mapping Wang et al.(2019) Pumpkin (Cucurbita moschata) F2 1277 pairs of SSR Chilling index QTLs Xu et al.(2017)
F2 ddRAD-sequencing Carotenoids, sugars, tuberculate fruit, fruit diameter, thickness and chamber width QTLs
Zhong et al.(2017)
Cucumber (Cucumis sativus) F2 WGR, QTL-sequencing Subgynoecy QTLs Win et al.(2019) F2 SSR, resequencing, SNP Mapping of Cul-1 gene Rong et al.(2019)
F2 SSR Mapping of gynoecious (F)
locus
Jat et al.(2019) F2 WGS, marker
development
Mapping of female (F) locus Win et al.(2015) Soybean (Glycine max) F2 Phenotypic evaluation Heritability of agronomic traits Michelle et al.(2018) Lima Bean (Phaseolus lunatus) F2 Phenotypic evaluation Resistance status of
Phytophthora phaseoli
Santamaria et al.(2018) Potato (Solanum tuberosum) F2 KASP genotyping Tuber shape, flesh and skin
colour QTLs
Meijer et al.(2018)
Melon (Cucumis melo) F2 CAPS Melon fruit QTLs Baloch et al.(2016)
Eggplant (Solanum melongena) F2 RAD-tag Fruit properties QTLs Toppino et al.(2016)
of three stages: (i) identification of sufficient molecular markers to represent the genome at a good coverage, (ii) association between major traits and markers, and (iii) detection of recombination events between markers, traits, and the rest of the genome (Babu et al. 2004). It has helped to improve many crops or to introduce new characters, as in the case of common bean (Brinez et al. 2017). MAS is gen-erally used for single or major QTL mapping throughout generations (Hasan et al. 2015). To monitor these genes or QTLs, the ideal markers need to be located at the desired loci. Such markers may also exhibit linkage disequilib-rium, which offers possibilities of inheritance of a gene with markers (Babu et al. 2004). Nevertheless, it is difficult to identify these markers. SSR and SNP markers have been used for monitoring QTLs. To date, MAS has been applied
to many vegetable crops, qualitatively and quantitatively (table2).
As seen in table2, backcross populations are used in various forms in breeding studies. The forms of back-cross populations include backback-cross inbred line and F1 generation backcrossed several times. The derivatives of these different and classic backcross populations depend on the serial crossing and backcrossing strategy. Nearly all of these populations have been analysed with high-throughput molecular methods like genotyping by sequenc-ing (GBS), specific locus amplified fragment sequencsequenc-ing (SLAF-seq), GoldenGate genotyping, InDel and restric-tion enzyme sequence comparison analysis (RESCAN). All these efforts significantly help in accelerating the pro-cess of releasing new cultivars and dissecting special genes.
Figure 2. Schematic representation of backcross population. Respectively, donor and recurrent parents are represented as diploid 2 chromosomes with black and white colours. F1, first cross between donor and recurrent parents. BC1, first backcross with recurrent parent. BC2, second backcross with recurrent par-ent. BC3, third backcross with recurrent parent, modified from Schneider(2005).
Doubled haploid lines
Doubled haploids (DHs) can either occur naturally or be induced in vitro. They were first discovered in the early 20th century and were intensely used in the breeding of Brassi-caceae family, over the last decade (Hasan et al. 2016;Lv
et al. 2016;Mang et al. 2016). DH lines are mostly pro-duced from suitable diploid species, and until now, more than 200 species have been generated (Ren et al. 2017). Nevertheless, there are some limitations in using DH lines. Major limiting factors for DH production include lifespan (annual, biennial or perennial), mating systems (autogamy, allogamy or propagation), and reproductive stages (flow-ering periods) of the plants.
The three common methods for inducing DH are gyno-genesis, androgyno-genesis, and wide hybridization (interspecies cross), each followed by chemical treatment for chromo-some doubling (Bohanec 2009; Guha and Maheshwari 1964; Kasha and Kao 1970; Ravi and Chan 2010). All selected pollens and ovules from DH candidate cells must be in immature form for their regeneration capabilities to be at higher degrees (Yang and Zhou 1982;Bhojwani and
Razdan 1996). These cells are particularly stable mater-nal cells and the offspring arising from them tend not to be infertile or albino (Dwivedi et al. 2015). In gynogen-esis and androgengynogen-esis, immature ovules and pollens each have one set of chromosomes that need to be doubled. Wide hybridization is a cross between two distinct species. In this, one set of chromosomes disappears after the first division of embryonic cells. Due to the intentional elimina-tion of alien chromosome sets, haploid plant producelimina-tion is stimulated via one set of chromosomes. Haploid plants are distinct from their diploid counterparts. They have smaller and thinner forms, low vigor, and are mostly infer-tile (Delaat et al. 1987). After this stage, upon colchicine treatment, all three types of haploid plants regenerate normal diploid plants. Colchicine and its alternatives, like amiprophos-methyl (APM), pronamid, oryzalin, and trifluralin, block mitotic filament formation during cell division; thus, two identical chromosomes remain in the cells without separation (Schneider 2005; Semagn et al. 2006;Ren et al. 2017;Yan et al. 2017).
In breeding, DHs can be derived from both F1hybrids and F2generation. However, sometimes they can be pro-duced from F2 populations if more genetic diversity is required (figure 3) (Melchinger et al. 2011; Sleper and Bernardo 2016). DH lines are ideal for observing reces-sive, non or imperfect dominant traits, as they carry identical chromosome pairs containing only one set of alle-les for all the traits, desired and otherwise. There are several advantages of using DH lines. They enable detection of genotype–phenotype relations. They eliminate inbreeding depression, arising in cross-pollinated species and self-incompatibility systems (Pen et al. 2018). DH lines remove any residual heterozygosity and reduce the time for gen-eration of pure lines, which would otherwise require at least six generations of selfing (Velmurugan et al. 2018). Most importantly, they shorten the duration of culti-var development, producing true breeding lines that are 100% homozygous (Segui-Simarro 2015). DH population structure is stable compared to F2populations. However, there are some disadvantages of using DH lines, such as genotype-dependency, low genetic diversity, infertility, albinism, aneuploidy and high levels of segregation dis-tortion compared to backcross populations (Semagn et al. 2006;Tanhuanpaa et al. 2008; Kumari et al. 2009;Yan
et al. 2017).
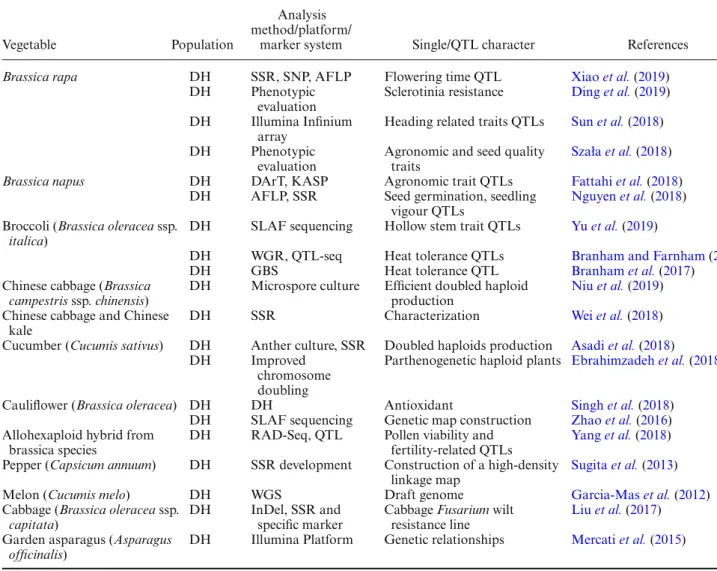
As seen in table 3, the members of the Brassicaceae family exemplify DHs. This is due to the compatibility of their mating systems and reproductive organs. This family shows a high tendency toward anther culture and chromo-some doubling. Table3summarizes the DH populations combined with high-throughput analysis methods, like Golden Gate SNP genotyping, InDel, RAD-Seq, SLAF sequencing, Illumina Infinium array, WGR, QTL-seq, and GBS. The whole genome sequencing or reduced represen-tation genome sequencing methods have been commonly used for different purposes like discovering SSR and
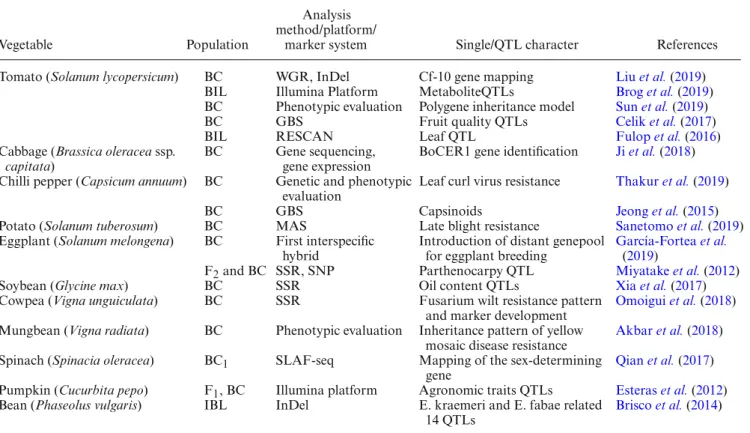
Table 2. MAS population studies from some vegetables and their analysis methods.
Vegetable Population
Analysis method/platform/
marker system Single/QTL character References Tomato (Solanum lycopersicum) BC WGR, InDel Cf-10 gene mapping Liu et al.(2019)
BIL Illumina Platform MetaboliteQTLs Brog et al.(2019) BC Phenotypic evaluation Polygene inheritance model Sun et al.(2019)
BC GBS Fruit quality QTLs Celik et al.(2017)
BIL RESCAN Leaf QTL Fulop et al.(2016)
Cabbage (Brassica oleracea ssp.
capitata)
BC Gene sequencing, gene expression
BoCER1 gene identification Ji et al.(2018) Chilli pepper (Capsicum annuum) BC Genetic and phenotypic
evaluation
Leaf curl virus resistance Thakur et al.(2019)
BC GBS Capsinoids Jeong et al.(2015)
Potato (Solanum tuberosum) BC MAS Late blight resistance Sanetomo et al.(2019) Eggplant (Solanum melongena) BC First interspecific
hybrid
Introduction of distant genepool for eggplant breeding
García-Fortea et al.
(2019)
F2and BC SSR, SNP Parthenocarpy QTL Miyatake et al.(2012)
Soybean (Glycine max) BC SSR Oil content QTLs Xia et al.(2017)
Cowpea (Vigna unguiculata) BC SSR Fusarium wilt resistance pattern and marker development
Omoigui et al.(2018) Mungbean (Vigna radiata) BC Phenotypic evaluation Inheritance pattern of yellow
mosaic disease resistance
Akbar et al.(2018) Spinach (Spinacia oleracea) BC1 SLAF-seq Mapping of the sex-determining
gene
Qian et al.(2017) Pumpkin (Cucurbita pepo) F1, BC Illumina platform Agronomic traits QTLs Esteras et al.(2012) Bean (Phaseolus vulgaris) IBL InDel E. kraemeri and E. fabae related
14 QTLs
Brisco et al.(2014)
BC, backcross; BC1, first backcrossed population; BIL, backcross inbreed line; BC2F1, two times backcrossed F1generation; BC1F1, backcrossed F1generation; IBL, inbreed backcross line; MAB, marker assisted breeding; SLAF-seq, specific locus amplified fragment sequencing.
Figure 3. Schematic representation of DHs population. Respec-tively, parental and F1DHs are represented as diploid 2 chromo-somes with black and white colours. F1: means first cross between two distinct parents (modified fromSeymour et al.(2012).
SNP, creating draft genome sequence, detecting SNP and aligning to the reference genome. DHs are very useful population for breeding (Bhatia et al. 2018), Also, it is possible to analyse classical marker systems and apply nearly all the high-throughput methods. Regrettably, lim-ited application to various species of vegetables is its major disadvantage.
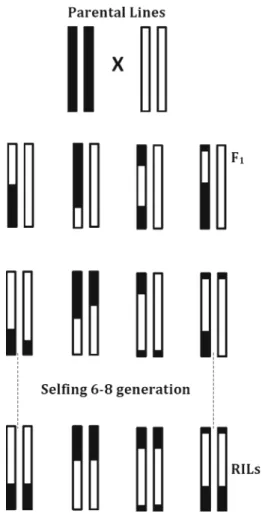
Recombinant inbred lines
Recombinant inbred line (RIL) is a powerful fine-mapping population, useful for the association and genetic map-ping studies. The ultimate purpose of RIL production is to obtain true breeding lines (Takuno et al. 2012). RILs are used to construct mapping population not only in self-pollinating species but also in cross-self-pollinating species by means of crosses for half-sib and full-sib families (Doerge 2002). RILs are expected to be stable, permanent and homozygous populations compared with the F2 popula-tion. They can be multiplied without any genetic change within the genome. They have been tested over years for documenting their acquired properties and exchanged with different research groups (Broman 2005;Yan et al.
Table 3. DHs population studies from some vegetables and their analysis methods.
Vegetable Population
Analysis method/platform/
marker system Single/QTL character References
Brassica rapa DH SSR, SNP, AFLP Flowering time QTL Xiao et al.(2019)
DH Phenotypic evaluation
Sclerotinia resistance Ding et al.(2019) DH Illumina Infinium
array
Heading related traits QTLs Sun et al.(2018) DH Phenotypic
evaluation
Agronomic and seed quality traits
Szała et al.(2018)
Brassica napus DH DArT, KASP Agronomic trait QTLs Fattahi et al.(2018)
DH AFLP, SSR Seed germination, seedling vigour QTLs
Nguyen et al.(2018) Broccoli (Brassica oleracea ssp.
italica)
DH SLAF sequencing Hollow stem trait QTLs Yu et al.(2019)
DH WGR, QTL-seq Heat tolerance QTLs Branham and Farnham(2019)
DH GBS Heat tolerance QTL Branham et al.(2017)
Chinese cabbage (Brassica
campestris ssp. chinensis)
DH Microspore culture Efficient doubled haploid production
Niu et al.(2019) Chinese cabbage and Chinese
kale
DH SSR Characterization Wei et al.(2018)
Cucumber (Cucumis sativus) DH Anther culture, SSR Doubled haploids production Asadi et al.(2018)
DH Improved
chromosome doubling
Parthenogenetic haploid plants Ebrahimzadeh et al.(2018)
Cauliflower (Brassica oleracea) DH DH Antioxidant Singh et al.(2018) DH SLAF sequencing Genetic map construction Zhao et al.(2016) Allohexaploid hybrid from
brassica species
DH RAD-Seq, QTL Pollen viability and fertility-related QTLs
Yang et al.(2018) Pepper (Capsicum annuum) DH SSR development Construction of a high-density
linkage map
Sugita et al.(2013)
Melon (Cucumis melo) DH WGS Draft genome Garcia-Mas et al.(2012)
Cabbage (Brassica oleracea ssp.
capitata)
DH InDel, SSR and specific marker
Cabbage Fusarium wilt resistance line
Liu et al.(2017) Garden asparagus (Asparagus
officinalis)
DH Illumina Platform Genetic relationships Mercati et al.(2015)
BC, backcross; DH, doubled haploid; SLAF-seq, specific locus amplified fragment sequencing.
2017). These properties make them one of the most impor-tant breeding populations.
RILs are constructed via single seed descendent (SSD) selection approach, which depends on creating F2 popu-lation and repeated selecting of desirable seeds from F2to F6or F8(figure4) (van Berloo and Stam 1998;Keurentjes
et al. 2011). The selection process is continued for at least six to eight generations to attain a high degree of purity. About 99% of purity is expected at the end of eight gener-ations of selfing (Seymour et al. 2012). Besides this, RILs are used for high-quality mapping resolution (Broman 2005). During the construction of SSD lines, not only one but also multiple lines (seeds) may be selected from each generation to achieve the ultimate breeding goals. These selected seeds represent different genotypes and contain different genetic segments of introgression in their genome (Dole and Weber 2007). In the selection of parental geno-types, highly homozygous inbred lines should be used to construct new breeding populations (RIL) (Lander and Botstein 1989). To achieve high purity, RILs must be
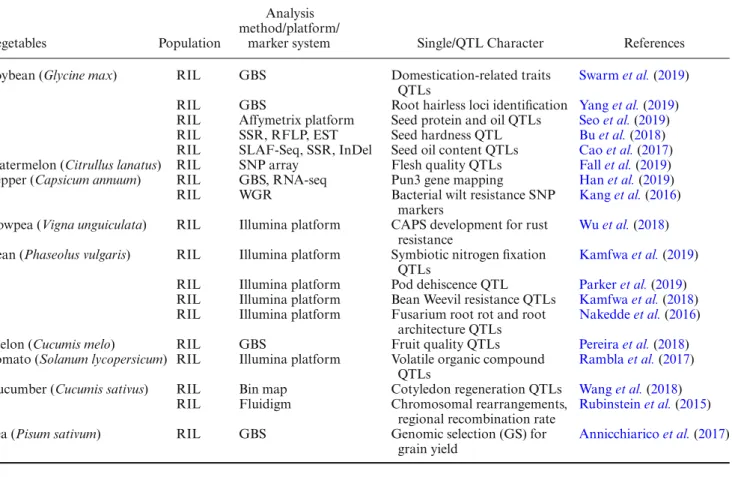
constructed from self-compatible species as opposed to self-incompatible species and the species should be suitable for selfing throughout generations (Madhusudhana 2015). At the end of the selfing process, RILs consist of homozygous individuals like DHs, but with some differ-ences. As a result of crossing over through generations, RILs include some residual heterozygosity as well as exhibit links between markers and QTLs. When sufficient homozygosity is achieved, crossing over no longer causes differentiation in the genomic content (Schneider 2005). As a result of genomic stability, the ratio of informa-tion from RILs, in terms of dominant and codominant markers, is expected to be 1:1 (Yan et al. 2017). There-fore, genetic diversity and linkage disequilibrium can be assessed for both dominant and codominant marker sys-tems. Further, QTL detection and fine-mapping can be achieved efficiently with these populations. The afore-mentioned reasons make RILs ideal for QTL mapping (Ashrafi et al. 2009). As seen in table4, RILs are widely used to map QTLs by using various high-throughput
Figure 4. Schematic representation of RILs. Respectively, F2 and offspring are represented as diploid 2 chromosomes with black and white colours, modified fromBurr and Burr(1991).
array platforms like Fluidigm, Illumina, iSelect, InDel. In addition to these, SSR, RFLP and EST-based classical QTL mapping can also be done by using these fine-mapping populations.
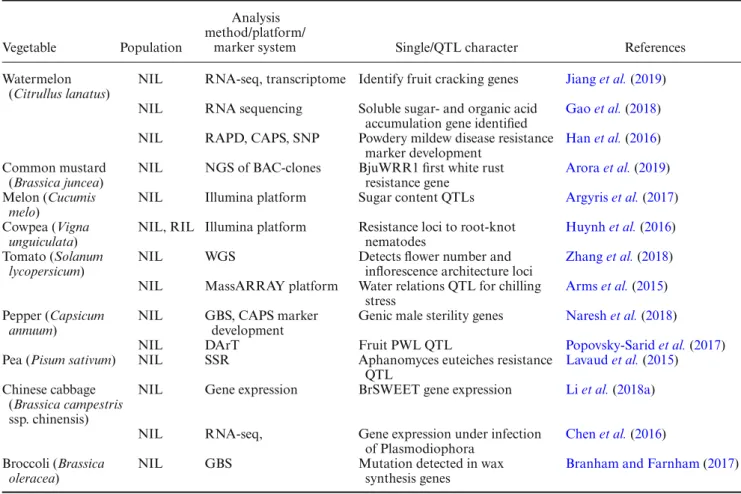
Near-isogenic lines
Near-isogenic line (NIL) is another important fine-mapping population for self-pollinating species in the breeding programmes (Argyris et al. 2017). NILs carry a single, desirable gene from a donor parent and the remain-ing genomic content is isoform with the recipient parents (Eshed and Zamir 1995). Since all the other genes in the genome are the same except for the gene of interest, it can be assumed that the gene of interest produces phenotypi-cal differences. Due to their highly homozygous structures, dominant and codominant markers have equal informa-tion contents on NILs (Semagn et al. 2006). They show heterozygosity with respect to the gene of interest (Farre
et al. 2016). The number of markers required for mapping population is quite low compared to the other populations
(Yano et al. 1997). Additionally, NILs transform quanti-tative traits into qualiquanti-tative traits.
The development of NILs requires several steps of self-ing and backcrossself-ing. The first step is to find parental inbred lines—a donor and a recipient. Donor parents may be selected from elite backcross populations, RILs, DHs, heterogeneous inbred families (HIF) or wild progenitors (Kooke et al. 2012a). Mostly, elite cultivars are preferred as recipient parents, as they are highly homozygous without any remnants of undesired traits and include a superior desired trait. After the first cross, the F1 generation is backcrossed with the selected recipient parent for several generations to ensure adequate homozygosity. Backcross-ing enhances the chances of the gene of interest beBackcross-ing fixed and the remaining parts of introgressed DNA segment being removed from the offspring. Finally, two rounds of selfing are needed for fixation of the target gene (figure5). The chief goals of creating NIL populations are the production of congenic strains, dissection of quantitative trait locus, identification of target gene functions, posi-tional identification and cloning of the gene of interest, and development of markers tightly linked with the inter-ested segment of genome (Yan et al. 2017). NILs are also immortal along with the immortalized F2, RILs, and advanced BC populations. Nonetheless, the major disad-vantages of construction of NILs are that it is a highly labour-intensive and a time-consuming process. Further, tightly linked undesirable traits may also pose a prob-lem within these populations due to limited recombination rates between the undesirable traits and the genes of inter-est. As an advantage, NILs enable detection of minor QTL that could be missed in RILs (Keurentjes et al. 2007). All these characteristics emphasize that NILs can be easily integrated with high-throughput molecular methods and efficiently used for developing better cultivars, as seen in table5.
Multiparental crossing populations
Nested association mapping populationFrom the perspective of breeding, valuable traits are gen-erally inherited as polygenic characteristics (Liang et al. 2015). In this regard, linkage and association mapping are two main population analysis methods for identify-ing these complex inherited traits. The ultimate goals of any breeder are to identify these complex traits and to accumulate them into a cultivar, which is finally renamed as an elite cultivar (Hamawaki et al. 2019;Deokar et al. 2019;Obi et al. 2019;Sapkota et al. 2019;Vallarino et al. 2019). Breeders can achieve these goals in two ways. First is to use numerous markers for generating a high-resolution genomic map. Second is to construct dissected populations in terms of complex traits (Gibson 2012;Stadlmeier et al. 2018).
Table 4. Schematic representation of RILs. Respectively, F2and offspring are represented as diploid 2 chromosomes with black and white colours (modified fromBurr and Burr(1991)).
Vegetables Population
Analysis method/platform/
marker system Single/QTL Character References Soybean (Glycine max) RIL GBS Domestication-related traits
QTLs
Swarm et al.(2019) RIL GBS Root hairless loci identification Yang et al.(2019) RIL Affymetrix platform Seed protein and oil QTLs Seo et al.(2019) RIL SSR, RFLP, EST Seed hardness QTL Bu et al.(2018) RIL SLAF-Seq, SSR, InDel Seed oil content QTLs Cao et al.(2017) Watermelon (Citrullus lanatus) RIL SNP array Flesh quality QTLs Fall et al.(2019) Pepper (Capsicum annuum) RIL GBS, RNA-seq Pun3 gene mapping Han et al.(2019)
RIL WGR Bacterial wilt resistance SNP
markers
Kang et al.(2016) Cowpea (Vigna unguiculata) RIL Illumina platform CAPS development for rust
resistance
Wu et al.(2018) Bean (Phaseolus vulgaris) RIL Illumina platform Symbiotic nitrogen fixation
QTLs
Kamfwa et al.(2019) RIL Illumina platform Pod dehiscence QTL Parker et al.(2019) RIL Illumina platform Bean Weevil resistance QTLs Kamfwa et al.(2018) RIL Illumina platform Fusarium root rot and root
architecture QTLs
Nakedde et al.(2016) Melon (Cucumis melo) RIL GBS Fruit quality QTLs Pereira et al.(2018) Tomato (Solanum lycopersicum) RIL Illumina platform Volatile organic compound
QTLs
Rambla et al.(2017) Cucumber (Cucumis sativus) RIL Bin map Cotyledon regeneration QTLs Wang et al.(2018)
RIL Fluidigm Chromosomal rearrangements, regional recombination rate
Rubinstein et al.(2015)
Pea (Pisum sativum) RIL GBS Genomic selection (GS) for
grain yield
Annicchiarico et al.(2017)
Figure 5. Schematic representation of NILs. Respectively, F1 and offspring are represented as diploid 4 chromosomes with black and white colours, modified fromKooke et al.(2012b).
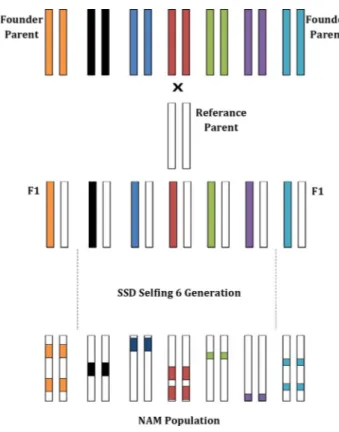
One such dissected population is the nested associa-tion mapping (NAM) populaassocia-tion. NAM populaassocia-tions are a kind of multi-parental genetic mating strategies that consist of a large number of founder parents and one maintainer or reference parent (Ladejobi et al. 2016). Fur-ther, derived progenies and donor parents are screened with a number of markers and phenotypes to recognize the substituted chromosomal segments or loci, as in the case of maize breeding programme (Kump et al. 2011;
Hung et al. 2012). NAM populations also help in detect-ing the origin of rare alleles from a wide range of founder parents (McMullen et al. 2009). Additionally, the NAM population forms a powerful tool for analysing com-plex traits as it can be used for linkage and association analyses in the same population, giving it a significant advantage over other methods (Zhang et al. 2005; Yu
et al. 2008). In diploid species, diversity is limited to two parental lines, but these barriers can be exceeded via multiparental founders that consist of divergent genetic background (Welsh and McMillan 2012). A multiparental population offers observing many allelic variations into the phenotype and increasing the efficient detection of QTLs because of its own diverse genetic background (Yu et al. 2008). This background consists of varieties, inbreeds, accessions, ecotypes, races, DHs, mutants and wild types.
Table 5. Schematic representation of NILs. Respectively, F1and offspring are represented as diploid 4 chromosomes with black and white colours (modified fromKooke et al.(2012a)).
Vegetable Population
Analysis method/platform/
marker system Single/QTL character References
Watermelon (Citrullus lanatus)
NIL RNA-seq, transcriptome Identify fruit cracking genes Jiang et al.(2019) NIL RNA sequencing Soluble sugar- and organic acid
accumulation gene identified
Gao et al.(2018) NIL RAPD, CAPS, SNP Powdery mildew disease resistance
marker development
Han et al.(2016) Common mustard
(Brassica juncea)
NIL NGS of BAC-clones BjuWRR1 first white rust resistance gene
Arora et al.(2019) Melon (Cucumis
melo)
NIL Illumina platform Sugar content QTLs Argyris et al.(2017) Cowpea (Vigna
unguiculata)
NIL, RIL Illumina platform Resistance loci to root-knot nematodes
Huynh et al.(2016) Tomato (Solanum
lycopersicum)
NIL WGS Detects flower number and
inflorescence architecture loci
Zhang et al.(2018) NIL MassARRAY platform Water relations QTL for chilling
stress
Arms et al.(2015) Pepper (Capsicum
annuum)
NIL GBS, CAPS marker development
Genic male sterility genes Naresh et al.(2018)
NIL DArT Fruit PWL QTL Popovsky-Sarid et al.(2017)
Pea (Pisum sativum) NIL SSR Aphanomyces euteiches resistance QTL
Lavaud et al.(2015) Chinese cabbage
(Brassica campestris ssp. chinensis)
NIL Gene expression BrSWEET gene expression Li et al.(2018a)
NIL RNA-seq, Gene expression under infection of Plasmodiophora
Chen et al.(2016) Broccoli (Brassica
oleracea)
NIL GBS Mutation detected in wax
synthesis genes
Branham and Farnham(2017)
To create a NAM population, classical breeding activi-ties of crossing, selfing and selecting are used to generate a large number of RILs that have a wide range of founders and a reference line. This strategy is more suitable for cultivated plants that have multiple germplasm and pro-genitor species collections. After crossing with a wide range of founders, multiple RILs are maintained via selfing and selecting over at least six generations. As in the case with RIL population, immortality is achieved by selfing it through six generations (figure6). Up to now, NAM pop-ulations have been applied to grain species such as maize, wheat, barley and rice (Fragoso et al. 2017;Draicchio et al. 2018;Jordan et al. 2018;Liang et al. 2019). Besides, they have also helped to enhance the vegetable species such as common bean and soybean (Hoyos-Villegas et al. 2016;
Chen et al. 2017;Li et al. 2017;Diers et al. 2018;Khan
et al. 2018;Scott et al. 2019).
RIL and NAM populations are suitable for application with high-throughput molecular marker systems. SNP and other marker systems offer to construct integrated genetic maps, such as linkage and association maps. Derived and maintained individuals enable linkage analysis. Phenotype and marker data for each generation allows finding an
association for agronomically important traits. GBS stud-ies can easily be applied to these populations because the reference sequence information, as well as the founder or reference parents are good sources for observing chromo-somal substitutions.
Multiparent advanced generation intercross
Multiparental populations provide precise details of the desired phenotypic traits as well as increase detection and resolution of QTLs due to higher recombination rates (Cavanagh et al. 2008). According toHuang et al.(2015), it is a panoramic angle of population studies. Constructing a multiparent advanced generation intercross (MAGIC) population may render many genomic regions into a single individual. In other words, all the founder parents con-tribute to a certain extend to the final product.
The selection of parental lines for creating MAGIC populations requires several considerations, as parental genetic background significantly affects the genetic diver-sity of the population. The primary deposit of founder parents consists of elite breeding lines, formed by farmer’s
Figure 6. Schematic representation of NAM. Respectively, F1 and offspring are represented as diploid 2 chromosomes. Each colour represents different progenitor parents. White colour is the reference parent, SSD, single seed descendant selection, modified fromYu et al.(2008).
recurrent selection, landraces, wild relatives, and germplasms (Aliyu et al. 2014). Huang et al. (2014) proposed a formula that estimates the contribution of founder alleles, the alleles affected by population num-ber, the genetic relatedness of founder, and density of markers. Thus, parental lines are selected according to the purpose of breeding and are incorporated with bal-anced contributions of the founder lines that ensure the ideal recombination rate for genetic diversity. The con-struction of MAGIC population is based on three steps: mixing, advanced intercrossing, and inbreeding (Huang
et al. 2015). Mixing is performed for producing an out-breed population. Wide founder lines are intercrossed to create adequate diversity via the funnel design. This design is necessary for accumulating different gene combinations from each parent into a single individual. Advanced inter-crossing is ‘n’ number of interinter-crossing of F1 generation with each other to introduce different gene combinations via recombination events. In inbreeding, as in the RIL, homozygous lines are generated via SSD selection. Alter-natively, doubled haploid lines are used to save time from the top of the funnel. After this point, the final product is either used for selfing or for generating doubled hap-loid (Kover et al. 2009). If selfed, additional recombination events could be observed throughout offspring. However,
Figure 7. Schematic representation of MAGIC. Respectively, F1 and offspring are represented as diploid 2 chromosomes. Each colour represents different progenitor parents, modified from
Bandillo et al.(2013).
the lines would be homozygous, if doubled haploids are generated (figure7).
The MAGIC population is a suitable mating system for cereals, such as rice, wheat and maize (Guan et al. 2017;
Descalsota et al. 2018;Sannemann et al. 2018). There are also some examples of vegetable crops, such as soybean, pigeon pea, tomato, fava bean, cowpea and strawberry (Pascual et al. 2015;Sallam and Martsch 2015; Shivaku-mar et al. 2016;Ripoll et al. 2016;Huynh et al. 2018;Wada
et al. 2017). However, it is not applicable in vegetables due to limitations in their mating systems compared to field crops. For example, some vegetables have a biennial mat-ing system.
Although high-throughput molecular methods can be applied to MAGIC population progenies, only a few give desired results. Residual heterozygosity causes loss of func-tion in molecular markers and generates false positive results (Dickson et al. 2010; Korte and Farlow 2013). Additionally, huge structural variations make sequence readings complicated during genotyping by sequencing or next-generation sequencing methods (Elshire et al.
2011). Also, MAGIC population construction is a labour-intensive and a time-consuming process.
Conclusion
Nowadays, under the constantly changing environmental conditions, sustaining and increasing agricultural pro-duction have gained more importance than ever before. Previously, two methods were widely used: (i) examin-ing the existexamin-ing germplasm with genome-wide association studies by using thousands of markers and (ii) investigat-ing the breedinvestigat-ing populations generated by usinvestigat-ing available genetic resources. Conventional breeding simply depended on the selection of superior traits from the ordinary ones. However, genotype–environment interaction was a major limitation faced in this selection process.
The introduction of novel technologies paved the way for identification of new genes and development of highly adaptable varieties. The limitations were resolved by dis-covering constitutive quantitative traits loci and integrat-ing them into any genome of the breedintegrat-ing populations. Thus, these technologies empowered breeders to manipu-late plants at genomic levels. In addition, a decrease in cost per sample for DNA sequencing led to the widespread use of next-generation sequencing technologies by breeders. Thus, the major goal of numerous studies was to integrate agronomically valuable traits into the selected elite culti-vars.
Breeding populations are used to obtain various com-binations of parental alleles, fix inheritance of desirable alleles, shorten the breeding time, ensure homozygosity and test additive or dominance effects. They also pro-vide greater mapping resolutions, transform quantitative traits to qualitative traits and allow biparental allele bar-rier to be exceeded. Thus, population studies along with the integrated advanced molecular tools have powerful appli-cations in agriculture.
References
Abbo S. and Gopher A. 2017 Near eastern plant domestication: a history of thought. Trends Plant Sci. 22, 491–511.
Akbar W., Aslam M., Maqbool M. A., Ali M. and Arshad M. 2018 Inheritance pattern of mungbean yellow mosaic disease resistance and gene action for different traits in mungbean (Vigna radiata (L.) Wilczek) under protected and unprotected field conditions. Plant Breed. 137, 763–772.
Aliyu S., Massawe F. and Mayes S. 2014 Beyond landraces: developing improved germplasm resources for underutilized species – a case for Bambara groundnut. Biotechnol. Genet.
Eng. Rev. 30, 127–141.
Anhalt U. C. M., Heslop-Harrison P., Byrne S., Guillard A. and Barth S. 2008 Segregation distortion in Lolium: evidence for genetic effects. Theor. Appl. Genet. 117, 297–306.
Annicchiarico P., Nazzicari N., Pecetti L., Romani M., Ferrari B., Wei Y. L. et al. 2017 GBS-Based genomic selection for pea
grain yield under severe terminal drought. Plant Genome 10, 1–13.
Argyris J. M., Diaz A., Ruggieri V., Fernandez M., Jahrmann T., Gibon Y. et al. 2017 QTL analyses in multiple populations employed for the fine mapping and identification of candi-date genes at a Locus affecting sugar accumulation in melon (Cucumis melo L.). Front. Plant Sci. 8, article ID 1679. Arms E. M., Bloom A. J. and St Clair D. A. 2015 High-resolution
mapping of a major effect QTL from wild tomato Solanum habrochaites that influences water relations under root chilling
Theor. Appl. Genet. 128, 1713–1724.
Arora H., Padmaja K. L., Paritosh K., Mukhi N., Tewari A. K., Mukhopadhyay A. et al. 2019 BjuWRR1, a CC-NB-LRR gene identified in Brassica juncea, confers resistance to white rust caused by Albugo candida. Theor. Appl. Genet. 32, 2223– 2236.
Asadi A., Zebarjadi A., Abdollahi M. R. and Seguí-Simarro J. M. 2018 Assessment of different anther culture approaches to produce doubled haploids in cucumber (Cucumis sativus L.).
Euphytica 214, 216.
Ashikari M. and Matsuoka M. 2006 Identification, isolation and pyramiding of quantitative trait loci for rice breeding. Trends
Plant Sci. 11, 344–350.
Ashrafi H., Kinkade M. and Foolad M. R. 2009 A new genetic linkage map of tomato based on a Solanum lycopersicum x S. pimpinellifolium RIL population displaying locations of candidate pathogen response genes. Genome 52, 935– 956.
Babu R., Nair S. K., Prasanna B. M. and Gupta H. S. 2004 Inte-grating marker-assisted selection in crop breeding - prospects and challenges. Curr. Sci. India 87, 607–619.
Balconi C., Stevanato P., Motto M. and Biancardi E. 2012 Breed-ing for biotic stress resistance/tolerance in plants. In Crop
production for agricultural improvement. (ed. M. Ashraf M.,
M. Öztürk M., M. S. A. Ahmad and A. Aksoy), pp. 57–114. Springer Netherlands, Dordrecht.
Baloch A. M., Baloch A. W., Liu S., Gao P., Baloch M. J., Wang X. Z. et al. 2016 Linkage map construction and Qtl analysis of fruit traits in melon (Cucumis Melo L.) based on caps. Markers
Pak. J. Bot. 48, 1579–1584.
Bandillo N., Raghavan C., Muyco P. A., Sevilla M. A. L., Lobina I. T., Dilla-Ermita C. J. et al. 2013 Multi-parent advanced gen-eration inter-cross (MAGIC) populations in rice: progress and potential for genetics research and breeding. Rice 6, 11. Barabaschi D., Tondelli A., Desiderio F., Volante A., Vaccino P.,
Vale G. et al. 2016 Next generation breeding. Plant Sci. 242, 3–13.
Baret P. V., Knott S. A. and Visscher P. M. 1998 On the use of linear regression and maximum likelihood for QTL mapping in half-sib designs. Genet. Res. 72, 149–158.
Belyayev A. 2014 Bursts of transposable elements as an evolu-tionary driving force. J. Evol. Biol. 27, 2573–2584.
Bhanu A. N., Singh M. N. and Srivastava K. 2019 Genetic analy-sis of gene-specific reanaly-sistance to mungbean yellow mosaic virus in mungbean (Vigna radiata). Plant Breed.https://doi.org/10. 1111/pbr.12675.
Bhatia R., Dey S. S., Parkash C., Sharma K., Sood S., Kumar R. 2018 Modification of important factors for efficient microspore embryogenesis and doubled haploid production in field grown white cabbage (Brassica oleracea var. capitata L.) genotypes in India. Sci. Hortic. 233,178–187.
Bhojwani S. S. and Razdan M. K. (ed.) 1996 Plant tissue cul-ture : theory and practice, a revised edition. In Studies in plant
science. p ix. Elsevier.
Bohanec B. 2009 Doubled haploids via gynogenesis. In Advances
Forster and S. M. Jain), pp. 35–46. Springer Netherlands, Dor-drecht.
Branham S. E. and Farnham M. W. 2017 Genotyping-by-sequencing of waxy and glossy near-isogenic broccoli lines.
Euphytica 213, 84.
Branham S. E. and Farnham M. W. 2019 Identification of heat tolerance loci in broccoli through bulked segregant analysis using whole genome resequencing. Euphytica 215, 34. Branham S. E., Stansell Z. J., Couillard D. M. and
Farn-ham M. W. 2017 Quantitative trait loci mapping of heat tolerance in broccoli (Brassica oleracea var. italica) using genotyping-by-sequencing. Theor. Appl. Genet. 130, 529– 538.
Brinez B., Perseguini J., Rosa J. S., Bassi D., Goncalves J. G. R., Almeida C. et al. 2017 Mapping QTLs for drought tolerance in a SEA 5 x AND 277 common bean cross with SSRs and SNP markers. Genet. Mol. Biol. 40, 813–823.
Brisco E. I., Porch T. G., Cregan P. B. and Kelly J. D. 2014 Quan-titative trait loci associated with resistance to Empoasca in common bean. Crop Sci. 54, 2509–2519.
Brog Y. M., Osorio S., Yichie Y., Alseekh S., Bensal E., Kochevenko A. et al. 2019 A Solanum neorickii introgression population providing a powerful complement to the exten-sively characterized Solanum pennellii population. Plant J. 97, 391–403.
Broman K. W. 2005 The genomes of recombinant inbred lines.
Genetics 169, 1133–1146.
Bu Y., Zhang X., Wang C., Guo J., Zhang X., Li X. et al. 2018 Conditional and unconditional QTL analyses of seed hardness in vegetable soybean (Glycine max L. Merr.). Euphytica 214, 237.
Burr B. and Burr F. A. 1991 Recombinant inbreds for molecular mapping in maize - theoretical and practical considerations.
Trends Genet. 7, 55–60.
Cao Y. C., Li S. G, Wang Z. L., Chang F. G., Kong J. J., Gai J. Y. et al. 2017 Identification of major quantitative trait Loci for seed oil content in soybeans by combining linkage and genome-wide association mapping. Front. Plant Sci. 8, 1222.
Cavanagh C., Morell M., Mackay I. and Powell W. 2008 From mutations to MAGIC: resources for gene discovery, validation and delivery in crop plants. Curr. Opin. Plant Biol. 11, 215– 221.
Ceamerarius R. J. 1694 Rudolphi Jacobi Camerarii ad Thes-salum, D. Mich. Bernardum Valentini De sexu plantarum epistola [microform]. Tybingai: Typis Viduae Rommeili. Celik I., Gurbuz N., Uncu A. T., Frary A. and Doganlar
S. 2017 Genome-wide SNP discovery and QTL mapping for fruit quality traits in inbred backcross lines (IBLs) of solanum pimpinellifolium using genotyping by sequencing.
BMC Genomics 18, 1.
Chen J., Pang W., Chen B., Zhang C. and Piao Z. 2016 Tran-scriptome analysis of Brassica rapa near-isogenic lines carrying clubroot-resistant and –susceptible alleles in response to
Plas-modiophora brassicae during early infection. Front. Plant Sci. 6, 1183.
Chen S. S., Han X. J., Fang J., Lu Z. C., Qiu W. M., Liu M. Y. et al. 2017 Sedum alfredii SaNramp6 metal transporter contributes to cadmium accumulation in transgenic Arabidopsis thaliana.
Sci. Rep. 7, 13318.
Da F. S. Michelle, Möller M., Clough S. J. and Pinheiro J. B. 2018 Heritability of agronomic traits correlated with reduced stink bug damage in an F2:3soybean population derived from IAC-100. J. Crop Improv. 32, 1–18.
De Beukelaer H., De Meyer G. and Fack V. 2015 Heuristic exploitation of genetic structure in marker-assisted gene pyra-miding problems. BMC Genet. 16, 2.
Delaat A. M. M., Gohde W. and Vogelzang M. J. D. C. 1987 Determination of ploidy of single plants and plant-populations by flow-cytometry. Plant Breed. 99, 303–307. Deokar A., Sagi M., Daba K. and Tar’an B. 2019 QTL
sequenc-ing strategy to map genomic regions associated with resistance to ascochyta blight in chickpea. Plant Biotechnol. J. 17, 275– 288.
Descalsota G. I. L, Swamy B. P. M., Zaw H., Inabangan-Asilo M. A., Amparado A., Mauleon R. et al. 2018 Genome-wide association mapping in a Rice MAGIC plus population detects QTLs and genes useful for biofortification. Front. Plant Sci. 9, 1347.
Deschamps S., Llaca V. and May G. D. 2012 Genotyping-by-sequencing in plants. Biology 1, 460–483.
Dickson S. P., Wang K., Krantz I., Hakonarson H. and Gold-stein D. B. 2010 Rare variants create synthetic genome-wide associations. PLoS Biol. 8, e1000294.
Diers B. W., Specht J., Rainey K. M., Cregan P., Song Q., Ramasubramanian V. et al. 2018 Genetic architecture of soybean yield and agronomic traits. G3 (Bethesda) 8, 3367–3375.
Ding Y., Mei J., Wu Q., Xiong Z., Li Y., Shao C. et al. 2019 Synchronous improvement of subgenomes in allopolyploid: a case of Sclerotinia resistance improvement in Brassica napus.
Mol. Breed. 39, 10.
Doebley J. F., Gaut B. S. and Smith B. D. 2006 The molecular genetics of crop domestication. Cell 127, 1309–1321.
Doerge R. W. 2002 Mapping and analysis of quantitative trait loci in experimental populations. Nat. Rev. Genet. 3, 43–52. Dole J. and Weber D. F. 2007 Detection of quantitative trait
loci influencing recombination using recombinant inbred lines.
Genetics 177, 2309–2319.
Draicchio F., Sharma R., Flavell A. J., Bull H., Thomas W. T. B., Maurer A. et al. 2018 Genome-wide association of yield traits in a nested association mapping population of barley reveals new gene diversity for future breeding. J. Exp. Bot. 69, 3811–3822.
Dwivedi S. L., Britt A. B., Tripathi L., Sharma S., Upadhyaya H. D. and Ortiz R. 2015 Haploids: constraints and opportunities in plant breeding. Biotechnol. Adv. 33, 812–829.
Dwivedi S. L., Ceccarelli S., Blair M. W., Upadhyaya H. D., Are A. K. and Ortiz R. 2016 Lancrace Germplasm for improving yield and abiotic stress adaptation. Trends Plant Sci. 21, 31–42. Eathington S. R., Crosbie T. M., Edwards M. D., Reiter R., Bull J. K. 2007 Molecular markers in a commercial breeding program.
Crop Sci. 47, S154–S163.
Ebrahimzadeh H., Soltanloo H., Shariatpanahi M. E., Eskan-dari A. and Ramezanpour S. S. 2018 Improved chromosome doubling of parthenogenetic haploid plants of cucumber (Cucumis sativus L.) using colchicine, trifluralin, and oryza-lin. Plant Cell Tissue Organ Cult. 135, 407–417.
Elshire R. J., Glaubitz J. C., Sun Q., Poland J. A., Kawamoto K., Buckler E. S. et al. 2011 A robust, simple genotyping-by-sequencing (GBS) approach for high diversity species. PLoS
One.https://doi.org/10.1371/journal.pone.0019379.
Eshed Y. and Zamir D. 1995 An introgression line popula-tion of Lycopersicon pennellii in the cultivated tomato enables the identification and fine mapping of yield-associated QTL.
Genetics 141, 1147–1162.
Esteras C., Gomez P., Monforte A. J., Blanca J., Vicente-Dolera N., Roig C. et al. 2012 High-throughput SNP genotyping in
Cucurbita pepo for map construction and quantitative trait loci
mapping. BMC Genomics 13, 80.
Fall L. A., Perkins-Veazie P., Ma G. and McGregor C. 2019 QTLs associated with flesh quality traits in an elite× elite watermelon population. Euphytica 215, 30.