Energy Dissipation in Atomic Force Microscopy
and Atomic Loss Processes
Article in Physical Review Letters · January 2002 DOI: 10.1103/PhysRevLett.87.265502 · Source: PubMed CITATIONS92
READS66
5 authors, including: Some of the authors of this publication are also working on these related projects: Confined liquidsView project Small amplitude AFM
View project Peter Hoffmann Wayne State University 61 PUBLICATIONS 752 CITATIONS SEE PROFILE Ahmet Oral Middle East Technical University 111 PUBLICATIONS 1,645 CITATIONS SEE PROFILE
All content following this page was uploaded by Ahmet Oral on 12 October 2014.
Energy Dissipation in Atomic Force Microscopy and Atomic Loss Processes
Peter M. Hoffmann*Department of Physics, Wayne State University, 666 W. Hancock, Detroit, Michigan 48201 Steve Jeffery and John B. Pethica
Department of Materials, University of Oxford, Parks Road, Oxford OX1 3PH, United Kingdom H. Özgür Özer and Ahmet Oral
Department of Physics, Bilkent University, Ankara, Turkey
(Received 24 May 2001; published 6 December 2001)
Atomic scale dissipation is of great interest in nanomechanics and atomic manipulation. We present dis-sipation measurements with a linearized, ultrasmall amplitude atomic force microscope which is capable of measuring dissipation at chosen, fixed separations. We show that the dynamic dissipation in the non-contact regime is of the order of a few 10–100 meV per cycle. This dissipation is likely due to the motion of a bistable atomic defect in the tip-surface region. In the contact regime we observe dc hystere-sis associated with nanoscale plasticity. We find the hysteretic energy loss to be 1 order of magnitude higher for a silicon surface than for copper.
DOI: 10.1103/PhysRevLett.87.265502 PACS numbers: 62.25. +g, 62.40. +i, 68.35. – p, 68.37.Ps
The interaction potential of an individual atomic bond can now be mapped out by atomic force microscopy (AFM) [1,2]. At larger separations the potential is found to be conservative, as might be expected, but at smaller separations the interaction becomes hysteretic or irre-versible. The onset of this dissipation is of considerable interest, both because atomic manipulation relies on the fine control and understanding of irreversible atom motion and because it suggests that loss processes at individual, specified atomic sites can be directly characterized and imaged. However, the origin of the site dependent energy losses in AFM has been the subject of much dispute, not least because of their large magnitude, up to 10 eV per approach-retraction cycle, with a strong, possibly exponential function of the tip-sample separation [3–5]. Attempts have been made to explain the dissipation by a disturbance by the moving tip of some equilibrium property such as the phonon gas in the solid [6] or the elec-tromagnetic field between tip and sample [7]. However, these give only weak deviations from equilibrium, and the energy coupled is generally much too low to explain the experimentally observed dissipation [6,8]. Dissipation at larger separations can also arise due to moving mirror charges, if the contact potential is uncompensated.
Recently, Gauthier and Tsukada [9] have shown that the observed magnitude and separation dependence of the en-ergy loss could be explained by considering the overall dy-namics of the tip trajectory. The physical origin lies in the nonlinearity of the interaction, and the bistability of the resonance curve. Thus the dissipation is the result of the large oscillation amplitude used in current experi-ments, which are much greater than the length scale of the interaction, every cycle being a complete approach and retraction with its associated positional hysteresis. Their model suggests that dissipation is not only associated with
some locally specific process and that large amplitude experiments cannot discriminate between the mechanisms. In this paper we introduce a small amplitude AFM tech-nique which avoids the bistability question, and allows us to directly measure energy dissipation at a specific, constant, tip-surface separation. We find that there is still significant dissipation when the tip and surface are definitely not in contact, up to 0.2 eV兾cycle at smaller separations, and with a strong separation dependence. We show that this can be quantitatively explained by atomic transitions with energies around 0.5 eV at sites near the interacting atoms, analogous to internal friction.
The measurements presented in this paper were obtained using sub-Å amplitudes [10] at frequencies well below the first lever resonance. In this mode, the AFM is linear which makes direct quantitative measurements of the force gradi-ent possible. Stiff levers (.100 N兾m) were used to avoid instability. This necessitates a very sensitive displacement sensor. In our case, the lever displacement is measured using a fiber interferometer with a sensitivity of a few 100 mV兾Å and a noise floor of 3 3 1024Å兾pHz. The lever base is driven at a frequency around 1 kHz far below its first resonance (艐12 kHz) and at amplitudes of ,0.2 Å. Changes in amplitude are monitored using a lock-in ampli-fier. For small amplitudes and far below the first resonance, the total measured interaction stiffness, ktot, is given by
ktot 苷 2 dF dz 苷 klever µ A0 A cosw 2 1 ∂ . (1)
Here A0 is the (fixed) amplitude of the lever when far
from the surface, A is the measured amplitude as the surface is approached, klever is the calibrated lever
stiff-ness, F is the total force, w is the phase difference between the drive and the lever, and z is the tip-sample displace-ment. The phase difference w between the driving signal 265502-1 0031-9007兾01兾87(26)兾265502(4)$15.00 © 2001 The American Physical Society 265502-1
and the actual lever motion gives a measure of losses. The lever stiffness was directly calibrated by applying a known force via a calibrated counterlever and measuring the displacements with an interferometer. The tip and lever were made of 90% Pt兾10% Ir and the sample was Cu(100) which was cleaned by alternating sputtering and anneal-ing cycles and checked by LEED and scannanneal-ing tunnelanneal-ing microscopy (STM) imaging. The UHV base pressure was 7 3 1029 Pa.
Now, there will be contributions to the phase shift w from intrinsic losses in the lever as well as due to interac-tions of the tip with the surface [11]. In our case, the Q of the lever was measured to be about 700, the system is operated far below resonance, the phase angles are small, and the lever amplitude is very close to the driving ampli-tude. Thus the intrinsic lever damping term will remain very small (about 1024of the losses due to tip-surface
in-teractions) and it can easily be verified that it can be ne-glected in our case. The tip-surface interaction power loss is therefore to a good approximation given by [11]
Ploss 苷 1
2 klevervA0Asinw . (2) The energy loss per cycle is then given by
Eloss苷 2pPloss
v 苷 pkleverA0Asinw . (3) The maximum damping force can be written as
Fg 苷 Eloss
pA . (4)
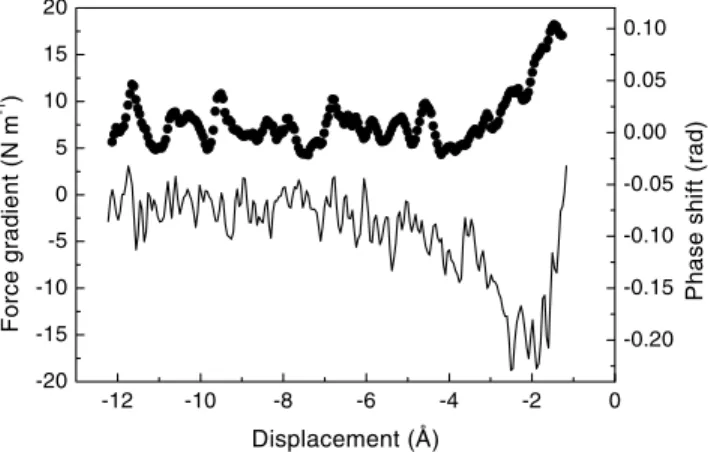
Figure 1 shows the interaction stiffness, ktot, and the
phase, w, measured as a function of tip to sample dis-placement. The interaction stiffness can be separated into a long range van-der-Waals term and a short range cova-lent part [1,2]. Here the short range term was due to an
-12 -10 -8 -6 -4 -2 0 -20 -15 -10 -5 0 5 10 15 20 Force gradient (N m -1 ) Displacement (Å) -0.20 -0.15 -0.10 -0.05 0.00 0.05 0.10 P
hase shift (rad)
FIG. 1. Total interaction stiffness (line) and phase (circles)
measured between a Pt兾Ir tip and cantilever and a Cu(100) sample. Note that the onset of the phase change coincides with the onset of short range attractive interactions between tip and
sample. A0was 0.14 Å and v苷 6283 rad s21.
interaction with a length range of 0.63 Å and a binding energy of 1.24 eV, and the van-der-Waals radius of the tip was 10.3 nm. The phase was found to only change once the tip enters the short range potential region. No measur-able phase change was ever observed at distances where only long range forces are significant. This indicates that losses in the tip-surface region are highly localized, and are not due to some mechanism affecting the macroscopic tip structure.
In Fig. 2, the energy loss per cycle (3) is plotted versus distance. It can be seen that the energy loss is a very steep function of the separation. The losses are of the order of 10’s of meV, which is significantly lower than values re-ported from large amplitude AFM measurements [3– 5]. Obviously, the kinetic energy available in our lever sys-tem is much lower, but just as importantly, the dissipation mechanism is restricted to local tip-surface interactions, and does not involve a large overall geometrically bistable tip trajectory [9]. The maximum damping force (4) is equal to 1.2 3 10210N.
The above observations imply an origin of the dissipa-tion in the immediate vicinity of the tip-surface region. The obvious candidate is an atom or defect with two sites separated by an energy barrier, which can be driven be-tween these sites by the force bebe-tween tip and surface. Such an atom is very likely to be found at or immediately adjacent to the tip apex. The atomic motion is rapid com-pared to the lever, and thus the relaxation energy goes al-most entirely into phonons rather than back to the lever kinetic energy. Consequently, energy is ultimately re-moved from the kinetic energy of the lever and dissipated into phonons and heat.
In the following we present a simple mechanism which gives rise to the observed phase shift between the lever excitation and tip motion and thus the energy dissipation. We assume a defect to be present in the tip-surface region
-12 -10 -8 -6 -4 -2 0 -0.01 0.00 0.01 0.02 0.03 0.04 Ener gy di s s ipat ion per c y c le ( e V) Displacement (Å)
FIG. 2. Energy dissipated per cycle (circles) during the
mea-surement shown in Fig. 1. The line indicates a fit using Eq. (8) and the integral of the short range part of force gradient data of Fig. 1.
which can take either of two energy states E1and E2which
are separated by an energy barrier EA. The
characteris-tic transition (relaxation) time between the two levels is given by t 苷 t0exp µ EA kBT ∂ . (5)
As the tip moves through the tip-surface potential the en-ergy levels E1 and E2 are shifted by an amount DE. For
small amplitudes A we can write
DE共t兲 苷 F共z兲A sin共vt兲 . (6) If the relaxation time t is sufficiently close to the period of the tip oscillation it will induce a phase shift a between the motion of the tip and the defect. We then expect a hysteresis in energy [12]. The phase shift a is given by
tana 苷 vt . (7)
The energy loss associated with this dynamic hysteresis is given by
Ediss 苷 F共z兲A sina 苷 F共z兲A
vt p
1 1 共vt兲2 . (8)
This very simple model contains only one fitting pa-rameter, the energy barrier EA. Using the dissipation
data shown in Fig. 2 and the short range component of the measured force, the energy EA was found to be
0.47 eV. The corresponding relaxation time (assuming t0 苷 10212sec) was 86 msec. Averaged over several
measurements — which were obtained at amplitudes rang-ing from 0.11 Å to 0.17 Å— we found 0.49 6 0.12 eV for the energy. This is a reasonable energy, of the magnitude associated with defect motion. As shown in Fig. 2, the model recreates the shape and magnitude of the measured dissipation quite well.
The induced atomic motion leads to an anelastic re-sponse of the tip-surface system which is not unlike in-ternal friction models in bulk materials. We also used models analogous to internal friction by modeling the tip as a Maxwell element [13]. While such a model is possibly more realistic, it leads to the same value for EA and
in-volves a larger number of fitting parameters. The value of
EA is essentially determined by the observed phase shifts
and thus a relaxation time of the order of 10’s of msec and an energy barrier of艐0.5 eV.
The presented mechanism preserves the integrity of the tip. While atomic motion plays a role in the dissipation mechanism, this motion is bistable and returns to its origi-nal position during each retraction cycle. This is consistent with the observed stability of images, so that even in the presence of significant dissipation, atomic resolution imag-ing is possible [4,14,15]. Atomic resolution dissipation imaging therefore results from the atom-by-atom variation of the short range interaction and thus of the energy losses as the tip is scanned across the surface.
The preceding model becomes inadequate once the interaction stiffness incorporates significant repulsion,
be-cause then the local forces are not simply related to overall stiffness. A crucial observation [2] is the fact that the overall force curves (from ` to closest approach) tend to be completely reversible (i.e., approach and retract curves are not displaced) as long as the stiffness remains negative. This is compatible with the preceding measurements of energy loss, because the time constant for the relaxation (86 msec) is much shorter than the time (a few 10’s of seconds) to measure an overall force-displacement curve. However, once the stiffness becomes positive, we observe significant hysteresis between the approach and retract curves [2]. Within the preceding model this means that we are accessing more and higher energy (longer relaxation time) atomic motion processes, i.e., plastic deformation. The overall (dc) hysteresis loop can be integrated to give the associated mechanical energy loss. The energy loss depends on the distance by which we compress beyond the zero stiffness intercept, as shown in Fig. 3. Interestingly, we find that the energy loss for a tungsten tip indenting a silicon surface is some 7–8 times the energy loss of Pt兾Ir against copper for the same compression distance. While we cannot exclude a systematic difference in tip shape, most of this energy difference is likely to be due to different mechanical properties.
The origin of this energy loss can be attributed to adhesion and plastic deformation. For the larger energies the plastic deformation component becomes dominant. Macroscopic parameters, such as the hardness, do not apply at this scale and cannot be used to estimate the energies. Molecular dynamics simulations (e.g., [16]) suggest that many atoms in the indenting neck region are undergoing displacement transitions once the stiffness becomes repulsive. It is therefore sensible to assign the majority of the energy to bond breaking and reforming.
Distance past force minimum (Å)
0 2 4 6 8 10 12 14 16 18 log( Ehy s t (eV) ) 0 1 2 3 4
Silicon surface / Tungsten tip Copper surface / Pt/Ir tip
FIG. 3. Energy associated with hysteresis loop as the tip is first
approached and then retracted from the surface. Plotted versus the maximum depth past the minimum of the force curve. The deformation energy is about 1 order of magnitude higher for silicon than for copper. The lines indicate fits using Eq. (9). For parameters see text.
In a simple model, the total dissipated energy will be a function of the energy needed to move atoms from their equilibrium positions and the total number of displaced atoms. The variation of the number of affected atoms with displacement implies a power law dependence of the dis-sipated energy on the indentation depth (DE 苷 CDzm). A least squares fit gives m 苷 1.02 and C 苷 6.73 (DE in eV and Dz in Å) for the case of copper indented with a Pt兾Ir tip and m 苷 1.37 and C 苷 27.92 in the case of Si indented with a W tip. Thus the exponents, m, are between 1 and 2 (but closer to 1). An exponent of 1.5 corresponds to a paraboloid tip, in which case we find
DE 苷 V Va Eb 苷 2p 3Va 共p2Rh兲3Eb. (9)
Here V is the deformed volume, Va is the atomic volume
in the lattice, h is the penetration depth of the tip, R is a characteristic radius of curvature at the apex, and Eb
is a bonding energy that describes the energy needed to move an atom out of its equilibrium position. Bulk self-diffusion energies are of the order of 2.1 eV for Cu and 4.8 eV for Si and surface diffusion energies are 0.25 and 0.67 eV, respectively, the latter being in the range of ener-gies discussed earlier in this paper. Fitting the data shown in Fig. 3 for these values of Ebwe find R 苷 2.8 11.6 Å
and R 苷 6.5 24.2 Å for Cu and Si, respectively. It is in-teresting to note that irreversibility is likely to be not solely the result of high energy processes, but can just as well be due to the large number of related atomic displacements and the resulting configurational entropy. One difference between the dynamic, “reversible” dissipation discussed in the first part of the paper and the nanoscale plasticity presented here might be the role of entropy, and it is this transition between single atomically reversible processes and larger scale, entropic processes which we are able to probe using AFM.
We have shown that by using a quantitative AFM tech-nique the atomic-scale dissipation during AFM operation can be measured at a chosen, essentially fixed separation. In the noncontact regime, dynamic loss processes can be explained by a coupling of the tip-surface interaction forces into an anelastic process involving atomic defect motion in the tip region. As the tip enters the contact region, dc hys-teresis is observed which is associated with large energy
losses. These are related to longer time scale atomic mo-tion and thus nanoscale plasticity.
This project is partially supported by the British Council.
*Electronic address: [email protected] [1] M. Guggisberg, M. Bammerlin, C. Loppacher, O. Pfeiffer,
A. Abdurixit, V. Barwich, R. Bennewitz, A. Baratoff,
E. Meyer, and H.-J. Güntherodt, Phys. Rev. B 61,11 151
(2000).
[2] P. M. Hoffmann, A. Oral, R. A. Grimble, H. Ö. Özer,
S. Jeffery, and J. B. Pethica, Proc. R. Soc. London A 457,
1161 (2001).
[3] B. Gotsmann, C. Seidel, B. Anczykowski, and H. Fuchs,
Phys. Rev. B 60,11 051 (1999).
[4] C. Loppacher, R. Bennewitz, O. Pfeiffer, M. Guggisberg, M. Bammerlin, S. Schär, V. Barwich, A. Baratoff, and
E. Meyer, Phys. Rev. B 62,13 674 (2000).
[5] B. Gotsmann and H. Fuchs, Phys. Rev. Lett. 86, 2597
(2001).
[6] M. Gauthier and M. Tsukada, Phys. Rev. B 60, 11 716
(1999).
[7] I. Dorofeyev, H. Fuchs, G. Wenning, and B. Gotsmann,
Phys. Rev. Lett. 83,2402 (1999).
[8] B. N. J. Persson and A. I. Volokitin, Phys. Rev. Lett. 84,
3504 (2000).
[9] M. Gauthier and M. Tsukada, Phys. Rev. Lett. 85, 5348
(2000).
[10] H. Hölscher, U. D. Schwarz, and R. Wiesendanger, Appl.
Surf. Sci. 140, 344 (1999).
[11] B. Anczykowski, B. Gotsmann, H. Fuchs, J. Cleveland, and
V. B. Elings, Appl. Surf. Sci. 140,376 (1999).
[12] L. N. Kantorovich, J. Phys. Condens. Matter 13, 945
(2001).
[13] K. W. Andrews, Physical Metallurgy — Techniques and
Applications (George Allen & Unwin, London, 1973),
Vol. 2.
[14] S. Molitor, P. Güthner, and T. Berghaus, Appl. Surf. Sci.
140, 276 (1999).
[15] R. Bennewitz, A. S. Foster, L. N. Kantorovich, M. Bammerlin, C. Loppacher, S. Schär, M. Guggisberg,
E. Meyer, and A. L. Shluger, Phys. Rev. B 62, 2074
(2000).
[16] J. B. Pethica and A. P. Sutton, in Forces in Scanning Probe
Methods, edited by H.-J. Güntherodt, D. Anselmetti, and
E. Meyer (Kluwer Academic Publishers, Dordrecht, 1995),
NATO ASI, Ser. E, Vol. 286,pp. 353– 366.
265502-4 265502-4
View publication stats View publication stats