Hydraulic Simulation of Rainfall-Runoff Process in Kamanaj
Watershed Using Diffusive Model
Sabereh DARBANDİ1 Ahmad Fakheri FARD 1 Ali Hosseinzadeh DALIR 1
Seyeed Ali SADRADDIN İl Davood Farsady ZADEH 1
Received Date: 19.11.2007 Accepted Date: 24.06.2008
Abstract: In this research the transformation of rainfall into runoff was simulated using two dimensional SV equations in the Kamanaj watershed, a subwatershed of Ajichay river, located in East Azarbaijan Province, Iran. Rainfall-runoff was simulated based on a diffusive model by considering momentary infiltration rate for temporal and spatial analysis. SV equations were solved using explicit method of finite difference numerical technique as the initial and boundary conditions were defined. For this purpose, the watershed area was divided into a grid size of 250mx250m by the tools of GIS leading to prepare digital elevation map. Kostiokov infiltration, as the best fitted model, was selected to measure infiltration data and applied in SV equations. Three hydrographs were used to verify the model. Comparison of the simulated and observed hydrographs verificated the capability of model in simulating the rainfall-runoff. The presented model can be used for determination of runoff from momentary rainfall with consideration of temporal and spatial variation of infiltration over the watersheds.This model can also be used to forcast the peak discharge and time to peak in watershed outlet. Key Words: Diffusive model, Rainfall-runoff, SV equations
Kamanaj Havzas
ı
nda Ya
ğış
lara Ba
ğ
l
ı
Yüzey Ak
ışı
Olu
ş
umunun Da
ğı
lma
Modeli Yard
ı
m
ı
yla Hidrolik Simülasyonu
Öz: Bu çalışmada, İran'ın Doğu Azerbaycan Bölgesinde bulunan Ajichay nehrinin bir alt havzası olan Kamanaj havzasında, iki boyutlu SV eşitlikleri kullanılarak yağışların yüzey akışına dönüşmesi simüle edilmiştir. Zaman ve mekan analizleri için yağış-yüzey akışı infiltrasyon oranlarının dikkate alınmasıyla simüle edilmiştir. SV eşitlikleri, Kesin Fark Numerik metodu ile başlangıç ve sınır koşulları saptanarak çözülmüştür. Bu amaçla, havza alanı GIS araçları yardımı ile sayısal yükseklik haritaları elde etmek amacıyla 250x250 metrekararelere bölünmüştür. İnfiltrasyon verilerini ölçmek için, en iyi uyum gösteren model olan Kostiokov infiltrasyon sistemi seçilmiş ve SV eşitlikleri uygulanmıştır. Modeli doğrulamak amacıyla, üç hidrografik kullanılmıştır. Simüle edilen ve gözlenen hidrografikler, yağış-yüzeyakışı simülasyon modelinin etkinliğini doğrulamıştır. Sunulan bu model, anlık yağışlardan oluşan yüzey akışının belirlenmesinde, havzadaki infiltrasyonun zamansal ve mekansal değişimine dikkat edilerek kullanılabilir. Bu model aynı zamanda, havzadaki boşaltımın tepe noktasını ve boşaltımın en fazla olduğu zamanı tahmin etmede kullanılabilir.
Anahtar Kelimeler: Dağılma modeli, yağış yüzeyakışı, sv eşitlikleri
Introduction
Rainfall-runoff transformation in watersheds is an important inter-dependent component of the hydrologic cycle (Saghafian et al. 2000). The response of a watershed to rainfall is observed as the runoff at the watershed outlet (Kull and Feldman 1998). While a major portion of rainfall is lost due to infiltration, the excess rainfall accumulates and generates surface runoff in overland areas (Chow et al.1988). A main consideration of hydrology is to determine the rainfall-runoff relationship over a watershed (Tarboton 2000). Hydrological models have been developed to improve
our understanding of surface runoff generated from complex watersheds. A variety of surface runoff models are commonly classified as either lumped or distributed parameter models (Jorgeson and Julien 2005). Lumped-parameter models integrate watershed characteristics over a giyen area, neglecting heterogenity and thus resulting in simplifıed runoff conditions. A concern regarding lumped-parameter models is the difficulty in obtaining a single representative value of a spatially variable parameter that would lead to an accurate prediction of the mean watershed response.
211 DARBANDİ, S., A.F.FARD, A.H.DALİR, S.A.SADRADDİNİ and D.F. ZADEH, "Hydraulic simulation of rainfall-runoff
process in Kamanaj watershed using diffusive model"
Distributed-parameter models were developed to represent the variability in physical watershed characteristics. The use of distributed models is complicated by the need to establish an appropriate spatial scale to be used in characterizing watershed conditions such as topography, drainage density, degree of soil saturation, gemorphology, and rainfall properties (Molnar and Julien 2000). The flow routing process can be simulated by tracking the rainfall excess from cell to cell to the watersheds outlet (Hjelmfelt 1978). The classification of river waves as gravity, diffusive or kinematic waves, is corrsponding to different forms of momentum equation in the saint-venant system (Moussa and Bocquillon 2000). The river waves models can be derived based on the SV continuity and momentum equations (Brouner 1992). Ponce (1989) developed a criterion for the applicability of kinematic waves in surface runoff.
The aim of this study is to transform rainfall into runoff with presence of infiltration using two dimensional SV equations in Kamanaj watershed.
Material and Methods
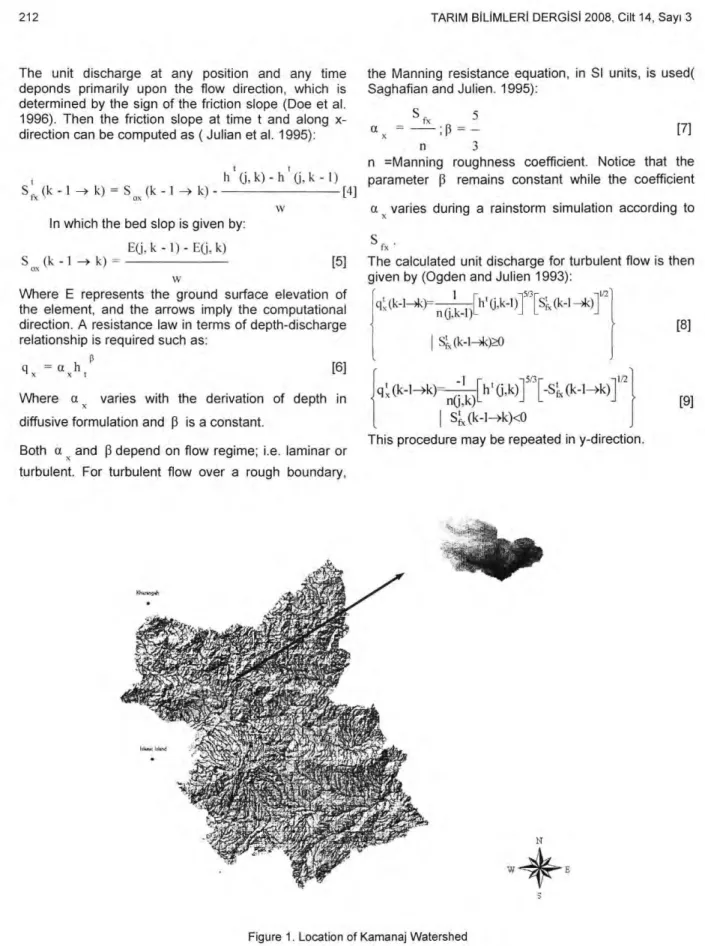
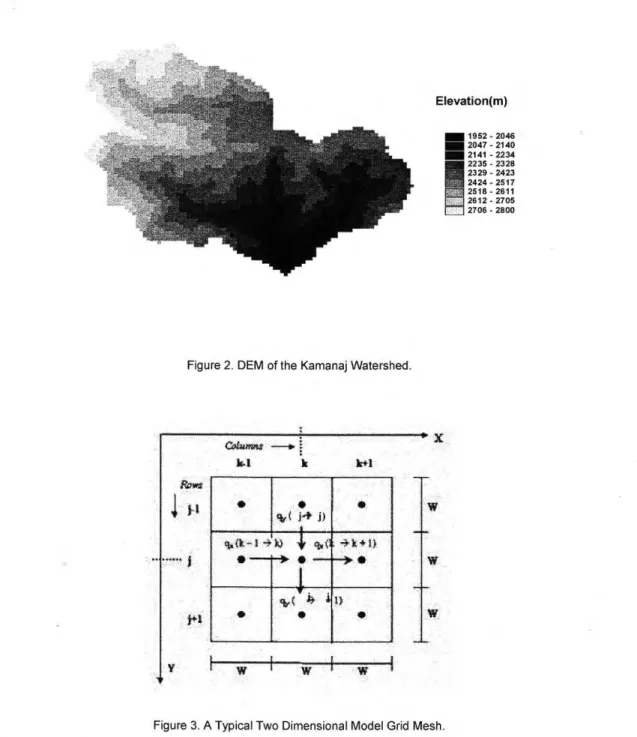
Study area and data: The study area, experimental watershed Kamanaj, is a steep sub-basin of Ajichay river, located in East Azarbaijan Province, Iran (Figure 1).The watershed area is 26 km 2 and the elevation range from 1952 to 2800m above the mean sea Ievel.The region has a typical semi-arid climate, with poor vegetation.The mean annual precipitation is about 501 mm with most of the rainfall occuring between April and June as well as between the November and March in the form of snow. There is only one rainfall gauging station located in the middle of watershed which the rainfall data of it is considered to be the rainfall data over the watershed area as the area is small.The fiood hydrographs are measured in the stream gauging station located in outlet of watershed. A totol of 4 isolated storms with observed runoff responses were selected for calibration and validation of two dimensional SV model. The digital contour data with a scale of 1:25000 are used to obtain the digital elevation model of the area (Figure 2). In this research watershed area divided into a grid size of 250mx250m by the tools of GIS. In order to simulate rainfall-runoff, SV diffusive model, was applied considering Kostiokov infiltration equation.
Overland Flow: The SV continuity and momentum equations describe the physics of gradually-varied overland flow.The two-dimensional
continuity equation in partial differential form is (Ogden and Julien 1993):
ah aq
aq
—+ x + — [1]
at
ax
ayWhere:
h : surface flow depth
q x : unit discharge in x-direction q y : unit discharge in y-direction
: excess rainfall equal to (i-f) i : rainfall intensity
f : infiltration rate
x and y : rectangular coordinates t : time
Application of a first order approximation to the continuity equation for element (j,k) results in (Figure. 3): t+z t h (j, k) =h (j, k) + reA -
ğ
x
(k —>k+1)- q (k-1—>k) q Y (j --->j +1) - q y (jWhere h t+At(j, k) and Iş (j, k) denote flow depths at element (j,k) at time t + At and t, respectively; r e is the average excess rainfall rate over one time step beginning from time t; q t (k —> k + 1) and q (k - 1 —> k) describe unit flow rates in x-direction at time t, from a,k) to (j,k+1), and from (j,k-1) to (j,k),
t t
consecutively; likewise q y (j - j + 1) , q y - 1 -* j) denote unite flow rates in y-direction at time t, from (j,k) to (j+1,k), and from (j-1,k) to a,k), respectively; and
w stands for grid size.
The diffusive wave approximation of the momentum equation in the x-direction is (Ogden and Julien 1993):
ah
S fx = S ox [3]
ax
Where:
S fx : friction slop in x-direction
S : land surface slop in x-direction.
The unit discharge at any position and any time deponds primarily upon the flow direction, which is determined by the sign of the friction slope (Doe et al. 1996). Then the friction slope at time t and along x-direction can be computed as ( Julian et al. 1995):
t (j,k)-h t
h (İ,k -1)
S fx (k - 1 —> k) = S ox (k - 1 —> k) [4]
w In which the bed slop is giyen by:
E(j. k - 1) - E(j, k)
S ox (k -1 —> k) — [5]
Where E represents the ground surface elevation of the element, and the arrows imply the computational direction. A resistance law in terms of depth-discharge relationship is required such as:
q x = a x lıt P [6]
Where a varies with the derivation of depth in
diffusive formulation and /3 is a constant.
Both o x and 13 depend on flow regime; i.e. laminar or turbulent. For turbulent flow over a rough boundary,
the Manning resistance equation, in SI units, is used( Saghafian and Julien. 1995):
5
; = — [7]
n
3n =Manning roughness coefficient. Notice that the parameter [3 remains constant while the coefficient a x varies during a rainstorm simulation according to
S
fx
The calculated unit discharge for turbulent flow is then giyen by (Ogden and Julien 1993):
ci tx(k-1—>k)= . [ht (j,k-1)1s ıs [S„, (k-1—>k) 112 n(jk1)
st,o(-1-~o
{q;,(k-1-->k)— n(1 :I, k) [ht (j,k)1 5/3 [-Stfx (k-1—>k)11 /2 I St (k-1—>k)<0This procedure may be repeated in y-direction.
S fx
[8]
[9]
11› 4i( ,i 4 ,i)
-,4„tk-: .4),) 1"----cb,( -3,k+1,)
•
DARBANDİ, S., A.F.FARD, A.H.DALİR, S.A.SADRADDİNİ and D.F. ZADEH, "Hydraulic simulation of rainfall-runoff 213 process in Kamanaj watershed using diffusive model"
Elevation(m) mi 1952 - 2046 2047 - 2140 EM 2141- 2234
11
2235 - 2328 2329 - 2423 2424 - 2517 2518 - 2611 2612 - 2705 2706 - 2800Figure 2. DEM of the Kamanaj Watershed.
Figure 3. A Typical Two Dimensional Model Grid Mesh.
Method of Infiltration Measurement
Double ring method has been used to determine infiltration rates, cumulative infiltrations and coefficients of infiltration models (Green-Ampt, Philip, Kostiokov, Modifıed Kostiokov and Horton).
Among the various infiltration models examined
the Kostiakov model showed best fıt to the
experimantal data. The Kostiokov equation is:
b-1
Where:
i (t): infiltration rate
t: time from comencement infiltration a, b : experimenta I coefficient
Results and Discussion:
Variation of infiltration rate was derived from fifteen field data. Iso Parameter curves of a, b are shown in Figure 4,5.
The physically-based distributed nature of two dimensional SV equations makes it a suitable modeling tool to carry out fundamental research on spatially-varied systems.
Roughness coefficient is the most important parameter of the Manning's equation. The Manning roughness coefficient was used as the sole calibration parameter of the overland flow routing on Kamanaj watershed. A mean spatially uniform value of Manning n for overland flow equal to 0.02 was used. The successful application of rainfall-runoff model depends on how well it is calibrated.The model was calibrated using observed rainfall data and related flood event that occurred in May 2003.
Figure 4. Iso Parameter curve of a.
Characteristics of four rainfall-runoff events which were selected for analysis were giyen in Table 1.
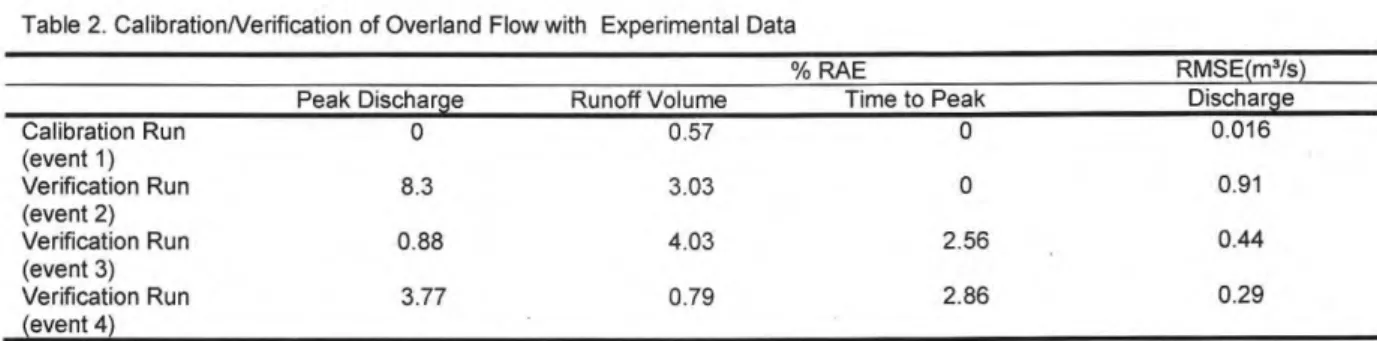
The objective of the calibration was to minimize the difference between simulated and observed discharges, with the intent of reproducing as closely as possible the peak discharge, the time to peak and the
total volume. For this particular calibration run the event of May 29, 2003 (event 1) was selected. The validation runs shown in Figure 6 produced fairly good agreement between simulated and observed peak discharge rates and time to peak at the outlet. Results from these calibration/verifications are shown in Table 2 which supports the validity of the formulation.
Figure 5. Iso Parameter curve of b.
The minimum relative average errors (RAE) of verification are 0.88, 0.79 and 0 percent for peak discharge, runoff volume and time to peak, respectively. Meanwhile maximum RAE are 8.3, 4.03 and 2.86 percent. The minimum root mean square of error (RMSE) of verification is 0.29 m 3/s for discharge.
Julian et al.( 1995) calibrated magnitude of the peak discharge and supported the validity of the formulation. The average verification errors were 3 and 4.5 percent for the peak discharge and time to peak, while the average absolute values of the verification errors were 4.4 and 4.5 percent.
The average calibration error on the runoff volume was 6.5 percent, while on the verification data sets it was 4.9 percent.
Johnson et al. (2000) calculated surface runoff using the diffusive wave approximation to the SV equations in two-dimensions.The computed runoff volume was approximately 15 percent lower than the observed runoff volume, and the computed peak flow was between 10 to 20 percent across the watershed.
Table 1. Rainfall events used for calibration (event 1) and validation (event 2, 3, and 4 )
Rainfall event Event 1 Event 2 Event 3 Event 4
29-May-2003 11-June-2003 3-May-2005 18-May-2005
Rainfall duration[hr] 0.4 1.25 1.75 1.5
Mean rainfall intensity [mm/hr] 7.19 21.01 9.34 7.85
Disc
harg
e(m
^3
/s)
DARBANDİ, S., A.F.FARD, A.H.DALİR, S.A.SADRADDİNİ and D.F. ZADEH, "Hydraulic simulation of rainfall-runoff 215 process in Kamanaj watershed using diffusive model"
Table 2. Calibration/Verification of Overland Flow with Experimental Data
RA E RMSE(m3/s)
Peak Discharge Runoff Volume Time to Peak Discharge Calibration Run (event 1) 0 0.57 0 0.016 Verification Run (event 2) 8.3 3.03 0 0.91 Verification Run (event 3) 0.88 4.03 2.56 0.44 Verification Run (event 4) 3.77 0.79 2.86 0.29
The resulted discharges from the two dimensional simulations are compared with observed data.The two dimensional SV equations were able to reproduce the peak flow from this validation event matching both the peak runoff and time to peak extremely well.The simulated hydrographs were also fairly representative of the observed values.
Analysis on Kamanaj watershed showed that two dimensional SV equations can be used in simulating observed peak discharge and time to peak at the outlet.
Reffering to Table 2 there are some discrepances between simulated and observed values.
This may be due to the fact that as cell size decrease down to an optimum cell size the corressponding relative average errors between observed and simulated values also decrease.
Infiltration measurment maybe another source of error in simulating process because of soil moisture variation on watershed surface.
In this model evaporation losses were not considered over the watershed surface.
• Observed - Simulated 40 30 20 10 0 Event 2 Event 3 • Disc harg e(m ^3/s) Disc ha rg e( m ^ 3/s) 3 7 11 Time(hr) 15 2 4 6 8 10 12 14 16 Time(hr) Event 4 8 12 16 20 24 Time(hr)
Acknowledgements
The authors wish to sincerely thank Dr Mustafa ÇANGA and other anonymous reviewers whose comments greatly improved the quality of this paper.
References
Brouner, I. H.1992. Subsurface water. ITC Postgradute Course in Water Resources .
Chow, V.T., D.R. Maidment and L.W. Mays. 1988 . Applied hydrology. Mc Graw Hill , International Editions. Doe, W.W., B. Saghafian and P.Y. Julien. 1996. Land-use
impact on watershed response: The integration of two-dimensional hydrological and geographical information systems. Hydrological Processes 10: 1503-1511. Hjelmfelt, A.T.1978. Influence of infıltration on overland flow.
Journal of Hydrology 36: 179-185.
Julien, P.Y., B. Saghafian and F.L. Ogden. 1995. Raster-Based hydrological modeling of spatially- varied surface. Water Resources Bulletin 31(3): 523-536. Johnson, B.E. et al. 2000 . The two-dimensional upland
erosion model Casc2d :-Sed. Journal of American Water Resources Association 36 (1): 31-42.
Jorgeson, J. and P.Y. Julien. 2005. Peak flow forecasting with radar precipitation and distrbuted model casc2d. International Water Resources Association 30 (1): 40- 49.
Kull, D.W. and A.D. Feldman. 1998. Evaluation of clark's unit graph method to spatially distributed runoff. Journal of Hydrology Engineering 3 (1): 9-19.
Moussa, R and C. Bocquillon. 2000 . Approximation zones of the Saint-Venant equations for flood routing with overbank flow. Hydrology and Earth System Sciences 4 (2): 251-261
Molnar, D.K. and P.Y. Julien. 2000. Grid-Size effects on surface runoff modeling. Journal of Hydrologic Engineering 5 (1).
Ogden, P.L. and P.Y. Julien. 1993. Runoff sensivity to temporal and spatial rainfall variability at runoff plane and small basin scales. Water Resources Research 29 (8): 2589-2597.
Ponce, V.M. 1989. Engineering hydrology, Principle and Practice, Printice Hall.
Saghafian, B., P.Y. Julien and H.M. Rajaie. 2000. A spatial travel-time method for watershed routing. 4 rn International Conference on Integrating GIS and Environmental Modeling (GIS/EM4): Problems, Prospects and Research Needs ,september 2-8, Banff, Alberta, Canada.
Saghafian, B. and P.Y. Julien.1995. Time to equilibrium for spatially variable watersheds. Journal of Hydrology 172: 231-293.
Tarboton, D.C. 2000. Watershed and stream network delineation. University of Padua.
Communication Address:
Sabereh Darbandi
Water Engineering Department
Faculty of Agriculture Tabriz University - Iran E-mail: [email protected]