Tarım Bilimleri Dergisi
Tar. Bil. Der.Dergi web sayfası:
www.agri.ankara.edu.tr/dergi
Journal of Agricultural Sciences
Journal homepage:
www.agri.ankara.edu.tr/journal
TARIM BİLİMLERİ DERGİSİ
—
JOURNAL OF AGRICUL
TURAL SCIENCES
20 (2014) 415-426
Mathematical Modelling of Convection Drying Characteristics of
Artichoke (Cynara scolymus L.) Leaves
Tuncay GÜNHANa, Vedat DEMİRa, Abdülkadir YAĞCIOĞLUa
aEge University, Faculty of Agriculture, Department of Agricultural Machinery, 35100, Bornova, Izmir, TURKEY ARTICLE INFO
Research Article
Corresponding Author: Tuncay GÜNHAN, E-mail: [email protected], Tel: +90 (232) 311 26 62 Received: 11 February 2014, Received in Revised Form: 17 March 2014, Accepted: 18 March 2014
ABSTRACT
This paper presents the results of a study on mathematical modelling of convection drying of artichoke (Cynara scolymus L.) leaves. Artichoke leaves used for drying experiments were picked from the agricultural faculty experimentation fields on the campus area of Ege University. Chopped artichoke leaves were then used in the drying experiments performed in the laboratory at different air temperatures (40, 50, 60 and 70 °C) and airflow velocities (0.6, 0.9 and 1.2 m s-1)
at constant relative humidity of 15±2%. Drying of artichoke leaves down to 10% wet based moisture content at air temperatures of 40, 50, 60 and 70 °C lasted about 4.08, 2.29, 1.32 and 0.98 h respectively at a constant drying air velocity of 0.6 m s-1 while drying at an air velocity of 0.9 ms-1 took about 3.83, 1.60, 0.96 and 0.75 h. Increasing the drying air
velocity up to 1.2 m s-1 at air temperatures of 40, 50, 60 and 70 °C reduced the drying time down to 3.5, 1.54, 1.04 and
0.71 h respectively. Different mathematical drying models published in the literature were used to compare based on the coefficient of multiple determination (R2), root mean square error (RMSE), reduced chi-square (χ2) and relative deviation
modulus (P). From the study conducted, it was concluded that the Midilli et al drying model could satisfactorily explain convection drying of artichoke (Cynara scolymus L.) leaves under the conditions studied.
Keywords: Drying; Artichoke; Modelling
Enginar Yapraklarının (Cynara scolymus L.) Konveksiyonel Kuruma
Karakteristiklerinin Matematiksel Modellenmesi
ESER BİLGİSİ Araştırma Makalesi
Sorumlu Yazar: Tuncay GÜNHAN, E-posta: [email protected], Tel: +90 (232) 311 26 62 Geliş Tarihi: 11 Şubat 2014, Düzeltmelerin Gelişi: 17 Mart 2014, Kabul: 18 Mart 2014
ÖZET
Bu çalışmada enginar yapraklarının (Cynara scolymus L.) konveksiyonel kuruma karakteristiklerinin matematiksel modellenmesi sunulmuştur. Denemelerde kullanılan enginar yaprakları Ege Üniversitesi yerleşke alanı içerisindeki Ziraat Fakültesi deneme parsellerinden toplanmıştır. Doğranmış enginar yaprakları, laboratuvarda çeşitli sıcaklıklarda (40, 50, 60 ve 70 °C) ve hava hızlarında (0.6, 0.9 ve 1.2 m s-1) sabit bağıl nem değerinde (% 15±2) kurutma denemelerinde
1. Introduction
The artichoke (Cynara scolymus L.) is a perennial
vegetable that has a great production potential
in Europe and in the continent of America and it
received a great acceptance for the consumption in
recent years in Turkey. Italy, Egypt, Spain, Peru and
Argentina are the biggest artichoke producers in the
World respectively while Turkey is ranked the 13
thone and the production area of artichoke shows an
increasing trend in Turkey
(FAO 2013).
Among the public, artichoke leaves are known
to be useful in eliminating hepatitis and disorders
related to hyperlipidemia. Artichoke leaf is also
known as an herbal medicine for a long time
and used for the treatment of hyperlipidemia and
hepatitis in EU traditional folk medicine. Different
studies about artichoke have demonstrated their
health-protective potential. The artichoke leaves
are characterized by the composition and high
content in bitter phenolic acids, whose choleretic,
hypocholerestemic and hepatoprotector activities
are attributed (Alonso et al 2006). Antioxidant,
hepatoprotective, anti-HIV, choleretic and
inhibiting cholesterol biosynthesis activities of
artichoke extracts are also reported by Zhu et al
(2005). Shimoda et al (2003) reported that the
methanolic extract of artichoke suppress the serum
triglyceride in mice. Zhu et al (2005) reported
that the artichoke leaves have a new potential
application in the treatment of fungal infections.
The composition of phytochemicals in artichoke
leaves were well documented in the literature and
medicinal values of artichoke leaves were found
higher than flowers (Sanchez-Rabaneda et al
2003; Bundy et al 2008). Moreover, anti-oxidant,
hepatoprotective, lowering blood cholesterol
effects were mostly studied in the literature.
Wang et al (2003) used three different
artichoke varieties in order to determine the
phenolic acid components. They dried the
artichoke leaves and tissues in an oven at 70
°C and also in a freeze drier. After the drying,
samples were kept in air tight bags at room
temperatures for further analysis. Researchers
determined the phenolic acid compounds and
amounts by HPLC analysis for mature leaves,
young and mature artichoke heads. According
to the results obtained by Wang et al (2003) it
was reported that the leaves have highest total
phenols content than young artichoke heads as
followed by mature artichoke heads. In terms of
the method they used, they concluded that freeze
drying and air assisted drying did not affect the
amount of phenolic acid in artichoke.
Fresh food materials cannot be stored for a
long time. Therefore, products must be dried for
a long-term storage. One of the most traditional
and extensive technique used for the production
of dehydrated fruits and vegetables is convection
drying (Nicoleti et al 2001). It allows to reduce
mass and volume, to store the products under
ambient temperature and to minimize packaging,
transportation and storage cost (Baysal et al
2003).
Mathematical modelling in drying studies is one
of the most significant step in drying technology and
allows engineers to select the most suitable drying
kullanılmıştır. Enginar yapraklarının 40, 50, 60 ve 70 °C sıcaklıklarda % 10 nem içeriğine (yb) ulaşmaları 0.6 m s-1 sabit
hava hızında sırasıyla yaklaşık olarak 4.08, 2.29, 1.32 ve 0.98 h sürerken, 0.9 m s-1 sabit hava hızında yaklaşık olarak
3.83, 1.60, 0.96 ve 0.75 h sürmüştür. 40, 50, 60 ve 70 °C sıcaklıklarda kurutma havası hızını 1.2 m s-1’ye kadar artırmak
kuruma süresini sırasıyla 3.5, 1.54, 1.04 ve 0.71 h’e kadar düşürmüştür. Literatürde yer alan çeşitli kuruma modelleri, belirtme katsayısı (R2), ortalama hata kareleri karekökü (RMSE), khi-kare (χ2) ve mutlak bağıl hata (P) değerleri
kullanılarak karşılaştırılmıştır. Yapılan çalışma sonunda denemelerin yapıldığı koşullar altında enginar yapraklarının kurumasını en iyi Midilli vd. kuruma modelinin açıkladığı belirlenmiştir.
Anahtar Kelimeler: Kurutma; Enginar; Modelleme
Enginar Yapraklarının (Cynara scolymus L.) Konveksiyonel Kuruma Karakteristiklerinin Matematiksel Modellenmesi, Günhan et al
Ta r ı m B i l i m l e r i D e r g i s i – J o u r n a l o f A g r i c u l t u r a l S c i e n c e s 20 (2014) 415-426
417
conditions and to form a drying equipment at a
proper scale (Strumillo & Kudra 1986; Hawlader et
al 1997).
Scientific studies on the drying process of
artichoke leaves in the literature is very limited and
the most of them focused on determination of the
chemical components of artichoke leaves and there
is no study published on the determination of the
drying characteristics of the artichoke leaves.
The aim of the study was to determine the drying
characteristics and to develop a mathematical model
for predicting the kinetics of convection drying of
artichoke leaves.
2. Material and Methods
2.1. Experimental procedures
Drying experiments were performed in a laboratory
scale convective hot air dryer constructed in the
Department of Agricultural Machinery, Faculty
of Agriculture, Ege University, Izmir, Turkey.
A schematic diagram of the laboratory dryer is
illustrated in Figure 1. The drying system used in
this study has been described in details by Demir et
al (2007). The laboratory dryer includes; fan, cooler,
heater, humidifier, drying unit and automatic control
unit.
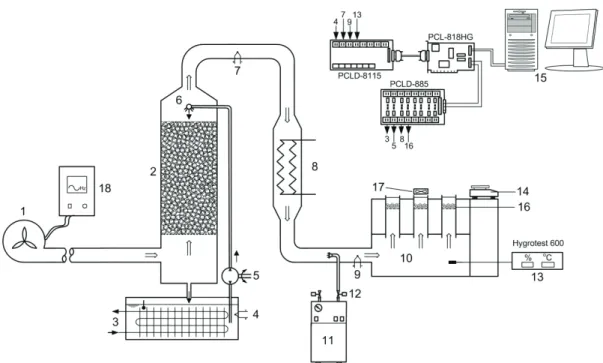
Figure 1- Schematic diagram of the drying unit: 1, centrifugal fan; 2, cooling and condensing tower; 3, cold water tank and evaporator; 4,7,9, thermocouples (type T); 5, circulation pump; 6, cold water shower; 8, electric heaters; 10, mixing chamber and air channels; 11, steam tank; 12, solenoid valve; 13, temperature & humidity sensor; 14, balance; 15, computer with data acquisition and control cards; 16, artichoke leaves; 17, anemometer; 18, frequency converter
Şekil 1- Kurutma ünitesinin şematik çizimi; 1, santrifüj fan; 2, soğutma ve yoğuşturma kulesi; 3, soğuk su tankı ve evaparatör; 4,7,9, termokupl (T tipi); 5, sirkülasyon pompası; 6, soğuk su duşu; 8, elektrikli ısıtıcı; 10, karışım odası ve hava kanalları; 11, buhar tankı; 12, solenoid valf; 13, sıcaklık ve nem sensörü; 14, terazi; 15, veri akış ve kontrol kartlı bilgisayar; 16, enginar yaprakları; 17, anemometre; 18, frekans dönüştürücü
A personal computer equipped with A/D
converters cards and data acquisition & control
software called VisiDAQ (Advantech Automation
Corp., USA) was used to control the drying
temperature, relative humidity and the automation
of the drying system.
The artichoke leaves for the drying experiments
were picked from the middle branches of the
artichoke plants as they are located on the campus
area of Ege University, between 8:30 and 9:00
a.m. During the experiments, the fresh leaves were
collected daily in early-morning and unblemished
ones were picked and used in the drying experiments.
Some preliminary tests were carried out to
examine the drying conditions from the point of
test stand and some expected changes in artichoke
leaves. In these tests, a homogeneous drying of the
whole leaves was not obtained, especially the main
vein of the leaves was found to be the last part that
dried. In this situation, the tissues in the thinner
part of the leaves were subjected to over drying and
drying time significantly increased. For this reason,
the leaves were divided into two parts along the
main vein and then sliced perpendicularly to the
main vein. The 4 or 5 mm wide slices were then
used for the drying process.
The experiments conducted in the lab had the
objective to determine the effect of air temperature
and drying airflow velocity on the drying constant
were achieved at temperatures of 40, 50, 60 and
70 °C, and at velocity of 0.6, 0.9 and 1.2 m s
-1respectively. During the experiments, the relative
humidity was maintained at 15 ± 2%. The drying
system was run for at least one hour to maintain
steady-state conditions before the experiments.
Each drying experiment was performed with 20
g of leaves after steady state conditions of both
temperature and air velocity was achieved in
the dryer. The artichoke leaves were placed in a
vertical drying channel equipped with fine sieves
and weighed every three minutes in the first 15
minute drying process and then every 5 minutes
until the drying process is completed. The drying
experiments were ended when the mass of the
samples does not change.
The leaf samples were kept in an air-circulated
oven for 24 hours at 105 ±2 °C in order to determine
the initial moisture content. All of these experiments
mentioned above were triplicated.
2.2. Mathematical modelling of the drying curves
The experimental moisture ratio data of artichoke
leaves were fitted to semi-empirical models in Table
1 to define the convection drying kinetics. The
models in Table 1 were widely employed to describe
the convection drying kinetics of vegetables.
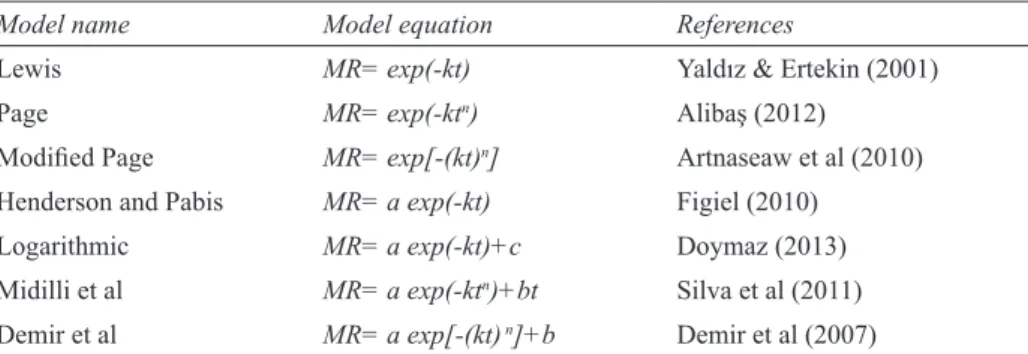
Table 1- Mathematical models widely used to describe the convection drying kineticsÇizelge 1- Konveksiyonla kuruma kinetiklerini belirlemede yaygın olarak kullanılan matematiksel modeler
Model name Model equation References
Lewis MR= exp(-kt) Yaldız & Ertekin (2001)
Page MR= exp(-ktn) Alibaş (2012)
Modified Page MR= exp[-(kt)n] Artnaseaw et al (2010)
Henderson and Pabis MR= a exp(-kt) Figiel (2010)
Logarithmic MR= a exp(-kt)+c Doymaz (2013)
Midilli et al MR= a exp(-ktn)+bt Silva et al (2011)
Demir et al MR= a exp[-(kt) n]+b Demir et al (2007)
MR, moisture ratio; a, b, c coefficients; n, drying exponent specific to each equation; k, drying coefficients specific to each equation; t, time
Enginar Yapraklarının (Cynara scolymus L.) Konveksiyonel Kuruma Karakteristiklerinin Matematiksel Modellenmesi, Günhan et al
Ta r ı m B i l i m l e r i D e r g i s i – J o u r n a l o f A g r i c u l t u r a l S c i e n c e s 20 (2014) 415-426
419
The left hand side of the equations is a
dimensionless number known as moisture ratio MR
and it could be written as follows:
4
The leave samples were kept in an air-circulated oven for 24 hours at 105 ±2 C in order to determine the initial moisture content. All of theseexperiments mentioned above were triplicated.2.2. Mathematical modelling of the drying curves
The experimental moisture ratio data of artichoke leaves were fitted tosemi-empirical models in Table 1 to define the convection drying kinetics. The models in Table 1 were widely employed to describe the convection drying kinetics of vegetables.
Table 1- Mathematical models widely used to describe the convection drying kinetics
Çizelge 1- Konveksiyonlakurumakinetiklerinibelirlemedeyaygınolarakkullanılanmatematiksel modeler
Model name Model equation References
Lewis MR= exp(-kt) Yaldız&Ertekin (2001)
Page MR= exp(-ktn) Alibaş (2012)
Modified Page MR= exp[-(kt)n] Artnaseaw et al (2010)
Henderson and Pabis MR= a exp(-kt) Figiel (2010)
Logarithmic MR= a exp(-kt)+c Doymaz (2013)
Midilli et al MR= a exp(-ktn)+bt Silva et al (2011)
Demir et al MR= a exp[-(kt) n]+b Demir et al (2007)
MR, moisture ratio; a, b, c coefficients; n, drying exponent specific to each equation; k, drying coefficients specific to each equation;
t, time
The left hand side of the equations is a dimensionless number known as moisture ratio MRand it could be written as follows: e e t
M
M
M
M
MR
-0
(1) o tM
M
MR
(2)MS Excel software was used for the calculation of the drying constants and coefficients of semi-empirical drying models in Table 1. The coefficient of multiple determination(R2) was considered as the main criteria for selecting the best model to obtain the convection drying curves of artichoke leaves. Besides the R2, some other statistical testswere achieved in order to evaluate how the developed models fit to the data obtained from the experiments. Among these, root mean square error(RMSE)and reduced chi-square (2)have a common use in drying related studies (Krokida et al 2002; Yaldiz&Ertekin 2001;Midilli&Kucuk 2003; Akgun&Doymaz 2005).In addition to these methods, mean relative deviation modulus (P) value was also used to evaluate the goodness of fit of the models (Sacilik&Elicin 2006; Özdemir&Devres 1999). These test functions used to determine the best fit are given below:
∑
1 21
N i pre,i exp,i)
MR
(MR
N
RMSE
(3) 1 1 2 2∑
-n
-N
)
MR
(MR
χ
N i exp,i pre,i
(4)∑
-100
i exp, i pre, i exp,MR
MR
MR
N
P
(5)Thebetter goodness of the fit means that the value of R2should be higher whilethe value of RMSE, 2and P should be lower. Selection of the best suitable drying model was done using this criteria.The
(1)
The moisture ratio was calculated using equation
(1), which was simplified to equation (2) by some
investigators (Menges & Ertekin, 2006; Midilli
& Kucuk 2003; Sacilik & Elicin 2006; Togrul &
Pehlivan 2003; Yaldiz et al 2001) because of the
M
eis relatively small when compared to M
0and the
deviation of the relative humidity of the drying air
during the processes.
4
The leave samples were kept in an air-circulated oven for 24 hours at 105 ±2 C in order to determine the initial moisture content. All of theseexperiments mentioned above were triplicated.2.2. Mathematical modelling of the drying curves
The experimental moisture ratio data of artichoke leaves were fitted tosemi-empirical models in Table 1 to define the convection drying kinetics. The models in Table 1 were widely employed to describe the convection drying kinetics of vegetables.
Table 1- Mathematical models widely used to describe the convection drying kinetics
Çizelge 1- Konveksiyonlakurumakinetiklerinibelirlemedeyaygınolarakkullanılanmatematiksel modeler
Model name Model equation References
Lewis MR= exp(-kt) Yaldız&Ertekin (2001)
Page MR= exp(-ktn) Alibaş (2012)
Modified Page MR= exp[-(kt)n] Artnaseaw et al (2010)
Henderson and Pabis MR= a exp(-kt) Figiel (2010)
Logarithmic MR= a exp(-kt)+c Doymaz (2013)
Midilli et al MR= a exp(-ktn)+bt Silva et al (2011)
Demir et al MR= a exp[-(kt) n]+b Demir et al (2007)
MR, moisture ratio; a, b, c coefficients; n, drying exponent specific to each equation; k, drying coefficients specific to each equation;
t, time
The left hand side of the equations is a dimensionless number known as moisture ratio MRand it could be written as follows: e e t
M
M
M
M
MR
-0
(1) o tM
M
MR
(2)MS Excel software was used for the calculation of the drying constants and coefficients of semi-empirical drying models in Table 1. The coefficient of multiple determination(R2) was considered as the main criteria for selecting the best model to obtain the convection drying curves of artichoke leaves. Besides the R2, some other statistical testswere achieved in order to evaluate how the developed models fit to the data obtained from the experiments. Among these, root mean square error(RMSE)and reduced chi-square (2)have a common use in drying related studies (Krokida et al 2002; Yaldiz&Ertekin 2001;Midilli&Kucuk 2003; Akgun&Doymaz 2005).In addition to these methods, mean relative deviation modulus (P) value was also used to evaluate the goodness of fit of the models (Sacilik&Elicin 2006; Özdemir&Devres 1999). These test functions used to determine the best fit are given below:
∑
1 21
N i pre,i exp,i)
MR
(MR
N
RMSE
(3) 1 1 2 2∑
-n
-N
)
MR
(MR
χ
N i exp,i pre,i
(4)∑
-100
i exp, i pre, i exp,MR
MR
MR
N
P
(5)Thebetter goodness of the fit means that the value of R2should be higher whilethe value of RMSE, 2and P should be lower. Selection of the best suitable drying model was done using this criteria.The
(2)
MS Excel software was used for the calculation
of the drying constants and coefficients of
semi-empirical drying models in Table 1. The coefficient
of multiple determination (R
2) was considered as the
main criteria for selecting the best model to obtain the
convection drying curves of artichoke leaves. Besides
the R
2, some other statistical tests were achieved
in order to evaluate how the developed models fit
to the data obtained from the experiments. Among
these, root mean square error (RMSE) and reduced
chi-square (χ
2) have a common use in drying related
studies (Krokida et al 2002; Yaldiz & Ertekin 2001;
Midilli & Kucuk 2003; Akgun & Doymaz 2005). In
addition to these methods, mean relative deviation
modulus (P) value was also used to evaluate the
goodness of fit of the models (Sacilik & Elicin 2006;
Özdemir & Devres 1999). These test functions used
to determine the best fit are given below:
4
The leave samples were kept in an air-circulated oven for 24 hours at 105 ±2 C in order to determine the initial moisture content. All of theseexperiments mentioned above were triplicated.2.2. Mathematical modelling of the drying curves
The experimental moisture ratio data of artichoke leaves were fitted tosemi-empirical models in Table 1 to define the convection drying kinetics. The models in Table 1 were widely employed to describe the convection drying kinetics of vegetables.
Table 1- Mathematical models widely used to describe the convection drying kinetics
Çizelge 1- Konveksiyonlakurumakinetiklerinibelirlemedeyaygınolarakkullanılanmatematiksel modeler
Model name Model equation References
Lewis MR= exp(-kt) Yaldız&Ertekin (2001)
Page MR= exp(-ktn) Alibaş (2012)
Modified Page MR= exp[-(kt)n] Artnaseaw et al (2010)
Henderson and Pabis MR= a exp(-kt) Figiel (2010)
Logarithmic MR= a exp(-kt)+c Doymaz (2013)
Midilli et al MR= a exp(-ktn)+bt Silva et al (2011)
Demir et al MR= a exp[-(kt) n]+b Demir et al (2007)
MR, moisture ratio; a, b, c coefficients; n, drying exponent specific to each equation; k, drying coefficients specific to each equation;
t, time
The left hand side of the equations is a dimensionless number known as moisture ratio MRand it could be written as follows: e e t
M
M
M
M
MR
-0
(1) o tM
M
MR
(2)MS Excel software was used for the calculation of the drying constants and coefficients of semi-empirical drying models in Table 1. The coefficient of multiple determination(R2) was considered as the main criteria for selecting the best model to obtain the convection drying curves of artichoke leaves. Besides the R2, some other statistical testswere achieved in order to evaluate how the developed models fit to the data obtained from the experiments. Among these, root mean square error(RMSE)and reduced chi-square (2)have a common use in drying related studies (Krokida et al 2002; Yaldiz&Ertekin 2001;Midilli&Kucuk 2003; Akgun&Doymaz 2005).In addition to these methods, mean relative deviation modulus (P) value was also used to evaluate the goodness of fit of the models (Sacilik&Elicin 2006; Özdemir&Devres 1999). These test functions used to determine the best fit are given below:
∑
1 21
N i pre,i exp,i)
MR
(MR
N
RMSE
(3) 1 1 2 2∑
-n
-N
)
MR
(MR
χ
N i exp,i pre,i
(4)∑
-100
i exp, i pre, i exp,MR
MR
MR
N
P
(5)Thebetter goodness of the fit means that the value of R2should be higher whilethe value of RMSE, 2and P should be lower. Selection of the best suitable drying model was done using this criteria.The
(3)
4
The leave samples were kept in an air-circulated oven for 24 hours at 105 ±2 C in order to determine the initial moisture content. All of theseexperiments mentioned above were triplicated.2.2. Mathematical modelling of the drying curves
The experimental moisture ratio data of artichoke leaves were fitted tosemi-empirical models in Table 1 to define the convection drying kinetics. The models in Table 1 were widely employed to describe the convection drying kinetics of vegetables.
Table 1- Mathematical models widely used to describe the convection drying kinetics
Çizelge 1- Konveksiyonlakurumakinetiklerinibelirlemedeyaygınolarakkullanılanmatematiksel modeler
Model name Model equation References
Lewis MR= exp(-kt) Yaldız&Ertekin (2001)
Page MR= exp(-ktn) Alibaş (2012)
Modified Page MR= exp[-(kt)n] Artnaseaw et al (2010)
Henderson and Pabis MR= a exp(-kt) Figiel (2010)
Logarithmic MR= a exp(-kt)+c Doymaz (2013)
Midilli et al MR= a exp(-ktn)+bt Silva et al (2011)
Demir et al MR= a exp[-(kt) n]+b Demir et al (2007)
MR, moisture ratio; a, b, c coefficients; n, drying exponent specific to each equation; k, drying coefficients specific to each equation;
t, time
The left hand side of the equations is a dimensionless number known as moisture ratio MRand it could be written as follows: e e t
M
M
M
M
MR
-0
(1) o tM
M
MR
(2)MS Excel software was used for the calculation of the drying constants and coefficients of semi-empirical drying models in Table 1. The coefficient of multiple determination(R2) was considered as the main criteria for selecting the best model to obtain the convection drying curves of artichoke leaves. Besides the R2, some other statistical testswere achieved in order to evaluate how the developed models fit to the data obtained from the experiments. Among these, root mean square error(RMSE)and reduced chi-square (2)have a common use in drying related studies (Krokida et al 2002; Yaldiz&Ertekin 2001;Midilli&Kucuk 2003; Akgun&Doymaz 2005).In addition to these methods, mean relative deviation modulus (P) value was also used to evaluate the goodness of fit of the models (Sacilik&Elicin 2006; Özdemir&Devres 1999). These test functions used to determine the best fit are given below:
∑
1 21
N i pre,i exp,i)
MR
(MR
N
RMSE
(3) 1 1 2 2∑
-n
-N
)
MR
(MR
χ
N i exp,i pre,i
(4)∑
-100
i exp, i pre, i exp,MR
MR
MR
N
P
(5)Thebetter goodness of the fit means that the value of R2should be higher whilethe value of RMSE, 2and P should be lower. Selection of the best suitable drying model was done using this criteria.The
(4)
4
The leave samples were kept in an air-circulated oven for 24 hours at 105 ±2 C in order to determine the initial moisture content. All of theseexperiments mentioned above were triplicated.2.2. Mathematical modelling of the drying curves
The experimental moisture ratio data of artichoke leaves were fitted tosemi-empirical models in Table 1 to define the convection drying kinetics. The models in Table 1 were widely employed to describe the convection drying kinetics of vegetables.
Table 1- Mathematical models widely used to describe the convection drying kinetics
Çizelge 1- Konveksiyonlakurumakinetiklerinibelirlemedeyaygınolarakkullanılanmatematiksel modeler
Model name Model equation References
Lewis MR= exp(-kt) Yaldız&Ertekin (2001)
Page MR= exp(-ktn) Alibaş (2012)
Modified Page MR= exp[-(kt)n] Artnaseaw et al (2010)
Henderson and Pabis MR= a exp(-kt) Figiel (2010)
Logarithmic MR= a exp(-kt)+c Doymaz (2013)
Midilli et al MR= a exp(-ktn)+bt Silva et al (2011)
Demir et al MR= a exp[-(kt) n]+b Demir et al (2007)
MR, moisture ratio; a, b, c coefficients; n, drying exponent specific to each equation; k, drying coefficients specific to each equation;
t, time
The left hand side of the equations is a dimensionless number known as moisture ratio MRand it could be written as follows: e e t
M
M
M
M
MR
-0
(1) o tM
M
MR
(2)MS Excel software was used for the calculation of the drying constants and coefficients of semi-empirical drying models in Table 1. The coefficient of multiple determination(R2) was considered as the main criteria for selecting the best model to obtain the convection drying curves of artichoke leaves. Besides the R2, some other statistical testswere achieved in order to evaluate how the developed models fit to the data obtained from the experiments. Among these, root mean square error(RMSE)and reduced chi-square (2)have a common use in drying related studies (Krokida et al 2002; Yaldiz&Ertekin 2001;Midilli&Kucuk 2003; Akgun&Doymaz 2005).In addition to these methods, mean relative deviation modulus (P) value was also used to evaluate the goodness of fit of the models (Sacilik&Elicin 2006; Özdemir&Devres 1999). These test functions used to determine the best fit are given below:
∑
1 21
N i pre,i exp,i)
MR
(MR
N
RMSE
(3) 1 1 2 2∑
-n
-N
)
MR
(MR
χ
N i exp,i pre,i
(4)∑
-100
i exp, i pre, i exp,MR
MR
MR
N
P
(5)Thebetter goodness of the fit means that the value of R2should be higher whilethe value of RMSE, 2and P should be lower. Selection of the best suitable drying model was done using this criteria.The
(5)
The better goodness of the fit means that the
value of R
2should be higher while
the value of
RMSE, χ
2and P should be lower. Selection of
the best suitable drying model was done using
this criteria. The drying constants (k) of the
chosen model were then related to the multiple
combinations of the different equations as in the
form of linear, polynomial, logarithmic, power,
exponential and Arrhenius.
3. Results and Discussion
Drying of the artichoke leaves was performed in a
convective drier and the experiments were carried
out at four different temperatures (40, 50, 60 and
70 °C), and three drying air velocities (0.6, 0.9
and 1.2 m s
-1) and constant air relative humidity
(15±2%). The average initial moisture content
of the artichoke leaves was 4.8964 kg water kg
-1dm and the leaves was dried to the average final
moisture content of 0.0662 kg water kg
-1dm until
no changes in the mass of leaves were obtained.
The characteristic drying curves were constructed
from the experimental data and indicated that
there is only a falling rate drying period for all
experimental cases. The changes in the moisture
ratio versus drying time and the drying rate versus
drying time for temperatures and airflow velocity
studied is presented in Figure 2, and Figure 3
respectively.
From these figures it is clear that the moisture
ratio of artichoke leaves decreases continuously
with drying time. As seen from Figure 2, it is
obvious that the main factors effecting the drying
kinetics of artichoke leaves are the drying air
temperature and drying airflow velocity. Drying
time went down as the drying air temperature and
airflow velocity increases. Drying air temperature
was reported to be the most important factor
influencing drying rate by many researchers.
Using higher drying temperatures increases drying
rate significantly (Temple & van Boxtel 1999;
Panchariya et al 2002). Drying of artichoke leaves
down to 10% wet based moisture content at air
temperatures of 40, 50, 60 and 70 °C lasted about
0.0 0.1 0.2 0.3 0.4 0.5 0.6 0.7 0.8 0.9 1.0 0.0 0.5 1.0 1.5 2.0 2.5 3.0 3.5 4.0 4.5 5.0 M ois tu re R atio ( M R) Drying Time (h) 40⁰C 0.6 m/s 40⁰C 0.9 m/s 40⁰C 1.2 m/s 0.0 0.1 0.2 0.3 0.4 0.5 0.6 0.7 0.8 0.9 1.0 0.0 0.5 1.0 1.5 2.0 2.5 3.0 M ois tu re R atio ( M R) Drying Time (h) 50⁰C 0.6 m/s 50⁰C 0.9 m/s 50⁰C 1.2 m/s 0.0 0.1 0.2 0.3 0.4 0.5 0.6 0.7 0.8 0.9 1.0 0.0 0.5 1.0 1.5 2.0 M ois tu re R atio ( M R) Drying Time (h) 60⁰C 0.6 m/s 60⁰C 0.9 m/s 60⁰C 1.2 m/s 0.0 0.1 0.2 0.3 0.4 0.5 0.6 0.7 0.8 0.9 1.0 0.0 0.5 1.0 1.5 2.0 M ois tu re R atio ( M R) Drying Time (h) 70⁰C 0.6 m/s 70⁰C 0.9 m/s 70⁰C 1.2 m/s m s-1 m s-1 m s-1 m s-1 m s-1 m s-1 m s-1 m s-1 m s-1 m s-1 m s-1 m s-1
Figure 2- Variations of moisture ratio as a function of time for different air-drying temperatures and velocities Şekil 2- Kurutma havasının farklı sıcaklık ve hızlarında nem oranının zamana göre değişimleri
0.0 5.0 10.0 15.0 20.0 25.0 0.0 0.5 1.0 1.5 2.0 2.5 3.0 3.5 4.0 4.5 5.0 ΔM /Δt (k g w at er ⋅kg -1dm ⋅h -1) Drying Time (h) 40⁰C 0.6 m/s 40⁰C 0.9 m/s 40⁰C 1.2 m/s 0.0 5.0 10.0 15.0 20.0 25.0 0.0 0.5 1.0 1.5 2.0 2.5 3.0 ΔM /Δt (k g w at er ⋅kg -1dm ⋅h -1) Drying Time (h) 50⁰C 0.6 m/s 50⁰C 0.9 m/s 50⁰C 1.2 m/s 0.0 5.0 10.0 15.0 20.0 25.0 0.0 0.5 1.0 1.5 2.0 ΔM /Δt (k g w at er ⋅kg -1dm ⋅h -1) Drying Time (h) 60⁰C 0.6 m/s 60⁰C 0.9 m/s 60⁰C 1.2 m/s 0.0 5.0 10.0 15.0 20.0 25.0 0.0 0.5 1.0 1.5 2.0 ΔM /Δt (k g w at er ⋅kg -1dm ⋅h -1) Drying Time (h) 70⁰C 0.6 m/s 70⁰C 0.9 m/s 70⁰C 1.2 m/s m s-1 m s-1 m s-1 m s-1 m s-1 m s-1 m s-1 m s-1 m s-1 m s-1 m s-1 m s-1
Figure 3 - Variations of drying rate as a function of time for different air-drying temperatures and velocities Şekil 3 - Kurutma havasının farklı sıcaklık ve hızlarında kuruma hızının zamana göre değişimleri
Enginar Yapraklarının (Cynara scolymus L.) Konveksiyonel Kuruma Karakteristiklerinin Matematiksel Modellenmesi, Günhan et al
Ta r ı m B i l i m l e r i D e r g i s i – J o u r n a l o f A g r i c u l t u r a l S c i e n c e s 20 (2014) 415-426
421
4.08, 2.29, 1.32 and 0.98 h respectively at a constant
drying air velocity of 0.6 m s
-1while drying at an
air velocity of 0.9 m s
-1took about 3.83, 1.60, 0.96
and 0.75 h. Increasing the drying air velocity up
to 1.2 m s
-1at air temperatures of 40, 50, 60 and
70 °C reduced the drying time down to 3.5, 1.54,
1.04 and 0.71 h respectively. From these findings
it could be stated that drying time for artichoke
leaves at 70 °C was 4.9 times shorter than that of
40 °C. The experimental data showed that there
is no constant drying rate period (Figure 3). The
drying process of artichoke leaves during all of the
tests took place in the falling rate period. As seen
from Figure 3, the drying rate increases while the
time is shortened as the drying air temperature and
the velocity increases. The main factor that causes
this is the temperature of the drying air as followed
by velocity. The effect of either 1.2 or 0.9 m s
−1air
velocity in all of the drying tests was similar and
increasing the air velocity above 1.0 m s
−1did not
increase the drying rate too much.
The moisture content data obtained from the
experiments were converted to the moisture ratio
values and then curve fitting calculations were
performed on the drying models as tabulated
in Table 1. These models and the results of the
statistical analyses are shown in Table 2.
The coefficient of multiple determination (R
2)
indicating the goodness of the fit is over the values
of 0.99395 in all drying conditions. Root mean
square error (RMSE) which gives the deviation
between the predicted and experimental values
is in the range of 0.001413 and 0.021848 in the
all drying conditions. The reduced chi-square (χ
2)
is in the range of 0.000002 and 0.001032 in all
drying conditions. The mean relative deviation
modulus (P) values were found in the range of
1.495 and 39.388 in the all drying conditions.
The statistical analysis results of experiments
generally indicate high correlation coefficients
for the all drying models. The highest values of
R
2and the lowest values of RMSE, χ
2and P can
be obtained by using the Demir et al and Midilli
et al models in all drying air temperatures and
velocities. When the Midilli et al model used, it
can be achieved the higher values than 0.99941
for R
2, lower values than 0.00485 for RMSE,
lower values than 0.00025 for χ
2and lower values
than 7.202 for P. Therefore, the Midilli et al model
was preferred because of its better fit to drying
data. The Midilli et al model has the following
form and can reveal satisfactory results in order
to predict the experimental values of the moisture
ratio values for artichoke leaves.
7
than 0.00485 for RMSE, lower values than 0.00025 for
2.and lower values than 7.202 for P.Therefore,the Midilliet al model was preferred because of its better fit to drying data. The Midilli et al model has the following form and can reveal satisfactory results in order to predict the experimental values of the moisture ratio values for artichoke leaves.
𝑀𝑀𝑅𝑅 = 𝑎𝑎
𝑒𝑒𝑥𝑥𝑝𝑝 (
𝑘𝑘𝑡𝑡𝑛𝑛) + 𝑏𝑏𝑡𝑡 (6)The statistical based results as obtained byMidilliet al model were tabulated in Table 3. As seen from the table, the drying constant kincreases once the temperature of the drying air and velocity increases while the other model constants, a,n and b fluctuate.
Table 2- Statistical analysis of drying models at various drying air temperatures and velocities Çizelge 2- Kurutmahavasınınfarklısıcaklıkvehızlarıiçinkurumamodellerininistatistikselanalizi
(Table 2:Ensondanalınıpburayayerleştrilecek)
(6)
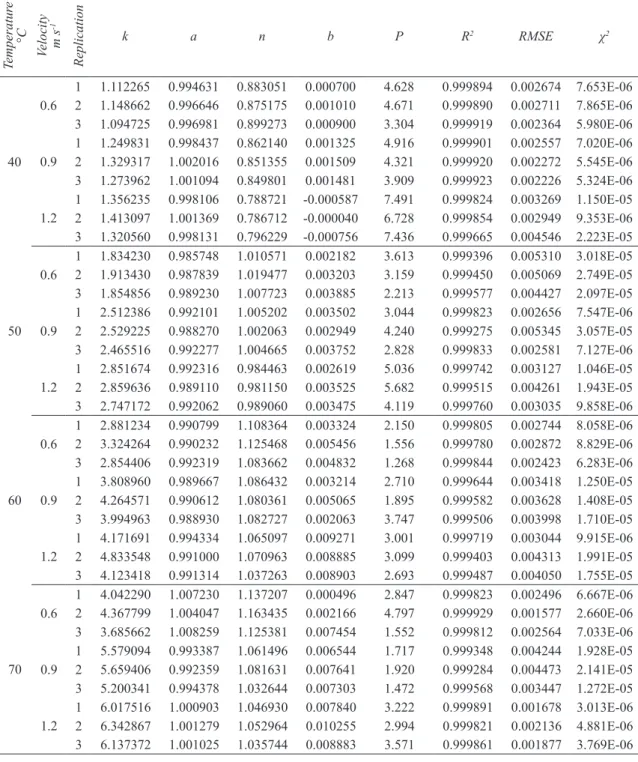
The statistical based results as obtained by
Midilli et al model were tabulated in Table 3. As
seen from the table, the drying constant k increases
once the temperature of the drying air and velocity
increases while the other model constants, a, n and
b fluctuate.
Some other regression analysis were also made
in order to consider the effect of the drying air
temperature and velocity variables on the drying
constant k (h
-1) of the Midilli et al model. The
drying constants (k) were correlated to the drying
air temperature and velocity by considering the
different combinations of the equations as in the
form of simple linear, polynomial, logarithmic,
power, exponential and Arrhenius type using the
software Datafit 6.0 (Oakdale Engineering). The
power model was assumed to be the appropriate
model due to the easiness in use even though some
higher order polynomial functions produced better
predictions.
9
Some other regression analysis were also made in order to consider the effect of the drying air
temperature and velocity variables on the drying constant k (h-1) of the Midilliet al model. The drying
constants (k) were correlated to the drying air temperature and velocity by considering the different combinations of the equations as in the form of simple linear, polynomial, logarithmic, power, exponential and Arrhenius type using the software Datafit 6.0 (Oakdale Engineering). The power model was assumed to be the appropriate model due to the easiness in use even though some higher order polynomial functions produced better predictions.
𝑘𝑘 = 𝐴𝐴
𝑇𝑇𝐵𝐵
𝑉𝑉𝐶𝐶 (7)In model, T is temperature (C), V is the drying air velocity (ms-1), A, B and C are constants. The
fitting to the above written model, the coefficients, A, B and C was found to be 0.0002048, 2.408351 and 0.563268, respectively with a coefficient of determination of 97.829%. The experimental and predicted drying constant (k) of the Midilliet al model by use of the developed model is compared and the findings from the comparison are depicted in Figure4.
Figure 4- Comparison of the experimental and predicted drying constant (k) of the Midilli et al model. Şekil 4-Midillivdmodelindekikurumakatsayısının (k) deneyselvetahminlenendeğerlerilekarşılaştırılması.
𝑘𝑘 = 0.0002048𝑇𝑇2.408351𝑉𝑉0.563268 (R2=0.97829) (8)
The drying constant, k was employed in model developed by Midilliet aland predictions were made. For this purpose, regression analysis were made and the predicted results were correlated with the
experimental data in order to obtain a higher R2 while reducing the RMSE and
2and the values of a, n andb were found to be 0.983970, 1.039708 and 0.0074083 respectively.
The Midilli et al model as a function of the temperature of drying air and velocity in order to use for artichoke drying has the following form:
𝑀𝑀𝑅𝑅 = 0.983970exp[(0.0002048𝑇𝑇2.408351𝑉𝑉0.563268)𝑡𝑡1.039708] + 0.0074083𝑡𝑡(R2=0.992995)(9)
The generalised drying model is valid under the following conditions of air temperature (T) and air velocity (V).
40°C T 70°C 0.6 ms-1 V 1.2 ms-1
The dimensionless moisture ratio values found from experimental data and predicted models are depicted in Figure 5. As seen from this figure, the predicted values generally accumulate around the
0.0 1.0 2.0 3.0 4.0 5.0 6.0 7.0 0.0 1.0 2.0 3.0 4.0 5.0 6.0 7.0 Pre di ct ed " k" Experimental "k"
(7)
In model, T is temperature (°C), V is the drying
air velocity (m s
-1), A, B and C are constants. The
fitting to the above written model, the coefficients,
A, B and C was found to be 0.0002048, 2.408351
and 0.563268, respectively with a coefficient of
determination of 97.829%. The experimental and
predicted drying constant (k) of the Midilli et al
model by use of the developed model is compared
and the findings from the comparison are depicted
in Figure 4.
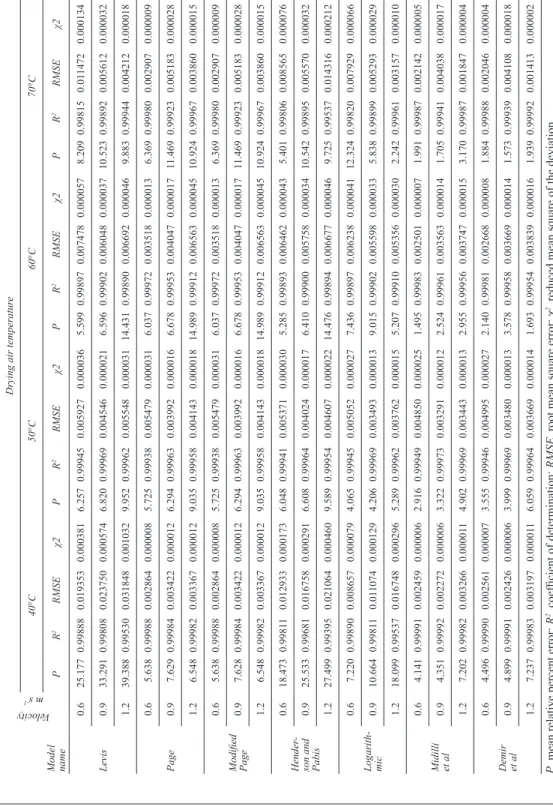
Table 2- Statistical analysis of drying models at various drying air temperatures and velocities Çizelge 2- Kurutma havasının farklı sıcaklık ve hızları için kuruma modellerinin istatistiksel analizi
Velocity m s
-1
Drying air temperatur
e 40°C 50°C 60°C 70°C Model name P R 2 RMSE χ2 P R 2 RMSE χ2 P R 2 RMSE χ2 P R 2 RMSE χ2 Levis 0.6 25.177 0.99888 0.019353 0.000381 6.257 0.99945 0.005927 0.000036 5.599 0.99897 0.007478 0.000057 8.209 0.99815 0.01 1472 0.000134 0.9 33.291 0.99808 0.023750 0.000574 6.820 0.99969 0.004546 0.000021 6.596 0.99902 0.006048 0.000037 10.523 0.99892 0.005612 0.000032 1.2 39.388 0.99530 0.031848 0.001032 9.952 0.99962 0.005548 0.000031 14.431 0.99890 0.006692 0.000046 9.883 0.99944 0.004212 0.000018 Page 0.6 5.638 0.99988 0.002864 0.000008 5.725 0.99938 0.005479 0.000031 6.037 0.99972 0.003518 0.000013 6.369 0.99980 0.002907 0.000009 0.9 7.629 0.99984 0.003422 0.000012 6.294 0.99963 0.003992 0.000016 6.678 0.99953 0.004047 0.000017 11.469 0.99923 0.005183 0.000028 1.2 6.548 0.99982 0.003367 0.000012 9.035 0.99958 0.004143 0.000018 14.989 0.99912 0.006563 0.000045 10.924 0.99967 0.003860 0.000015 Modified Page 0.6 5.638 0.99988 0.002864 0.000008 5.725 0.99938 0.005479 0.000031 6.037 0.99972 0.003518 0.000013 6.369 0.99980 0.002907 0.000009 0.9 7.628 0.99984 0.003422 0.000012 6.294 0.99963 0.003992 0.000016 6.678 0.99953 0.004047 0.000017 11.469 0.99923 0.005183 0.000028 1.2 6.548 0.99982 0.003367 0.000012 9.035 0.99958 0.004143 0.000018 14.989 0.99912 0.006563 0.000045 10.924 0.99967 0.003860 0.000015 Hender
-son and Pabis
0.6 18.473 0.9981 1 0.012933 0.000173 6.048 0.99941 0.005371 0.000030 5.285 0.99893 0.006462 0.000043 5.401 0.99806 0.008565 0.000076 0.9 25.533 0.99681 0.016758 0.000291 6.608 0.99964 0.004024 0.000017 6.410 0.99900 0.005758 0.000034 10.542 0.99895 0.005570 0.000032 1.2 27.499 0.99395 0.021064 0.000460 9.589 0.99954 0.004607 0.000022 14.476 0.99894 0.006677 0.000046 9.725 0.99537 0.014316 0.000212 Logarith -mic 0.6 7.220 0.99890 0.008657 0.000079 4.065 0.99945 0.005052 0.000027 7.436 0.99897 0.006238 0.000041 12.324 0.99820 0.007929 0.000066 0.9 10.664 0.9981 1 0.01 1074 0.000129 4.206 0.99969 0.003493 0.000013 9.015 0.99902 0.005598 0.000033 5.838 0.99899 0.005293 0.000029 1.2 18.099 0.99537 0.016748 0.000296 5.289 0.99962 0.003762 0.000015 5.207 0.99910 0.005356 0.000030 2.242 0.99961 0.003157 0.000010 Midilli et al 0.6 4.141 0.99991 0.002459 0.000006 2.916 0.99949 0.004850 0.000025 1.495 0.99983 0.002501 0.000007 1.991 0.99987 0.002142 0.000005 0.9 4.351 0.99992 0.002272 0.000006 3.322 0.99973 0.003291 0.000012 2.524 0.99961 0.003563 0.000014 1.705 0.99941 0.004038 0.000017 1.2 7.202 0.99982 0.003266 0.00001 1 4.902 0.99969 0.003443 0.000013 2.955 0.99956 0.003747 0.000015 3.170 0.99987 0.001847 0.000004 Demir et al 0.6 4.496 0.99990 0.002561 0.000007 3.555 0.99946 0.004995 0.000027 2.140 0.99981 0.002668 0.000008 1.884 0.99988 0.002046 0.000004 0.9 4.899 0.99991 0.002426 0.000006 3.999 0.99969 0.003480 0.000013 3.578 0.99958 0.003669 0.000014 1.573 0.99939 0.004108 0.000018 1.2 7.237 0.99983 0.003197 0.00001 1 6.059 0.99964 0.003669 0.000014 1.693 0.99954 0.003839 0.000016 1.939 0.99992 0.001413 0.000002
P, mean relative percent error;
R
2, coefficient of determination;
RMSE
, root mean square error; χ
Enginar Yapraklarının (Cynara scolymus L.) Konveksiyonel Kuruma Karakteristiklerinin Matematiksel Modellenmesi, Günhan et al
Ta r ı m B i l i m l e r i D e r g i s i – J o u r n a l o f A g r i c u l t u r a l S c i e n c e s 20 (2014) 415-426
423
Table 3- Statistical results of the Midilli et al model and its constants and coefficients at different drying conditionsÇizelge 3- Kurutma havasının farklı sıcaklık ve hızları için Midilli vd modelinin sabitleri, katsayıları ve istatistik analizi
Temperatur e °C Velocity m s -1 Replication k a n b P R2 RMSE χ2 40 0.6 1 1.112265 0.994631 0.883051 0.000700 4.628 0.999894 0.002674 7.653E-06 2 1.148662 0.996646 0.875175 0.001010 4.671 0.999890 0.002711 7.865E-06 3 1.094725 0.996981 0.899273 0.000900 3.304 0.999919 0.002364 5.980E-06 0.9 12 1.2498311.329317 0.9984371.002016 0.8621400.851355 0.0013250.001509 4.9164.321 0.9999200.999901 0.002557 7.020E-060.002272 5.545E-06 3 1.273962 1.001094 0.849801 0.001481 3.909 0.999923 0.002226 5.324E-06 1.2 1 1.356235 0.998106 0.788721 -0.000587 7.491 0.999824 0.003269 1.150E-05 2 1.413097 1.001369 0.786712 -0.000040 6.728 0.999854 0.002949 9.353E-06 3 1.320560 0.998131 0.796229 -0.000756 7.436 0.999665 0.004546 2.223E-05 50 0.6 1 1.834230 0.985748 1.010571 0.002182 3.613 0.999396 0.005310 3.018E-05 2 1.913430 0.987839 1.019477 0.003203 3.159 0.999450 0.005069 2.749E-05 3 1.854856 0.989230 1.007723 0.003885 2.213 0.999577 0.004427 2.097E-05 0.9 1 2.512386 0.992101 1.005202 0.003502 3.044 0.999823 0.002656 7.547E-06 2 2.529225 0.988270 1.002063 0.002949 4.240 0.999275 0.005345 3.057E-05 3 2.465516 0.992277 1.004665 0.003752 2.828 0.999833 0.002581 7.127E-06 1.2 12 2.8516742.859636 0.9923160.989110 0.9844630.981150 0.0026190.003525 5.0365.682 0.9995150.999742 0.003127 1.046E-050.004261 1.943E-05 3 2.747172 0.992062 0.989060 0.003475 4.119 0.999760 0.003035 9.858E-06 60 0.6 1 2.881234 0.990799 1.108364 0.003324 2.150 0.999805 0.002744 8.058E-06 2 3.324264 0.990232 1.125468 0.005456 1.556 0.999780 0.002872 8.829E-06 3 2.854406 0.992319 1.083662 0.004832 1.268 0.999844 0.002423 6.283E-06 0.9 12 3.8089604.264571 0.9896670.990612 1.0864321.080361 0.0032140.005065 2.7101.895 0.9995820.999644 0.003418 1.250E-050.003628 1.408E-05 3 3.994963 0.988930 1.082727 0.002063 3.747 0.999506 0.003998 1.710E-05 1.2 1 4.171691 0.994334 1.065097 0.009271 3.001 0.999719 0.003044 9.915E-06 2 4.833548 0.991000 1.070963 0.008885 3.099 0.999403 0.004313 1.991E-05 3 4.123418 0.991314 1.037263 0.008903 2.693 0.999487 0.004050 1.755E-05 70 0.6 12 4.0422904.367799 1.0072301.004047 1.1372071.163435 0.0004960.002166 2.8474.797 0.9999290.999823 0.002496 6.667E-060.001577 2.660E-06 3 3.685662 1.008259 1.125381 0.007454 1.552 0.999812 0.002564 7.033E-06 0.9 1 5.579094 0.993387 1.061496 0.006544 1.717 0.999348 0.004244 1.928E-05 2 5.659406 0.992359 1.081631 0.007641 1.920 0.999284 0.004473 2.141E-05 3 5.200341 0.994378 1.032644 0.007303 1.472 0.999568 0.003447 1.272E-05 1.2 1 6.017516 1.000903 1.046930 0.007840 3.222 0.999891 0.001678 3.013E-06 2 6.342867 1.001279 1.052964 0.010255 2.994 0.999821 0.002136 4.881E-06 3 6.137372 1.001025 1.035744 0.008883 3.571 0.999861 0.001877 3.769E-06
Mathematical Modelling of Convection Drying Characteristics of Artichoke (Cynara scolymus L.) Leaves, Günhan et al Ta r ı m B i l i m l e r i D e r g i s i – J o u r n a l o f A g r i c u l t u r a l S c i e n c e s 20 (2014) 415-426
424
0.0 1.0 2.0 3.0 4.0 5.0 6.0 7.0 0.0 1.0 2.0 3.0 4.0 5.0 6.0 7.0 Pr ed ict ed "k " Experimental "k"Figure 4- Comparison of the experimental and predicted drying constant (k) of the Midilli et al model
Şekil 4- Midilli vd modelindeki kuruma katsayısının (k) deneysel ve tahminlenen değerler ile karşılaştırılması
9
constants (k) were correlated to the drying air temperature and velocity by considering the different combinations of the equations as in the form of simple linear, polynomial, logarithmic, power, exponential and Arrhenius type using the software Datafit 6.0 (Oakdale Engineering). The power model was assumed to be the appropriate model due to the easiness in use even though some higher order polynomial functions produced better predictions.
𝑘𝑘 = 𝐴𝐴
𝑇𝑇𝐵𝐵
𝑉𝑉𝐶𝐶 (7)In model, T is temperature (C), V is the drying air velocity (ms-1), A, B and C are constants. The
fitting to the above written model, the coefficients, A, B and C was found to be 0.0002048, 2.408351 and 0.563268, respectively with a coefficient of determination of 97.829%. The experimental and predicted drying constant (k) of the Midilliet al model by use of the developed model is compared and the findings from the comparison are depicted in Figure4.
Figure 4- Comparison of the experimental and predicted drying constant (k) of the Midilli et al model. Şekil 4-Midillivdmodelindekikurumakatsayısının (k) deneyselvetahminlenendeğerlerilekarşılaştırılması.
𝑘𝑘 = 0.0002048𝑇𝑇2.408351𝑉𝑉0.563268 (R2=0.97829) (8)
The drying constant, k was employed in model developed by Midilliet aland predictions were made. For this purpose, regression analysis were made and the predicted results were correlated with the
experimental data in order to obtain a higher R2 while reducing the RMSE and
2and the values of a, n andb were found to be 0.983970, 1.039708 and 0.0074083 respectively.
The Midilli et al model as a function of the temperature of drying air and velocity in order to use for artichoke drying has the following form:
𝑀𝑀𝑅𝑅 = 0.983970exp[(0.0002048𝑇𝑇2.408351𝑉𝑉0.563268)𝑡𝑡1.039708] + 0.0074083𝑡𝑡(R2=0.992995)(9)
The generalised drying model is valid under the following conditions of air temperature (T) and air velocity (V).
40°C T 70°C 0.6 ms-1 V 1.2 ms-1
The dimensionless moisture ratio values found from experimental data and predicted models are depicted in Figure 5. As seen from this figure, the predicted values generally accumulate around the
0.0 1.0 2.0 3.0 4.0 5.0 6.0 7.0 0.0 1.0 2.0 3.0 4.0 5.0 6.0 7.0 Pre di ct ed " k" Experimental "k"
(R
2=0.97829) (8)
The drying constant, k was employed in model
developed by Midilli et al and predictions were
made. For this purpose, regression analysis were
made and the predicted results were correlated with
the experimental data in order to obtain a higher R
2while reducing the RMSE and χ
2and the values of a,
n and b were found to be 0.983970, 1.039708 and
0.0074083 respectively.
The Midilli et al model as a function of the
temperature of drying air and velocity in order to
use for artichoke drying has the following form:
Some other regression analysis were also made in order to consider the effect of the drying air temperature and velocity variables on the drying constant k (h-1) of the Midilliet al model. The drying
constants (k) were correlated to the drying air temperature and velocity by considering the different combinations of the equations as in the form of simple linear, polynomial, logarithmic, power, exponential and Arrhenius type using the software Datafit 6.0 (Oakdale Engineering). The power model was assumed to be the appropriate model due to the easiness in use even though some higher order polynomial functions produced better predictions.
𝑘𝑘 = 𝐴𝐴𝑇𝑇𝐵𝐵𝑉𝑉𝐶𝐶 (7)
In model, T is temperature (C), V is the drying air velocity (ms-1), A, B and C are constants. The
fitting to the above written model, the coefficients, A, B and C was found to be 0.0002048, 2.408351 and 0.563268, respectively with a coefficient of determination of 97.829%. The experimental and predicted drying constant (k) of the Midilliet al model by use of the developed model is compared and the findings from the comparison are depicted in Figure4.
Figure 4- Comparison of the experimental and predicted drying constant (k) of the Midilli et al model.
Şekil 4-Midillivdmodelindekikurumakatsayısının (k) deneyselvetahminlenendeğerlerilekarşılaştırılması.
𝑘𝑘 = 0.0002048𝑇𝑇2.408351𝑉𝑉0.563268 (R2=0.97829) (8)
The drying constant, k was employed in model developed by Midilliet aland predictions were made. For this purpose, regression analysis were made and the predicted results were correlated with the experimental data in order to obtain a higher R2 while reducing the RMSE and 2and the values of a, n and b were found to be 0.983970, 1.039708 and 0.0074083 respectively.
The Midilli et al model as a function of the temperature of drying air and velocity in order to use for artichoke drying has the following form:
𝑀𝑀𝑅𝑅 = 0.983970exp[(0.0002048𝑇𝑇2.408351𝑉𝑉0.563268)𝑡𝑡1.039708] + 0.0074083𝑡𝑡(R2=0.992995)(9) The generalised drying model is valid under the following conditions of air temperature (T) and air velocity (V).
40°C T 70°C 0.6 ms-1 V 1.2 ms-1
The dimensionless moisture ratio values found from experimental data and predicted models are depicted in Figure 5. As seen from this figure, the predicted values generally accumulate around the
0.0 1.0 2.0 3.0 4.0 5.0 6.0 7.0 0.0 1.0 2.0 3.0 4.0 5.0 6.0 7.0 Pre di ct ed " k" Experimental "k" Some other regression analysis were also made in order to consider the effect of the drying air temperature and velocity variables on the drying constant k (h-1) of the Midilliet al model. The drying
constants (k) were correlated to the drying air temperature and velocity by considering the different combinations of the equations as in the form of simple linear, polynomial, logarithmic, power, exponential and Arrhenius type using the software Datafit 6.0 (Oakdale Engineering). The power model was assumed to be the appropriate model due to the easiness in use even though some higher order polynomial functions produced better predictions.
𝑘𝑘 = 𝐴𝐴𝑇𝑇𝐵𝐵𝑉𝑉𝐶𝐶 (7)
In model, T is temperature (C), V is the drying air velocity (ms-1), A, B and C are constants. The
fitting to the above written model, the coefficients, A, B and C was found to be 0.0002048, 2.408351 and 0.563268, respectively with a coefficient of determination of 97.829%. The experimental and predicted drying constant (k) of the Midilliet al model by use of the developed model is compared and the findings from the comparison are depicted in Figure4.
Figure 4- Comparison of the experimental and predicted drying constant (k) of the Midilli et al model.
Şekil 4-Midillivdmodelindekikurumakatsayısının (k) deneyselvetahminlenendeğerlerilekarşılaştırılması.
𝑘𝑘 = 0.0002048𝑇𝑇2.408351𝑉𝑉0.563268 (R2=0.97829) (8)
The drying constant, k was employed in model developed by Midilliet aland predictions were made. For this purpose, regression analysis were made and the predicted results were correlated with the experimental data in order to obtain a higher R2 while reducing the RMSE and 2and the values of a, n and b were found to be 0.983970, 1.039708 and 0.0074083 respectively.
The Midilli et al model as a function of the temperature of drying air and velocity in order to use for artichoke drying has the following form:
𝑀𝑀𝑅𝑅 = 0.983970exp[(0.0002048𝑇𝑇2.408351𝑉𝑉0.563268)𝑡𝑡1.039708] + 0.0074083𝑡𝑡(R2=0.992995)(9) The generalised drying model is valid under the following conditions of air temperature (T) and air velocity (V).
40°C T 70°C 0.6 ms-1 V 1.2 ms-1
The dimensionless moisture ratio values found from experimental data and predicted models are depicted in Figure 5. As seen from this figure, the predicted values generally accumulate around the
0.0 1.0 2.0 3.0 4.0 5.0 6.0 7.0 0.0 1.0 2.0 3.0 4.0 5.0 6.0 7.0 Pre di ct ed " k" Experimental "k"
(9)
The generalised drying model is valid under the
following conditions of air temperature (T) and air
velocity (V).
40 °C ≤ T ≤ 70°C
0.6 ms
-1≤ V ≤ 1.2 ms
-1The dimensionless moisture ratio values found
from experimental data and predicted models are
depicted in Figure 5. As seen from this figure, the
predicted values generally accumulate around the
straight line. This indicates how the developed
model fits to the data obtained in the laboratory for
the drying of artichoke leaves.
0.0 0.1 0.2 0.3 0.4 0.5 0.6 0.7 0.8 0.9 1.0 0 0.1 0.2 0.3 0.4 0.5 0.6 0.7 0.8 0.9 1 Ta hmi nl en en A NO d eğ erl eri
Deneysel ANO değerleri
Figure 5- Comparison of the experimental and predicted moisture ratio for the developed model Şekil 5- Deneysel ve geliştirilen model yardımıyla tahminlenen nem oranı değerlerinin karşılaştırılması
4. Conclusions
In this study, the drying behavior of artichoke
leaves was investigated. Drying artichoke leaves
at constant 1.2 m s
-1drying air velocity down to
approximately 10% (wet basis) moisture content at
air temperature of 40, 50, 60 and 70 °C in the dryer
lasted about 3.50, 1.54, 1.04 and 0.71 h respectively.
It is evident from the experimental data there is no
constant rate drying period.
For describing the drying behavior of artichoke
leaves, seven models were applied to the drying
process. The different mathematical drying models
considered in this study were evaluated according
to the R
2, RMSE, χ
2and P to estimate drying curves.
The correlation coefficients of all of the models
considered in this study was found to be close to
Enginar Yapraklarının (Cynara scolymus L.) Konveksiyonel Kuruma Karakteristiklerinin Matematiksel Modellenmesi, Günhan et al
Ta r ı m B i l i m l e r i D e r g i s i – J o u r n a l o f A g r i c u l t u r a l S c i e n c e s 20 (2014) 415-426
425
each other while the RMSE, χ
2and P
values were
the smallest once the Midilli et al model was used.
Based on these findings the Midilli et al model
was selected and a drying constant model of k as
a function of the temperature of drying air and
airflow velocity was developed and a final model
was proposed. The drying model explains the drying
of artichoke leaves the air temperature T range of
40 °C ≤ T ≤ 70 °C and 0.6 m s
-1≤ V ≤ 1.2 m s
-1drying
airflow velocity. The predictions by the Midilli et al
model were found to be in good agreement with the
data obtained in the laboratory.
Wang et al (2003) found that the phenolic content
of artichokes did not significantly change during the
drying at a temperature of 70 °C and freeze-drying.
Using this argument, it can be stated that artichoke
leaves can be dried at either 60 or 70 °C if a faster
drying is needed.
Acknowledgements
The authors would like to acknowledge the financial
support provided by the Ege University Research
Fund.
References
Akgun N A & Doymaz I (2005). Modelling of olive cake thin-layer drying process. Journal of Food Science
and Technology 68: 455-461
Alibas İ (2012). Asma yaprağının (Vitis vinifera L.) mikrodalga enerjisiyle kurutulması ve bazı kalite parametrelerinin belirlenmesi. Tarım Bilimleri
Dergisi-Journal of Agricultural Sciences 18: 43-53
Alonso M R, García M C, Bonelli C G, Ferraro G & Rubio M (2006). Validated HPLC method for cynarin determination in biological samples. Acta Farm.
Bonaerense 25(2): 267-70
Artnaseaw A, Theerakulpisut S & Benjapiyaporn C (2010). Drying characteristics of Shiitake mushroom and Jinda chili during vacuum heat pump drying.
Food and Bioproducts Processing 88: 105–114
Baysal T, Içier F, Ersus S & Yildiz H (2003). Effects of microwave and infrared drying on the quality of carrot and garlic. Eur. Food Res. Technology 218: 68–73 Bundy R, Walker A F, Middleton R W, Wallis C &
Simpson H C R (2008). Artichoke leaf extract (Cynara scolymus) reduces plasma cholesterol in otherwise healthy hypercholesterolemic adults: A randomized, double blind placebo controlled trial. Phytomedicine
15: 668–675 Abbreviations and Symbols
A, B, C constants
a, b, c, g, h, n dimensionless coefficients in the drying models
k drying coefficients in the drying models, h−1
M0 initial moisture content, dry basis (kg water kg-1 dm-1)
Me equilibrium moisture content, dry basis (kg water kg-1 dm-1)
MR moisture ratio, dimensionless
MRexp experimental moisture ratio, dimensionless
MRpre predicted moisture ratio, dimensionless
Mt moisture content at any time, dry basis (kg water kg-1 dm-1)
N total number of observations
n1 number of constants
P mean relative percent error
R2 coefficient of determination
RMSE root mean square error
T air temperature, °C
t time, h
V air velocity, m s-1