86
WORKING CAPITAL MANAGEMENT, PERFORMANCE AND MARKET
VALUE OF LOGISTICS COMPANIES LISTED ON BORSA ISTANBUL
Narman KUZUCU
1Abstract
In this research, we aim to examine the influence of working capital management on performance and market value of companies in logistics industry. We use a panel data analysis methodology with a data set covering eight logistics companies listed on Borsa Istanbul in the period 2009 to 2018. In order to estimate the relationship between working capital management and performance of companies we use return on assets (ROA) and market to book value (MB) as dependent variables in the research models. The main results indicate that net working capital (NWC) is not related to current year’s profitability, but with a time lag, it is positively related to next year’s profitability. Contrarily, NWC is negatively associated with MB of logistics companies. Financial leverage, which is one the control variables, is found statistically significant, and the relationship between leverage and profitability is negative. Leverage is positively associated with MB. The results suggest that leveraged companies are more likely to obtain less return or to suffer from losses; however, leverage enhances firms’ market value. Considering the limitations related to the research period and the number of logistics firms listed on Borsa Istanbul, the results should be interpreted with some caution.
Keywords: leverage, logistics industry, net working capital, performance, working capital management
JEL Classification: G30, G32
BORSA İSTANBUL’DA İŞLEM GÖREN LOJİSTİK İŞLETMELERİNİN
ÇALIŞMA SERMAYESİ YÖNETİMİ, PERFORMANS VE PİYASA
DEĞERLERİ
ÖzBu çalışmada amacımız lojistik sektöründeki işletmelerde çalışma sermayesi yönetiminin işletme performansına ve piyasa değerine etkisini incelemektir. Bu amaçla, 2009 – 2018 yılları arasında Borsa İstanbul’da işlem görmüş sekiz lojistik sektörü işletmesine ait veriler panel veri analiz yöntemine tabi tutulmuştur. Araştırma modellerinde, net çalışma sermayesi (NÇS) ve şirketlerin performansı arasındaki ilişkiyi tahmin etmek için bağımsız değişkenler olarak, aktif kârlılık ve piyasa değeri / defter değeri (PD/DD) oranları kullanılmıştır. NÇS’nin ilgili yılın kârlılığı ile ilişkili olmadığı, ancak bir sonraki yılın kârlılığıyla istatistiksel olarak pozitif ilişkili olduğu sonucuna ulaşılmıştır. Beklenilenin aksine, NÇŞ’nin lojistik şirketlerinin piyasa değerleriyle negatif ilişkili olduğu görülmüştür. Kontrol değişkenlerinden biri olarak modele kattığımız finansal kaldıraç oranının istatistiksel olarak anlamlı ve kârlılıkla ilişkisinin negatif olduğu bulunmuştur. Diğer yandan PD/DD ile yani şirketlerin piyasa değeriyle ilişkisi ise pozitiftir. Sonuçlara göre, finansal kaldıraçlı lojistik firmaların daha az kâr etmesi veya zararlara katlanması olası iken, kaldıracın şirketlerin piyasa değerlerini güçlendirdiği bulunmuştur. Çalışmanın kapsadığı halka açık lojistik firma ve yıl sayısına ilişkin kısıtlar dikkate alınarak, ulaştığımız sonuçlara ihtiyatlı yaklaşılması gerekmektedir.
Anahtar kelimeler: çalışma sermayesi yönetimi, kaldıraç, lojistik sektörü, net çalışma sermayesi, performans
JEL Sınıflaması: G30, G32
1 Asst. Prof. Narman Kuzucu, Beykent University, Faculty of Economics and Administrative Sciences, Department of Business, Istanbul, Turkey, [email protected] ID: 0000-0003-2265-6492
87
1. Introduction
Corporate performance is the main concern of financial managers in logistics industry as well as in the other sectors. Profitability and share stock price are the key indicators of performance of a company. In this research, we aim to examine the impact of working capital management over performance and market value of companies in logistics industry.
Current assets and liabilities collectively form working capital of a business. Working capital management (WCM) involves managing cash, inventory, receivables and payables (Brealey, Myers, Allen, 2014, p. 775). Net working capital refers to the difference between a company’s short-term assets and liabilities (Brealey et al, 2014, p. 132; Brigham and Ehrhardt, 2013, p. 633). Companies operating in logistics industry apparently do not have inventory since they do not have merchandise and finished goods. However, they need to manage their cash holdings, short-term investments, receivables and short-term debt as well as other businesses.
Operations managers, logistics experts and production specialists are generally in charge for improving a firm’s working capital position. Accordingly, marketing managers and logistics experts cooperate to keep the inventory at optimal level. Finance department plays role in deciding how much cash holdings should be kept and how to finance working capital (Brigham and Ehrhardt, 2013, p. 632). Higher working capital decreases the riskiness of companies because a company, which runs at higher levels of working capital (current assets), can easily overcome unexpected shortages. However, this results low returns (Brigham and Ehrhardt, 2013, p. 634).
Working capital performance is generally measured by cash conversion cycle (CCC). CCC refers to the period between the expenditure for the purchase of inventory and the collection from the sales (Kieschnick et al, 2013). In other words, CCC is the process in which firms purchase or produce inventory, hold it for a time, and then sell it and receive cash. Thus, working capital management relates to managing inventory conversion period, average collection period and payables deferral period (Brigham and Ehrhardt, 2013, p. 638-639). Necessarily, investing in operating working capital will extend CCC. Therefore, higher the operating working capital, lower the CCC of a business. However, there is not a consensus as to the link between firm’s overall performance and working capital empirically.
In logistics industry, companies do not have a considerable level of inventories. As a separate industry, logistics business is considered as a service sector, and does not relate to sales of goods. Working capital management in logistics industry relates to receivables and payables other than cash holdings. Financial managers manage collection period and payables deferral period for financial performance of their company. Does working capital management actually enhance corporate performance? The research question of this paper is whether working capital management affects performance of a logistics business. We refer to performance in two meanings: corporate profitability and performance of stock price.
We organize the remainder of the paper as follows. In the next section, we provide a brief review on working capital literature.
This section reviews not only empirical research studies on the relationship between the working capital management and the corporate performance, but also the literature on the performance of Turkish logistics firms.
88
We describe and explain the data and methodology used in the third section. The empirical study and the empirical results are presented in this section. Finally, in the last section, we summarize and highlight our results and a conclusion is drawn.
2. Literature Review
We divide this section into three parts. In the first part, the empirical research on the relationship between working capital and firm performance is reviewed and discussed systematically with evidences from different countries. In the second part, the evidence from Turkish firms is reported. In the third part, the research on the performance of Turkish logistics companies is summarized.
3. Empirical Evidences from Different Countries
There is a large empirical research literature on working capital management through industries and countries. However, a lack of systematic theory development is missing as Singh and Kumar (2014) noted. The research studies generally test whether WCM has effect on firm performance, and the results are not similar. Most of the empirical studies result that less investments in working capital is associated with higher firm performance (Banos-Caballero, Garcia-Teruel & Martinez-Solano, 2014; Deloof, 2013; Garcia-Teruel & Martinez-Salano, 2007; Nobanee, Abullatif & AlHajjar, 2011; Shin & Soenen, 1998; Wang, 2002). Accordingly, higher CCC increases inventory-holding expenses such as storing and insurance. Furthermore, higher working capital leads to higher interest expenses (Kieschnick et al, 2013).
Additionally, some research focused on components of working capital. Deloof (2003) reported negative relations between number of days accounts receivable and inventory, and profitability. As well, he found a negative relation between profitability and number of days accounts payable against the common belief. The results of Garcia-Teruel and Martinez-Salano (2007) related to receivables and inventory are similar, but they found no relation between accounts payable and profitability with a huge data set of Spanish firms. The study of Gill et al (2010) support their finding on payables.
On the other side, a number of empirical studies including Bhunia and Das (2012), Martinez Sola et al ( 2013), Sharma and Kumar (2011), Gill et al (2010) and Raheman et al (2010) advocate positive impact of CCC on firm performance. Because investing in working capital prevents production interruption and the loss of demand due to the scarcity of products. Additionally, longer trade credit periods stimulate sales and lowers transactions costs converting receivables into cash (Martinez-Sola et al, 2013).
Some research suggests that lower levels of working capital lead to lower financing costs and financial flexibility (Autukaite & Molay, 2011; Banos-Caballero et al, 2014). Ganesan (2007) also asserts that lower investments in working capital decrease the risks of firms. On the other side, many studies advocate that net working capital level is linked to the cash flow availability of firms (Fazzari, Hubbard & Petersen, 1988).
Accordingly, firms, which generate internal finance, have higher net working capital (Chiou, Cheng & Wu, 2006; Hill et al, 2010). Hill et al (2010) also assert that working capital requirement is different in different industries.
89
This suggests that investing in working capital has different impact on performance across industries.Autukaite and Molay (2011) examined the contribution of cash holdings and working capital to firm value for French listed companies. They conclude that an additional euro invested in net working capital is worth less than holding cash. Similarly, Kieschnick et al (2013) investigated the effect of operating working capital on shareholders’ wealth, using a huge data set of US corporations. They found that an additional dollar invested in working capital is worth less than an additional dollar held in cash. This result shows the negative relationship between net working capital and the performance of a company. Furthermore, they documented that investing in providing credit to customers creates more value than investing in inventory.
Recent studies examine the presence of concave relation between working capital and firm performance, which suggests an optimal NWC. Banos-Caballero et al (2012) documented a concave relationship between NWC and operating performance with a sample of small and medium-sized Spanish firms. Thus, reduction of investments in working capital may have negative effect on firm performance. Accordingly, an additional increased investment in working capital may also have a negative impact on firm profitability. Studying a sample of UK firms, Banos-Caballero et al (2014) documented an inverted U-shape relation between NWC and stock performance. Aktas, Croci & Petmezas (2015) report the relation between working capital and stock performance is positive for the firms with lower working capital. This result suggest that there is an optimal level of NWC. The firms, which increase or decrease working capital level to the optimal level of NWC, raise their stock performance (Aktas et al 2015). Altaf & Shah (2017) and Singhania & Mehta (2017) investigated the non-linear relationship between a firm’s working capital and performance with data sets of firms from south Asian countries. They found that there is an inverted U-shaped relationship between working capital and firm performance.
4. Empirical Research Studies on Turkish Companies
In this section, we review research studies related to working capital management of Turkish companies and the research papers on the performance of Turkish logistics companies. Interestingly, the research issues and methodologies performed on working capital management using Turkish listed companies are diversified. Some featuring studies are summarized herein.
Yücel and Kurt (2002) investigated the effect of working capital on the profitability of Turkish listed firms with a data set of 167 firms. They resulted that there is a negative relationship between working capital and return on assets. Similar research studies done by Öz and Güngör (2007), Şamiloğlu and Demirgüneş (2008), Coşkun and Kök (2011), Karaduman et al (2011), İltaş (2016) and Öner (2016) found empirical evidence on the negative relationship between working capital and profitability for Turkish firms. Dinçergök (2019) found nonlinear and concave relationship between working capital and profitability.
According to the results, there is a significant and nonlinear relationship between components of working capital and profitability. Accordingly, increasing inventory conversion period decreases profitability to a specific point and then, increases.
The results of Dinçergök (2019) suggest that there is an optimal collection period and inventory turnover period for businesses, and support the findings of Banos-Caballero et al (2012).
90
Çakır and Küçükkaplan (2012) investigated the effect of working capital components on the profitability and the market value of Turkish listed manufacturing companies. They did not find any support for the effect of working capital components such as inventory turnover and receivables turnover ratios on profitability and market value of a company. Çelik and Boyacıoğlu (2013) examined the effect of fixed asset investments to working capital and found negative relationship.
The common result of studies on Turkish listed firms is that increasing working capital decreases profitability of a company. Accordingly, the research studies on Turkish listed firms provide evidence for the assertion that there is a negative relationship between working capital and profitability.
5. The Literature on the Performance of Turkish Logistics Companies
In the recent literature, researchers often use the multi-criteria decision (MCDM) techniques such as TOPSIS and VIKOR, and the data is obtained from the popular journals to measure the performance of logistics firms. Çakır and Perçin (2013) examined the performance of logistics firms, employing the MCDM methods. They used the data of 10 logistics firms from the Fortune Turkey’s 500 best companies. In the study, the companies’ financial figures were used to apply integrated methods, and 10 Turkish logistics firms were ranked with respect to their performances. They advocate that the MCDM technique, which they employed, is a very convenient method for performance measurement. Ayaydın, Durmuş and Pala (2017) used the same data, but this time used efficiency, size and profitability ratios by means of grey relationship analysis method (GRA) to measure the performance of logistics firms. The ranking is not similar to the results of the study of Çakır and Perçin (2013). Ayaydın et al assert that the differentiation stems from the financial ratios which they employ. Özbek and Demirkol (2018) used the step-wise weight assessment ratio analysis (SWARA) and GRA methodology with the updated financial figures of nearly the same companies. In their study, four different models are applied in respect to the weights of the criteria. The rankings of the firms are nearly the same according to the results of the four different models. Özbek and Demirkol (2018) suggest that the results show a combined model of SWARA and GRA evaluates the performance of the logistics firms fairly. Tufan and Kılıç (2019) used TOPSIS and VIKOR methodology to evaluate the financial performance of listed logistics firms on Borsa Istanbul. They compared the ranking results of the two techniques.Deran and Erduru (2018) took a descriptive approach in their study on the financial performance of the transportation sector in Turkey. They analyzed the financial ratios extracted from the sectoral financial statements, which is published by the Central Bank of the Republic of Turkey. They obtained the average profitability and efficiency ratios for three years, and compared the sea freight and land transport sectors.
The literature review shows that MCDM techniques are common methodology used to evaluate the financial performance of logistics firms in Turkey.
The results of different research studies reveal that the performance ranking may change in accordance with the weighting of the criteria employed.
The performance evaluation of firms may depart from objectivity and reliability in case of misapplication of weighting. Therefore, selecting and employing a convenient criteria-weighting MCDM method is the key process for achieving a reliable performance evaluation.
91
Furthermore, we assess that the lack of nonfinancial criteria is a critical shortcoming of the existing literature on performance evaluation. However, considering that the reported aim of the researchers is only limited to evaluate the financial performance of the companies, this shortcoming may be tolerated to some degree.6. Data And Methodology
We use panel data regression techniques to estimate the relation between working capital management and firm performance. A panel data set of Turkish listed logistics companies for 10 years is employed in this research study. The full data set covers 57 firm-years of eight logistics firms for the period 2009 to 2018. In some years, some firms’ data is missing since they are not listed for the related years. Thus, we obtain unbalanced panel data. The data is obtained from the web sites of the companies and the Public Disclosure Platform (www.kap.gov.tr), which is administrated by the Capital Markets Board of Turkey and the Borsa Istanbul.
7. Variables and Summary Statistics
Table 1 provides the definitions of the variables used in the analysis. We define and measure NWC as follows (Afrifa, 2016; Aktas et al, 2014; Hill et al, 2010).
NWC = (receivables / sales) + (inventory / sales) – (payables / sales) (1)
In this formula, NWC is a function of sales. The less the NWC, the shorter the CCC. It measures the efficiency of working capital management. We use ROA for measuring corporate profitability and it shows operational performance. MB is a measure for market valuation and it shows stock performance. Cash holdings are actually one of the components of working capital. However, they are not considered as a component of operational working capital. Thus, NWC is independent variable, ROA and MB are dependent variables, and the others are control variables.
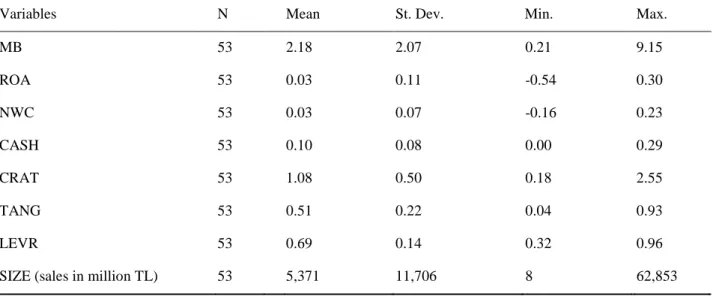
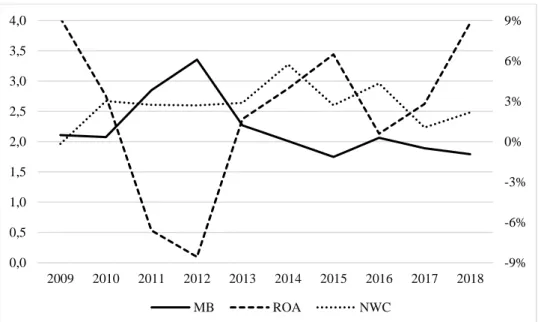
Table 2 presents the summary statistics of the data used in the study. Figure 1 depicts some selected variables’ means including MB, ROA and NWC in the period 2009 to 2018. Through the ten years, market to book value of logistics companies ranges between 1.75 and 3.35, and is averagely over 2.0. Returns are positive except two years (2011 and 2012). If we ignore these two years, net earnings as a percentage of total assets range between 0.6 and 9.2. Considering the negative return years, the mean ROA is 2.2 percent. NWC values, as percentage of sales, range between 1.0 and 5.7, and the mean value is 3.0 in the period from 2010 to 2018. NWC is negative only in one year, most probably due to the great financial crisis in 2009. The average returns reported here should be compared to the other sectors’ averages to assess the overall return of the logistics industry. This type of financial analysis is beyond the scope of our research study. Yet, in order to provide a benchmark, we note that Aktas et al (2015) reported 5.1 % for 2011 for the US transportation companies.
The variables in the model should be stationary because presence of a unit root may cause problems and invalidate the results of regression models.
We run Fisher-ADF and Fisher-PP tests to test for the stationarity of the variables. The null hypothesis for the Fisher tests is that all the panels contain unit roots. The alternative hypothesis is that at least one panel is stationary.
92
Table 3 shows the panel unit root results. According to the results, we reject the null hypothesis for the variables other than CRAT and TANG. Thus, we derive the first differences of the mentioned variables to provide stationarity before constructing an estimation model.
Table 1. Variables
Variables Codes Definition
Expected Sign
Market to book value MB Market price over equity book value
Dependent Var.
Return on assets ROA Net profit over total assets
Dependent Var.
Net working capital NWC
Account receivables plus inventory minus accounts payable over sales
-
Cash holdings CASH Cash over total assets -,+
Current Ratio CRAT Current assets over short term liabilities -,+
Tangible Assets TANG Tangible assets over total assets -,+
Financial leverage LEVR
Short term and long term liabilities over total assets
-,+
Size SIZE Natural logarithm of total sales -,+
Table 2. Summary Statistics
Variables N Mean St. Dev. Min. Max.
MB 53 2.18 2.07 0.21 9.15 ROA 53 0.03 0.11 -0.54 0.30 NWC 53 0.03 0.07 -0.16 0.23 CASH 53 0.10 0.08 0.00 0.29 CRAT 53 1.08 0.50 0.18 2.55 TANG 53 0.51 0.22 0.04 0.93 LEVR 53 0.69 0.14 0.32 0.96
93
Figure 1. Average MB, ROA and NWC of the Logistics Industry by Years Table 3. Panel Unit Root Test Results
Variables Fisher-PP chi-squared p-value Fisher-ADF chi-squared p-value MB 27.4752 0.0167 83.4769 0.0000 ROA 28.2000 0.0299 16.4775 0.0285 NWC 62.1866 0.0000 8.4640 0.0863 CASH 147.0385 0.0000 25.3971 0.0308 CRAT 18.3022 0.3065 35.4132 0.0035 LEVR 57.9554 0.0000 94.3349 0.0000 SIZE 15.7998 0.0325 0.4452 0.0041 TANG 29.1750 0.0099 8.1504 0.8813
8. Constructing the Hypotheses and the Model
We aim to examine the relationship between working capital and financial performance of the logistics firms. Financial performance refers to both corporate profitability and stock performance as we explained earlier. In our model, corporate profitability is proxied by ROA, and stock performance is proxied by MB. Thus, considering the most of the previous research studies, we construct the hypotheses as follows.
H1. Working capital and profitability of a logistics firm relate negatively.
H2. Working capital and market valuation of a logistics firm relate negatively.
Accordingly, we expect a negative association between NWC and ROA, and again a negative association between NWC and MB. Following the literature, we consider cash holdings, firm size and financial leverage as control variables (Aktas et al, 2015).
-9% -6% -3% 0% 3% 6% 9% 0,0 0,5 1,0 1,5 2,0 2,5 3,0 3,5 4,0 2009 2010 2011 2012 2013 2014 2015 2016 2017 2018 MB ROA NWC
94
Moreover, we use another control variable, tangible assets (TANG), which assesses the investments in tangible assets to see the impact of investing in tangible assets rather than working capital, as some researchers did (Afrifa, 2016; Deloof, 2003; Garcia-Teruel and Martinez-Solano, 2007; Hill et al, 2010). The variables are defined and coded as presented in Table 1. The expected signs are from the common literature. The impacts of cash holdings, current ratio, investing in tangible assets, leverage and firm size on performance are controversial in the literature. The estimation models are as follows.
Model 1a: 𝑅𝑂𝐴𝑖,𝑡= 𝛼 + 𝛽𝑁𝑊𝐶𝑖,𝑡+ 𝛾𝐶𝑜𝑛𝑡𝑟𝑜𝑙𝑠𝑖,𝑡+ 𝜀𝑖,𝑡 , (2) Model 2a: 𝑀𝐵𝑖,𝑡= 𝛼 + 𝛽𝑁𝑊𝐶𝑖,𝑡+ 𝛾𝐶𝑜𝑛𝑡𝑟𝑜𝑙𝑠𝑖,𝑡+ 𝜀𝑖,𝑡 , (3)
Moreover, we construct the models in which some variables are lagged by one period in order to determine whether those variables are associated with the dependent variables with a time lag.
Model 1b: 𝑅𝑂𝐴𝑖,𝑡= 𝛼 + 𝛽𝑁𝑊𝐶𝑖,𝑡−1+ 𝛾𝐶𝑜𝑛𝑡𝑟𝑜𝑙𝑠𝑖,𝑡−1+ 𝜀𝑖,𝑡 , (4) Model 2b: 𝑀𝐵𝑖,𝑡= 𝛼 + 𝛽𝑁𝑊𝐶𝑖,𝑡−1+ 𝛾𝐶𝑜𝑛𝑡𝑟𝑜𝑙𝑠𝑖,𝑡−1+ 𝜀𝑖,𝑡 , (5)
9. Empirical Tests and Analysis
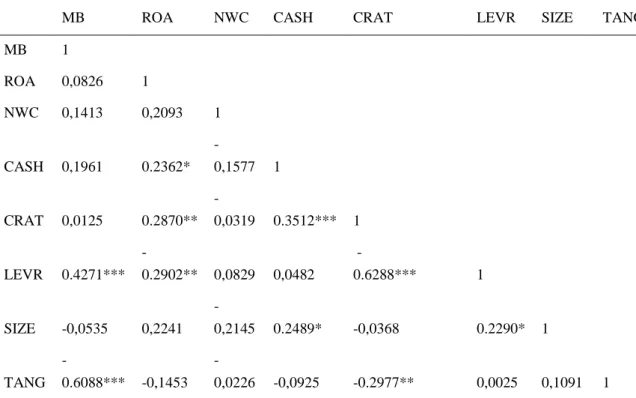
We perform Pearson’s correlation test for a preliminary view on the relations between the variables. Table 4 presents the correlation results. NWC is not correlated with any variables in contrary to our expectations. ROA is significantly correlated with cash holdings, current ratio and leverage. MB is significantly correlated with leverage and tangible assets at 1% percent level. According to the correlation coefficients and significance levels, the strongest correlations are between LEVR and CRAT; and TANG and MB at 1% percent level. These results suggest that higher levels of debts cause firm’s current ratio to decrease. Increasing tangible assets investments are associated with decreasing market valuation.
We try to estimate the performance of logistics firms with a longitudinal study. In such studies, initially researchers should determine whether the model suits to the fixed effects or random effects model (Greene, 2012). For this purpose, we perform Hausman tests. The results of the tests demonstrate that fixed effects regression model explains the estimations better than random effects model.
A good estimation model should be robust to heteroscedasticity and autocorrelation problems (Greene, 2012). After regressing the model, we tested for the presence of heteroscedasticity with Modified Wald test; and autocorrelation with modified Bhargava et al and DW test. Since we detected the mentioned problems, we employed robust standard errors in the four models.
95
Table 4. Pearson Correlation Coefficients
MB ROA NWC CASH CRAT LEVR SIZE TANG
MB 1 ROA 0,0826 1 NWC 0,1413 0,2093 1 CASH 0,1961 0.2362* -0,1577 1 CRAT 0,0125 0.2870** -0,0319 0.3512*** 1 LEVR 0.4271*** -0.2902** 0,0829 0,0482 -0.6288*** 1 SIZE -0,0535 0,2241 -0,2145 0.2489* -0,0368 0.2290* 1 TANG -0.6088*** -0,1453 -0,0226 -0,0925 -0.2977** 0,0025 0,1091 1
*, **, *** indicates statistical significance at the 10%, 5% and 1% respectively.
10. Empirical Results
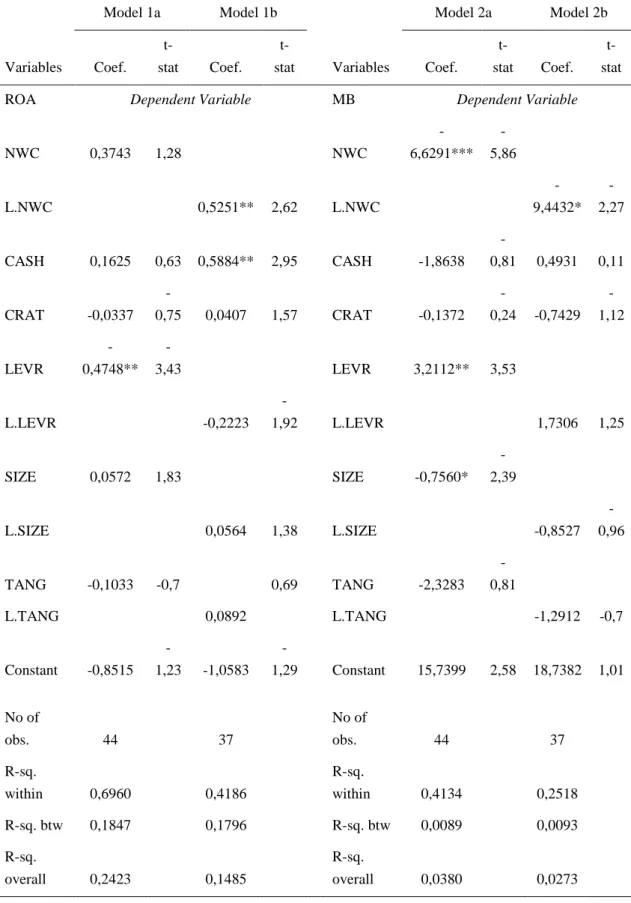
Table 5 shows the robust regression results for the effect of NWC on profitability and market valuation. In Model 1a and 1b, we found that NWC does not have a statistically significant relationship with ROA. In Model 1a, the only significant variable is leverage and it has a negative relationship with profitability. Interestingly, lagged NWC and lagged cash reserves relate to profitability positively in Model 1b. NWC and lagged NWC is also found statistically significant and negative in the model (Model 2a and 2b), in which market valuation is dependent variable. These results suggest that lagged NWC has an impact both on profitability and on market valuation. More interestingly, leverage relates to market valuation positively (in Model 2a) while it relates to profitability negatively. Furthermore, size has a negative impact on market valuation. The results of Model 1 may seem not very consistent with the regression results of Model 2. The correlation coefficients presented in Table 4 are substantially consistent with the regression results. According to the correlation coefficients, leverage is positively correlated to MB, but negatively related to ROA.
The regression results support the hypothesis H2. Both NWC and lagged NWC have negative effect on market valuation. H1 is not supported. NWC is not associated with profitability; however lagged NWC has a positive effect on profitability in contrary to the expectation. We try to explain these results and present a justification in the conclusion.
96
Table 5. Regression Results
Model 1a Model 1b Model 2a Model 2b
Variables Coef.
t-stat Coef.
t-stat Variables Coef.
t-stat Coef. t-stat
ROA Dependent Variable MB Dependent Variable
NWC 0,3743 1,28 NWC -6,6291*** -5,86 L.NWC 0,5251** 2,62 L.NWC -9,4432* -2,27 CASH 0,1625 0,63 0,5884** 2,95 CASH -1,8638 -0,81 0,4931 0,11 CRAT -0,0337 -0,75 0,0407 1,57 CRAT -0,1372 -0,24 -0,7429 -1,12 LEVR -0,4748** -3,43 LEVR 3,2112** 3,53 L.LEVR -0,2223 -1,92 L.LEVR 1,7306 1,25 SIZE 0,0572 1,83 SIZE -0,7560* -2,39 L.SIZE 0,0564 1,38 L.SIZE -0,8527 -0,96 TANG -0,1033 -0,7 0,69 TANG -2,3283 -0,81 L.TANG 0,0892 L.TANG -1,2912 -0,7 Constant -0,8515 -1,23 -1,0583 -1,29 Constant 15,7399 2,58 18,7382 1,01 No of obs. 44 37 No of obs. 44 37 R-sq. within 0,6960 0,4186 R-sq. within 0,4134 0,2518 R-sq. btw 0,1847 0,1796 R-sq. btw 0,0089 0,0093 R-sq. overall 0,2423 0,1485 R-sq. overall 0,0380 0,0273
97
11. Conclusion
In this study, we investigated the impact of working capital management on the performance of logistics companies with Turkish listed logistics companies’ data. The impact of NWC on performance of a company is generally found negative in the literature while some research finds the inverse or no relation.
The results of this study shows that there is no significant relationship between NWC and profitability of logistics firms; however, lagged NWC has a positive relation with profitability. The results show that logistics firms may increase profitability by increasing the average collection period and that less profitable logistics firms wait longer to pay their bills. Paying the bills on time or before due date for getting discounts may increase profitability. On the other side, logistics firms increase their fees, hence, earnings through extending trade credits to customers. Yet, the positive relation between working capital, liquidity and profitability is not very clear.
Another finding is that an increase in working capital and size is associated with a decrease in market valuation of a company. That means investors percept smaller companies and less working capital more value driver. Investors’ perception is towards negative relation between working capital and performance of a company. In other words, investors believe that high performance firms wait longer to pay their bills. Another contradictory result is related to the impact of leverage. According to the regression results, leverage has a negative impact on profitability, but a positive impact on market valuation of a company. We explain these results similarly. Companies with higher leverage ratios make less returns probably due to the finance costs. In the viewpoints of investors, the companies that can easily access to debt markets and borrow are more valuable. The results suggest that leveraged companies are more likely to obtain less return or to suffer from losses; however, leverage enhances market value of logistics companies.
We interpret that these paradoxical results between ROA and MB models show the gap between the facts and the perceptions of the investors. However, considering the limitations related to the research period and the number of listed logistics firms, the results should be interpreted with some caution.
References
Afrifa, G.A. (2016). Net working capital, cash flow and performance of UK SMEs. Review of Accounting and Finance, 15(1), 21-44.
Aktas, N., Croci, E., & Petmezas, D. (2015). Is working capital management value-enhancing? Evidence from firm performance and investments. Journal of Corporate Finance, 30, 98-113.
Altaf, N., & Shah, F. (2017). Working capital management, firm performance and financial constraints. Asia-Pacific Journal of Business Administration, 9(3), 206-219.
Autukaite, R., & Molay, E. (2011). Cash holdings, working capital and firm value: evidence from France. Working paper, SSRN.
98
Ayaydın, H., Durmuş, S., & Pala, F. (2017). Gri ilişkisel analiz yöntemiyle Türk lojistik firmalarında performans ölçümü. Gümüşhane Üniversitesi Sosyal Bilimler Enstitüsü, 8(21), 76-94.
Banos-Caballero, S., Garcia-Teruel, P.J., & Martinez-Solano, P. (2012). How does working capital management affect the profitability of Spanish SMEs? Small Business Economics, 39(2), 517-529.
Banos-Caballero, S., Garcia-Teruel, P. J., & Martinez-Solano, P. (2014). Working capital management, corporate performance, and financial constraints. Journal of Business
Research, 67(3), 332-338.
Bhunia, A., & Das, A. (2012). Affiliation between working capital management and profitability. Interdisciplinary Journal of Contemporary Research in Business, 3(9), 957-968.
Brealey, R.A., Myers, S.C., & Allen, F. (2014). Principles of Corporate Finance. 11th ed. New York: McGraw-Hill, Irwin.
Brigham, E.F., & Ehrhardt, M.C. (2013). Financial Management: Theory & Practice. 14th ed. USA: Cengage Learning.
Chiou, J.R., Cheng, L., & Wu, H.W. (2006). The determinants of working capital management.
Journal of American Academy of Business, 10(1), 149-155.
Coşkun, E., & Kök, D. (2011). Çalışma sermayesi politikalarının karlılık üzerine etkisi: dinamik panel uygulaması. Ege Akademik Bakış, 11, 75-85.
Çakır, M.H., & Küçükkaplan, İ. (2012). İşletme sermayesi unsurlarının firma değeri ve kârlılığı üzerindeki etkisinin İMKB’de işlem gören üretim firmalarında 2000-2009 dönemi için analizi. Muhasebe ve Finansman Dergisi, 53, 69-86.
Çakır, S., & Perçin, S. (2013). Çok kriterli karar verme teknikleriyle lojistik firmalarında perfor-mans ölçümü. Ege Akademik Bakış, 13(4), 449-459.
Çelik, İ., & Boyacıoğlu, N. (2013). The impact of fixed assets expenditures on working capital management: an application on manufacturing enterprises in Istanbul Stock Exchange.
Journal of Süleyman Demirel University Institute of Social Sciences, 17, 81-99.
Deloof, M. (2003). Does working capital management affect profitability of Belgian firms?
Journal of Business Finance and Accounting, 30(3/4), 573-588.
Deran, A., & Erduru, İ. (2018). Karayolu ve denizyolu yük taşımacılığı sektörlerinin finansal performans analizi: Türkiye Cumhuriyet Merkez Bankası sektör bilançoları üzerine bir araştırma. Muhasebe ve Vergi Uygulamaları Dergisi, 11(3), 479-503.
Dinçergök, B. (2019). İşletme sermayesi yönetimi ve karlılık ilişkisi: doğrusal olmayan ilişkinin BIST kimya, petrol, kauçuk ve plastik ürünler sektöründe sınanması. Muhasebe ve
Finansman Dergisi, 82, 161-176.
Fazzari, S., Hubbard, R.G., & Petersen, B. (1988). Financing constraints and corporate investment. Brookings Papers on Economic Activity, 1, 141-195.
Garcia-Teruel, P.J., & Martinez-Solano, P. (2007). Effects of working capital management on SME profitability. International Journal of Managerial Finance, 3(2), 164-177. Ganesan, V. (2007). An analysis of working capital management efficiency in
telecommunication equipment industry. Rivier Academic Journal, 3(2), 1-10.
Gill, A., Biger, N., & Mathur, N. (2010). The relationship between working capital management and profitability: evidence from the United States. Business and Economics Journal, 1, BEJ-10.
Greene, W.H. (2012) Econometric Analysis. 7th ed. Boston: Prentice Hall.
Hill, M.D., Kelly, G.W., & Highfield, M.J. (2010). Net operating working capital behavior: a first look. Financial Management, 39(2), 783-805.
Jose, M., Lancaster, C., & Stevens, J. (1996). Corporate returns and cash conversion cycles.
99
İltaş, Y. (2016). Türkiye Cumhuriyet Merkez Bankası sektör bilançolarını kullanarak işletme sermayesi gereksinimini etkileyen değişkenler üzerine bir analiz: 1996-2013. ErciyesÜniversitesi İktisadi ve İdari Bilimler Fakültesi Dergisi, 48, 123-143.
Karaduman, H.A., Akbas, H.E., Caliskan, A.O., & Durer, S. (2011). The relationship between working capital management and profitability: evidence from an emerging market.
International Research Journal of Finance and Economics, 62, 61-67.
Kieschnick, R.L., Laplante, M., & Moussawi, R. (2011). Working capital management and shareholder wealth. Working Paper, SSRN.
Martínez-Sola, C., García-Teruel, P., & Martínez-Solano, P. (2013). Trade credit policy and firm value. Accounting and Finance. 53(3), 791-808.
Nobanee, H., Abdullatif, M., & AlHajjar, M. (2011). Cash conversion cycle and firm’s performance of Japanese firms. Asian Review of Accounting, 19(2), 147-156. Öner, M. (2016). The impact of working capital management on firm profitability: empirical
evidence from Borsa Istanbul. Siyaset, Ekonomi ve Yönetim Araştırmaları Dergisi, 4(3), 63-79.
Öz, Y., & Güngör, B. (2007). Çalışma sermayesi yönetiminin firma karlılığı üzerine etkisi: imalat sektörüne yönelik panel veri analizi. Atatürk İktisadi ve İdari Bilimler Dergisi, 10(2), 1-14.
Özbek, A., & Demirkol, İ. (2018). Lojistik sektöründe faaliyet gösteren işletmelerin SWARA ve GİA yöntemleri ile analizi. Kırıkkale Üniversitesi Sosyal Bilimler Dergisi, 8(1), 71-86
Raheman, A., Talat, A., Qayyum, A., & Bodla, M.A. (2010). Working capital management and corporate performance of manufacturing sector in Pakistan. International Research
Journal of Finance and Economics, 47, 151-163.
Sharma, A.K., & Kumar, S. (2011). Effect of working capital management on firm profitability empirical evidence from India. Global Business Review, 12(1), 159-173.
Shin, H.H., & Soenen, L. (1998). Efficiency of working capital management and corporate profitability. Financial Practice and Education, 8, 37–45.
Singhania, M., & Mehta, P. (2017). Working capital management and firms’ profitability: evidence from emerging Asian countries. South Asian Journal of Business Studies, 6(1), 80-97.
Şamiloğlu, F., & Demirgüneş K. (2008). Effect of working capital management on firm profitability: Evidence from Turkey. The International Journal of Applied Economics
and Finance, 2(1), 44-50.
Tufan, C., & Kılıç, Y. (2019). Borsa İstanbul’da işlem gören lojistik işletmelerinin finansal performanslarının TOPSIS ve VIKOR yöntemleriyle değerlendirilmesi. C.Ü. İktisadi
ve İdari Bilimler Dergisi, 20(1), 119-137.
Wang, Y.J. (2002). Liquidity management, operating performance, and corporate value: evidence from Japan and Taiwan. Journal of Multinational Financial Management, 12(2), 159-169.
Yücel, T., & Kurt, G. (2002). Nakit dönüş süresi, nakit yönetimi ve karlılık: İMKB şirketleri üzerinde ampirik bir çalışma. İMKB Dergisi, 6(22), 1-15.