T.C. DOĞUŞ UNIVERSITY
INSTITUTE OF SCIENCE AND TECHNOLOGYENGINEERING AND TECHNOLOGY MANAGEMENT DEPARTMENT
DETECTION OF DEBIT CARD FRAUD
THROUGH RANDOM FOREST
Master Thesis
Kasım AKSOY
201199013
Advisor: Mesut KUMRU
T.C. DOĞUŞ UNIVERSITY
INSTITUTE OF SCIENCE AND TECHNOLOGYENGINEERING AND TECHNOLOGY MANAGEMENT DEPARTMENT
DETECTION OF DEBIT CARD FRAUD
THROUGH RANDOM FOREST
Master Thesis
Kasım AKSOY
201199013
Advisor
Prof. Dr. Mesut KUMRU
Jury
Assoc. Prof. Dr. Ali Fuat ALKAYA
Assist. Prof. Dr. Kıvanç ONAN
i
PREFACE
First of all, I would like to thank to my advisor Professor Mesut KUMRU for his patience and academic guidance. My director and my colleagues have encouraged me to complete my thesis. Finally, I want to express my sincere gratitude to my family for their support.
ii
ÖZET
Günlük hayatımızda en sık kullandığımız finansal araçlardan olan ATM’ler, kullanıma geçtikleri tarihten itibaren aynı sıklıkla dolandırıcıların hedefi olagelmiştir. Özellikle manyetik bant kullanılarak üretilen ATM kartlarının (debit kart) güvenlik açıkları dolandırıcılar tarafından bir fırsat olarak görülmüştür. Bu güvenlik açıkları istismar edilerek gerçekleştirilen kart kopyalama vakaları sonucu müşteri hesaplarından önemli miktarda dolandırıcılık yapılmıştır. Bu tez çalışmasında, bir bankaya ait ATM nakit çekim işlem verisi kullanılarak ATM kartı dolandırıcılıklarının tespit edilmesi için bir model ortaya konulmuştur. Öncelikle ATM nakit çekim işlem veri setinde dolandırıcılık tespiti ile ilgili olabileceği düşünülen işlem değişkenleri tespit edilmiştir. Akabinde, bu değişkenler üzerinden literatürde dolandırıcılık tespitinde kullanılabileceği belirtilen RFM (Recency-Yakınlık, Frequency-Sıklık, Monetary-Parasal büyüklük) değişkenleri hesaplanmıştır. İkinci adımda RFM değişkenleri ve nakit çekim işlem değişkenleri kullanılarak rastgele orman algoritması ile bir sınıflandırma modeli oluşturulmuştur. Üçüncü olarak oluşturulan sınıflandırma modeli algoritmanın farklı parametreleriyle test edilmiştir. Çalışmanın sonuç kısmında hazırlanan modelin sonuçları tartışılmış ve pratik uygulamalar ışığında gerçek zamanlı bir ATM kartı dolandırıcılık tespit sistemi kurulması konusunda bazı değerlendirmeler sunulmuştur.
iii
SUMMARY
As one of the most frequently used financial tools in our life, ATMs have become a target for fraudsters in the same frequency. Particularly, security vulnerabilities of debit cards, which are generally produced by using magnetic stripes, was seen as an opportunity for fraud. As a result of exploiting those security vulnerabilities, important amounts have been fraudulently withdrawn from customer accounts. In this thesis, a data mining model was established for detection of debit card fraud through debit card transaction data of a bank. Firstly, transaction variables were defined in the ATM cash withdrawal dataset with consideration of their relevance in the debit card fraud detection. Consequently, behavioral RFM (Recency, Frequency, Monetary) variables, which are suggested as relevant in debit card fraud detection literature, were calculated based on those transaction variables. Secondly, several experiments were made through the classification model created by random forest algorithm by changing algorithm parameters. In the concluding remarks, the results of the established model were summarized and, considering practical implementations, some assessments regarding a real-time debit card fraud detection system were made.
iv
CONTENTS
S PREFACE ... i ÖZET ... ii SUMMARY ... iii CONTENTS ... iv LIST OF TABLES ... v LIST OF FIGURES ... vi INTRODUCTION ... 71. UNDERSTANDING PLASTIC CARD FRAUD ... 9
1.1. Definitions of Fraud ... 9
1.2. Fraud Classification ... 10
1.3. Cost of Fraud ... 11
1.4. Plastic Card Fraud ... 12
1.4.1. Debit Cards, Credit Cards and ATMs ... 12
1.4.2. Realization of ATM Cash Withdrawals ... 13
1.4.3. Fraud Schemes in ATM Transactions ... 14
2. DETECTING FRAUD THROUGH DATA MINING ... 17
2.1. Rule-Based (Expert-Based) Fraud Detection ... 17
2.2. Data Mining ... 18
2.2.1. The Process of Fraud Data Mining ... 20
2.2.2. Preprocessing in data mining ... 21
2.2.3. Descriptive analytics-unsupervised learning ... 26
2.2.4. Predictive analytics-supervised learning ... 30
2.2.5. Other techniques ... 37
2.2.6. Challenges and Success Factors of Fraud Detection ... 38
2.2.7. Deciding to Establish a Fraud Detection System ... 40
2.3. Literature review ... 40
2.3.1. Surveys of Data-Driven Fraud Detection ... 41
2.3.2. Important Researches in the Plastic Card Fraud Detection ... 44
3. DEBIT CARD FRAUD DETECTION THROUGH RANDOM FOREST ... 51
3.1. Rationale of Detection of Fraudulent Debit Card Transactions ... 51
3.2. Dataset and Variables ... 52
v
3.3.1. Choosing the Appropriate Classifier for Card Fraud Detection Problem ... 55
3.3.2. Determining Performance Measures ... 57
3.4. Experiments on Random Forest Classification Model ... 58
3.4.1. Impact of Training Dataset Size and Subsampling ... 59
3.4.2. Impact of Number of Trees and Number of Variables ... 60
3.4.3. Impact of Subsampling Parameters ... 61
3.5. Importance of Variables ... 62
4. Conclusion ... 66
4.1. Training Dataset Size and Formation ... 66
4.2. Stratified Sampling... 66
4.3. RFM Variables and Variable Importance ... 67
4.4. Other Random Forest Implementations and Parameters ... 68
4.5. Robustness and Performance Metrics of Random Forest Models ... 68
4.6. Practical Implementation of Debit Card Fraud Detection ... 69
REFERENCES ... 71
APPENDICES ... 75
Appendix-1: Manual of RandomForest Formula ... 75
Appendix-2: Importance of Variables in the Base Scenario ... 78
LIST OF TABLES
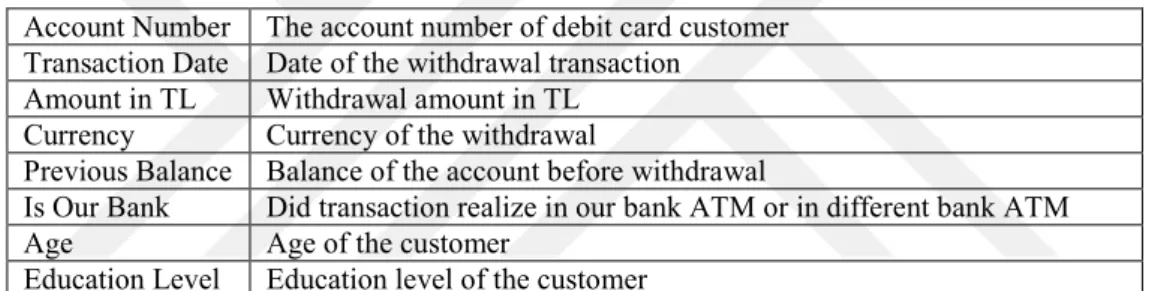
Table 1.1. Fraud taxonomies ... 10Table 3.1. Original fields in the dataset ... 52
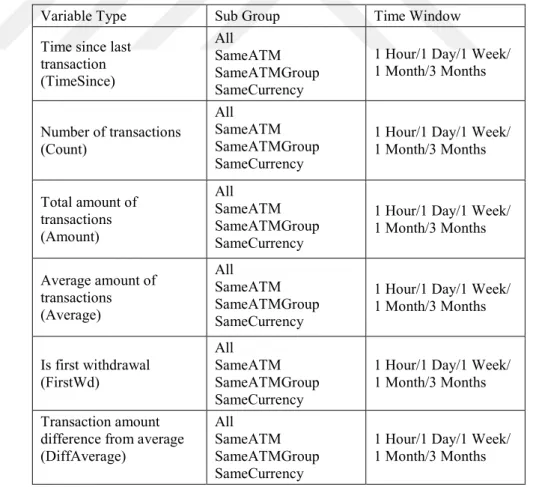
Table 3.2. Systematic RFM variables used in the model ... 53
Table 3.3. Ad-hoc RFM variables ... 54
Table 3.4. Information about training and test datasets ... 55
Table 3.5. Performance statistics of random forest models ... 57
Table 3.6. Parameters used in experimental setup ... 58
Table 3.7. Impact of changing training percentage on random forest model performance . 59 Table 3.8. Impact of changing training percentage with subsampling ... 59
Table 3.9. Impact of changes in number of trees and variables on performance ... 60
vi
LIST OF FIGURES
Figure 2.1. Process of data mining ... 21
Figure 2.2. First leading digit distribution according to Benford’s Law ... 23
Figure 2.3. Outlier values in a 2-D scatter gram. ... 24
Figure 2.4. 3-D cube representation of sales data ... 27
Figure 2.5. Iteration steps in k-means clustering ... 29
Figure 2.6. A part of decision tree predicting employee fraud ... 32
Figure 2.7. Multilayer feed-forward neural network ... 32
Figure 2.8. A two-dimensional support vector machine representation ... 33
Figure 2.9. Sample ROC curve comparing two models ... 36
Figure 3.1. 20 most important variables found by the algorithm ... 62
Figure 3.2. Performance of RF models (TPR10F) with main variable groups ... 63
Figure 3.3. Performance of RF models (TPR10F) with systematic RFM variable types .... 64
Figure 3.4. Performance of RF models (TPR10F) with RFM variable sub-groups ... 65
7
INTRODUCTION
Since their inception in 1960’s, it is not an exaggeration to say that ATMs have revolutionized the way we reach money. They made it possible to withdraw money without limitations of working hours. Albeit slowed in some regions of the world due to saturation, the large-scale adoption of ATMs continues with enhanced features derived from technological innovations.
As with any financial instrument, ATMs were subject to the wrongdoings of fraudsters since their launch in the market. Through various methods including skimming magnetic stripe or capturing the card, fraudsters not only cause financial losses for the bank, but also endanger customer confidence.
In this thesis, we aim to establish a model for the detection of fraudulent cash withdrawals from ATMs. In the first section, we gave a brief definition of fraud and provided concise explanations regarding frequent types of frauds. We also gave more detail for plastic card fraud.
In the second section, various data mining methods utilized in the fraud detection are summarized and important considerations in their usage are delineated. The challenges of detecting fraud through data mining or data analysis were also explained. In the second part of that section, a review of literature with regard to the usage of data mining techniques in fraud detection was undertaken.
In the last section, the debit card fraud data of a bank for a given period is examined and relevant and available transaction variables are defined. Based on those transaction variables, new behavioral variables were devised based on RFM (recency, frequency and monetary) feature extraction/aggregation. Those variables were computed for our dataset. Consequently, our dataset was divided between training and test portions. Finally, a model was established through random forest algorithm and several experiments were designed and implemented for understanding the impact of parameter and stratified sampling changes on the model’s prediction performance.
In our concluding remarks, we discussed the results of our experiments and limitations of the produced model. Recommendations were also provided for future research. Finally,
8
based on the established model and practical requirements, some assessments were made regarding a real-time debit card fraud detection system.
9
1. UNDERSTANDING PLASTIC CARD FRAUD
Used in such diverse fields as credit card, insurance, plagiarism, fraud is a popular phenomenon which takes many forms in different fields. In this section, we will give some of the definitions of fraud and introduce various forms of fraud with special emphasis on plastic card fraud.
1.1. Definitions of Fraud
Many definitions of fraud were made to emphasize different dimensions of the misconducts. In this section, we will mention some of the prominent fraud definitions and explore the similarities in the definitions. According to the Institute of Internal Auditors, IAA, fraud is
“Any illegal acts characterized by deceit, concealment, or violation of trust. These acts are not dependent upon the application of threat of violence or of physical force. Frauds are perpetrated by individuals and organizations to obtain money, property, or services; to avoid payment or loss of services; or to secure personal or business advantage “(Institute of Internal Auditors, 2016).
According to the Association of Certified Fraud Examiners, ACFE, fraud includes “any intentional or deliberate act to deprive another of property or money by guile, deception, or other unfair means” (ACFE, 2016). Violations can range from asset misappropriation, fraudulent statements and corruption over pilferage and petty theft, false overtime and using company property for personal benefit to payroll and sick time abuses (Jans et al., 2006).
According to Baesens et al. (2015), “Fraud is an uncommon, well considered, imperceptibly concealed, time-evolving and often carefully organized crime which appears in many types and forms.” (Baesens et al., 2015)
According to Vona, fraud is “Acts committed on the organization or by the organization or for the organization. The acts are committed by an internal or external source and are intentional and concealed. The acts are typically illegal or denote wrongdoing, such as in the cases of: financial misstatement, policy violation, ethical lapse, or a perception issue. The acts cause a loss of company funds, company value, or company reputation, or any unauthorized benefit whether received personally or by others” (Vona, 2008).
The significant points of definitions may be listed as follows:
10 b. Contains deceit or concealment, not violence c. Intentional, not erroneous
d. May have many forms
e. Evolves in time, thus, it is similar to cat and mouse game (Baesens et al., 2015) f. Involves illegal actions or wrongdoings
In several contexts, other concepts may have used as synonyms of fraud. For instance (PwC, 2016) introduces economic crimes and (Ernst & Young, 2016) introduces corporate misconduct as quite similar to fraud definition. In this thesis, we have used fraud as the overarching concept for all such similar terms.
1.2. Fraud Classification
Disguising in many different misconducts, a nonexhaustive list of fraud includes credit card fraud, insurance fraud, corruption, counterfeit, product warranty fraud, healthcare fraud, telecommunications fraud, money laundering, click fraud, identity theft, tax evasion, plagiarism and embezzlement (Baesens et al., 2015).
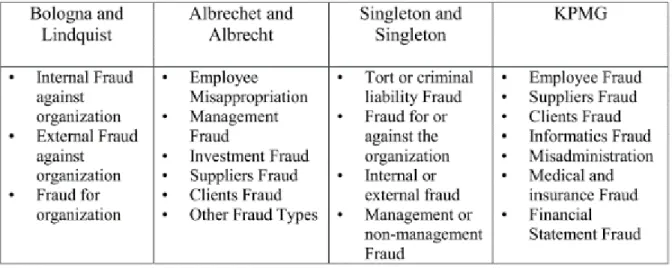
According to ACFE, fraud can be realized against an organization or against an individual. Fraud against an organization can be committed by internal actors like employees, managers, officers or owners. On the other hands, external factors like customers, vendors and other parties may also commit fraud against organization (ACFE, 2016). In the following table, some of the fraud classifications made by different authors are given.
Table 1.1. Fraud taxonomies
11
Internal Fraud, also known as occupational fraud, is defined as “the use of one’s occupation for personal enrichment through the deliberate misuse or misapplication of the organization’s resources or assets”. External fraud, on the other hand, includes many schemes perpetrated by vendors, customers and unknown third parties to unlawfully gather any kind of resources (ACFE, 2016). In this study, we will focus on debit card fraud, which is mainly an external fraud type.
1.3. Cost of Fraud
As a global problem, fraud inflicts huge losses to the victims, which includes individuals, enterprises or the government. Hence, the cost of fraud affects all society. Although it is impossible to measure the amount of losses precisely, some recent numbers suggest that
A typical organization loses 5 percent of its revenue to fraud each year. The total cost of insurance fraud (excluding medical insurance) in the US is
estimated to be more than 40 billion USD per year. The cost of fraud in the UK is 73 billion pound each year
Credit card companies lose 7 cents for each 100 dollar transaction (Baesens et al., 2015).
The reports generally mention an increasing fraud tendency in many fields. Part of this increase can be attributed to the development of information technologies, particularly internet and mobile technologies.
In terms of losses associated with deposit account fraud, Deposit Account Survey of American Banking Association gives us some clues. According to the report, the cost of demand deposit account (DDA) fraud in the USA at 2014 is about USD 1.9 billion, with a distribution of debit card fraud (66%), check fraud (32%) and online banking (2%) (Kenneally et al., 2016). According to the study, the fraud amount has increased since the previous survey which is held at 2012. The survey also suggests that 74% of respondents think that the increase in fraud cases is linked to increase in fraud attempts.
Beside financial losses incurred by companies, fraud also have detrimental impacts on societies (Vona, 2008). The costs of fraud are directly reflected to the prices charged by the firms. Another dimension of the negative impacts of fraud is related with the frequent linkage between fraudulent transactions and illicit activities such as drug trafficking and organized crime (West & Bhattacharya, 2016).
12
1.4. Plastic Card Fraud
In our thesis, we will establish a model for debit card fraud detection. Debit cards and credit cards (plastic cards) are issued by the banks to enable cash withdrawal on 7/24 basis from ATMs and making purchases through POS (point of sale) devices in online or on-site merchants. In this section, we will briefly explain the operations of debit cards and credit cards. Later, we will explore most common fraud schemes encountered in plastic cards.
1.4.1. Debit Cards, Credit Cards and ATMs
A debit card or bank card is a plastic payment card issued by a financial institution to enable customers to withdraw cash from their accounts and to make purchases. Any purchase or cash withdrawal made through debit card is debited to the customer account. Hence, in principle, it is not possible to use the card more than the available balance of the customer account. There are various types of debit cards including online (EFTPOS), offline and electronic purse card. Online debit cards directly communicate with the bank to check account balance. The payments made via offline debit cards, on the other hand, are reflected to bank account within a few days. Electronic purses have chips which store the account balance info and hence they need no network connectivity in POS devices (Wikipedia, 2017c).
In general, payment cards that have the ability to withdraw cash from ATMs are named as ATM cards. In that sense, performing basic banking operations like withdrawal in ATM is another important function of debit cards. Credit cards may also be used to withdraw money from bank accounts (Wikipedia, 2017a).
A credit card is a type of payment card issued to cardholders to enable them to pay a merchant for goods and services. This service is based on the cardholder's promise to the card issuer to pay them for the purchased amounts. The issuers of credit cards generally extend a line of credit to the customer for purchases or cash advances. A charge card, on the other hand, requires the balance to be repaid in full each month (Wikipedia credit card).
Mainly, credit cards and debit cards may be used in three different ways: ATM, POS- Card Present (CP) and POS- Card Not Present (CNP) transactions. POS-CP transactions are conducted on physical POS devices in the presence of the card. POS-CNP transactions, on the other hand, represent the mail order purchases made on via either telephone or internet (Krivko, 2010).
13
An Automated Teller Machine (ATM) is a banking channel for performing basic banking transactions without branch interaction. Since their inception in 1960’s, they gained huge popularity. As of now, more than 3.5 million ATM’s were installed around the globe and the number is rising. In some countries, banks create ATM networks that enable cash withdrawal from ATMs of any affiliated bank included in the network (Wikipedia, 2017b). Due to their ease of use, cash withdrawal from ATM has now preceded the withdrawal from branch particularly for small amounts. An ATM is connected to the databases of the bank and activated by a customer to withdraw cash or to make other banking transactions. It is essentially a computer with a keypad and screen to access accounts and make transactions (Sharma, 2012).
Although they are originally developed as cash dispensers, ATMs have evolved to include many other bank-related functions (Wikipedia, 2017b):
- Paying routine bills, fees, and taxes (utilities, phone bills, social security, legal fees, income taxes, etc.)
- Printing bank statements - Updating passbooks - Cash advances
- Cheque Processing Module
- Paying (in full or partially) the credit balance on a card linked to a specific current account.
- Transferring money between accounts
- Deposit currency recognition, acceptance, and recycling
1.4.2. Realization of ATM Cash Withdrawals
Debit and credit cards can be used to withdraw money from ATMs. ATMs are connected to the databases of the owner bank and, if they are part of an interbank ATM network, they are also connected to the databases of affiliated banks. This connection may be realized through leased lines, which are faster but expensive to operate, or dial-up/DSL connection on a public phone line (Seksaria, 2016).
An ATM has two input devices which are card reader and keypad. Card reader gets the specific account information stored on the magnetic stripe or EMV chip of a debit or credit card. The host processor uses this information to route the transaction to the cardholder's
14
bank. Keypad, along with buttons on the screen, lets the cardholder tell the ATM the type of demanded transaction and required amount, if relevant for type of transaction. In terms of security, keypads are also used for entering the Personal Identification Number (PIN) which is required by the bank to authorize the transaction (Seksaria, 2016).
Debit and credit cards are mainly electronic storage devices. Storage may be carried out by either a magnetic stripe or EMV chip. A magnetic stripe is similar to cassette tape in terms of storing information. The stored information is account number, cardholder name, expiration date and security codes together with card verification value (PIN). Those data except PIN does not change and unprotected for copying. When a payment card with magnetic stripe is swiped through a reader, the information on the magnetic stripe is transmitted to an acquirer company which collects card requests, verifies the request, and makes or guarantees payment to the merchant. In each request, the acquirer checks the merchant ID, card number, expiration date, card limit, and any control related with card usage. Following swipe, the card is returned to the card holder (Toast Inc, 2017).
EMV stands for Europay-Visa-Mastercard, the largest transaction processors in the world, and represents higher security standards for payment cards. EMV enabled devices communicate with a chip in the EMV payment card. That chip contains required information to authenticate the card following a pin is entered or a signature is provided by the card holder to validate his/her authority.
Each time the EMV payment card is inserted into the compatible card terminal, the chip communicates with the EMV terminal and validates the card. In an EMV transaction, unlike magnetic stripe transaction, payment card remains in the terminal until the transaction is complete. The card and terminal communicate and agree on the application to run. The cardholder’s information is protected by cryptographic keys; thus, the holder’s data is protected. Due to those features, duplicating EMV card is extremely difficult (Toast Inc, 2017).
1.4.3. Fraud Schemes in ATM Transactions
As with any other monetary transactions, ATM operations have been subject to fraudulent intentions. While some of the schemes are aiming at capturing payment card information, or physically getting the card, others directly target stored money in the ATM.
15
- Card Skimming: Skimming refers to the stealing of the payment card information thus enabling criminals to counterfeit card. Consumers conduct a normal ATM transaction and are usually unable to notice a problem until their account is defrauded. It is the most outstanding global threat, but its size is shrinking due to countermeasures taken such as anti-skimming solutions, EMV technology and contactless ATM functionality (NCR, 2016).
- Card Trapping: Trapping is the stealing of the physical card through a device fixed to the ATM. Before initiation of EMV standards, the PIN does not need to be compromised while trapping the card.
- Transaction Reversal Fraud: TRF involves deliberate creation of an error that makes it appear that the cash had not been dispensed. Due to error, the account is re-credited the amount and the actually ‘withdrawn’ money is taken by fraudsters. This type of fraud could be a type of physical grabbing or a corruption of the transaction message.
- Cash Trapping: This type of frauds generally realized with low values. The fraudster uses a device to trap the dispensed cash physically when a customer withdraw cash. When the customer foregoes and leaves ATM location, criminals come to collect trapped cash.
- Physical Attacks: This category is related to any attempt to rob the cash in the ATM safe. Methods of physical attacks include solid and gas explosives, as well as removing the ATM from the site and then using other methods to gain access to the safe.
- Logical Attacks: Emerging as a significant financial crime, logical attacks have the potential to cause large amounts of losses and they are an emerging type of
financial crime in ATMs. Electronic devices, or malicious software can be used in the crime. Through those tools, criminals aim at controlling the ATM machine dispenser to withdraw money. In a different variant of attack, criminals aim at intercepting the card and PIN data of the customers. Such data can then be used in fraudulent transactions. Intercepting the ATM software may be named as man in the middle attack (NCR, 2016).
Following the retrieval of debit card information, or debit card itself depending on the applied scheme, fraudsters try to withdraw all money as early as possible. However, many
16
banks posed daily limits regarding withdrawals or POS transactions for debit cards. For this reason, fraudsters could generally withdraw the money through a time period in line with determined limits. The customer may detect wrongdoing in the first fraudulent transaction, but it may take days or weeks depending on the circumstances and whole balance of the customer may be fraudulently withdrawn.
Unlike credit card frauds, for which merchants are held liable in most cases, the cost of debit card frauds is generally paid by the issuing bank. For this reason, timely detection of debit card frauds is important to limit losses arising from fraud. This study aims to use various data mining algorithms for early detection of debit card frauds.
17
2. DETECTING FRAUD THROUGH DATA MINING
2.1. Rule-Based (Expert-Based) Fraud Detection
Rule based fraud detection can be defined as specifying rules based on the experience, intuition and business or domain knowledge of experts. Examining previously occurred frauds, some rules can be defined for detection of suspicious transactions. A sample rule in a car insurance fraud detection system, which can be considered in that group, is given below.
In a car accident claim, if:
- Amount of claim is above threshold OR - Severe accident, but no police report OR - Severe injury, but no doctor report OR
- Claimant has multiple versions of accident OR - Multiple receipts submitted,
Then flag claim as suspicious (Baesens et al., 2015).
Some of the similar concepts to rule-based fraud detection are fraud schemes (Vona, 2008) and data-driven fraud detection (Albrecht, 2013). Albrecht (2013) suggests that an analysis of possible fraud symptoms would normally produce 50 fraud schemes and 3-5 symptoms for each fraud scheme. That would create some 250 fraud symptoms to analyze in a typical rule-based detection scheme.
Rule-based fraud detection may be understood as the first step in the data analytics maturity. It can be stated that the first detection attempts regarding fraud start with such rules. In fact, they may be very successful to cover the existing loopholes. However, while the fraud detection attempts are being matured, it is required to go beyond the list of rules, due to some apparent disadvantages of rule-based detection particularly in a data-intensive and complex fraud environment:
- It is difficult and expensive to build, maintain and manage rule database. Rules need to be kept up-to-date and rules should only show most suspicious cases due to required manual investigation.
18
- Since the rules are based on past experience, newly emerging fraud patterns are not automatically flagged.
- Expert-based systems require the inclusion of domain experts for all “input,
evaluation and monitoring” stages, hence they are quite labor intensive (Baesens et al., 2015).
- Auditors/investigators are generally under time pressure for fraud detection. Research shows that time pressure may lead less sensitivity to fraud cues, which makes examining so many rules inefficient.
- Auditors/investigators may lack adequate level of fraud scheme information, which is a prerequisite for managing and examining rules (Albrecht & Albrecht, 2013).
2.2. Data Mining
As a result of computerization of our society, vast amounts of data are being collected in all aspects of our daily life including business, science, engineering and medicine. Businesses worldwide are generating huge datasets that include sales transactions, trading records, product specifications and customer feedbacks. Having billions of transactions, telecommunication companies carry insurmountable amount of data every day. Web searches, online communities and social networks produce huge amount of data as well. Furthermore, Internet of Things (IoT), which means communication between physical objects, is expected to explode the data in the databases in the near future. This growing and available data brought the need to uncover valuable information from it and transform it to the organized knowledge, which is the basic attribute of data mining. The definition also emphasizes that dimension: “Data mining is the process of discovering interesting patterns and knowledge from large amounts of data. The data sources can include databases, data warehouses, the Web, other information repositories, or data that are streamed into the system dynamically” (Han et al., 2011).
Data mining is seen as the next stage in the evolution of information technologies after the stage of database systems. The main tenet of the data mining is that “the world is data rich but information poor”, that is we are living an age of rich data, but we are unable to use that data to produce valuable knowledge. For this reason, the synonym of data mining is Knowledge Discovery in Databases (KDD). The term of data mining also reflects the
19
difficulty of the process, because it requires handling so much raw material (data) to reach usable information (Han et al., 2011).
In terms of fraud detection, according to Baesens et al (2015), data mining based fraud-detection methodologies are gaining power over expert-based approaches for various reasons:
a. Precision: Those methods have enhanced detection power. Using voluminous data, they can uncover patterns that is not possible to be captured by human eye. The power of data mining methods in that sense, which is also proven in credit scoring field, provide effective prioritization of suspicious transactions
b. Operational efficiency: The sheer volume of data requires automatic handling of data. On the other hand, in some settings like credit card transactions, it is required to detect the fraudulent transaction within a very short time limit, which is possible with automatic data-mining based fraud detection methodologies.
c. Cost efficiency: Developing a workable rule-based system is both challenging and labor intensive. It is apparent that data-driven detection methods have cost efficiency, but considering the Pareto principle of decreasing returns (Baesens et al., 2015).
Data mining based detection techniques can be classified as supervised learning techniques, unsupervised learning techniques and social network techniques.
Unsupervised learning techniques or descriptive analytics aimed at detecting anomalies, which means deviating records. They learn from historical records, but not require them to be labelled as fraud or not. Beside addressing already flagged fraud, which can be defined as outliers, they may also describe suspicious patterns which are previously not identified. They may fail to address transactions in which the fraudster achieves to simulate suspicious transaction to a normal one.
Supervised learning techniques, or predictive analytics try to determine fraudulent transactions using the pattern learned from previous records. Due to their learning from previous labelled data, they may fail to detect new types of frauds. Their need of having
20
labelled data may be difficult to meet in many fraud detection scenarios (Baesens et al., 2015).
Finally, social network analysis learns from network of linked entities to detect fraudulent behavior. It helps discovering cases where fraudsters are in some way linked. It therefore provides an extra source of information which help uncovering particular fraud cases. Social network analysis is the newest tool in fraud detection techniques.
Considering different groups of fraud detection techniques, it is important to note that they should be used as complementary. Organizations should start from rule-based detection, continue with descriptive detection, predictive detection and social network analysis, although the usage may differ according to cases. Improving the utilized fraud detection techniques should be gradual and stepwise to reach satisfactory conclusions (Baesens et al., 2015).
2.2.1. The Process of Fraud Data Mining
Data mining requires carrying out a process of well-considered steps. In fact, data mining is a step in the larger process of Knowledge Discovery from Databases (KDD) (Han et al., 2011). However, it is also being used as the name of the process as a whole. This process includes cleaning and integration, selection and transformation, (actual) data mining through applying techniques and evaluation and presentation of knowledge gained from the process.
21
Figure 2.1. Process of data mining (Han et al., 2011)
Based on the process mentioned above, Baesens et al (2015) established another process that is designed for formulating the steps in the fraud analytics. Their “fraud analytics process model” includes seven stages:
a. Identify business problem: Before starting the analysis of data, business problem should be thoroughly identified.
b. Identify data sources: All relevant data sources should be determined for maximum precision of the model. It is stated that when it comes to data, bigger is better.
c. Select the data: All relevant data from data sources should be identified and gathered in a data warehouse.
d. Clean the data: Data should be processed to eliminate any inconsistency such as missing values and duplicates.
e. Transform the data: Data should be reviewed considering the needs of transformation such as binning, aggregation or numerical coding for alphanumeric values.
f. Analyze the data: This is the step where actual model of fraud detection is constructed. Based on the preprocessed data and our goals, a data mining technique is chosen and applied to the data.
g. Interpret, evaluate and deploy the model: In this step, fraud experts interpret and evaluate the model based on real-life conditions and required
modifications are made. Following a thorough evaluation, the model can be deployed for fraud detection (Baesens et al., 2015).
2.2.2. Preprocessing in data mining
The five steps mentioned above is defined as preprocessing steps. They are performed to prepare required data for actual analysis. It is generally accepted that 80% of the total efforts in a model preparation is spent on preprocessing. It is very important to perform required preprocessing steps carefully to reach an acceptable model, expressed by the GIGO (garbage in garbage out) principle. In this section, we will summarize basics of preprocessing particularly from Baesens et al. (2015).
22
Relevant Data Sources
Data can be gathered from many sources, however, mentioning some of the sources may provide insights for fraud detection.
- Transactional data: Key attributes of customer transactions form transactional data. It can be used to create trends or can be aggregated to state statistics such as averages, maximums, minimums etc., which are the basic of RFM (recency, frequency and monetary) variables. RFM variables can be used in many ways to understand legitimate customer behavior and detect possible outliers. Some RFM variables may be number of transactions per month, time between transactions, monetary value of transaction vis-à-vis average or maximum etc.
- Contractual, subscription or account data: Beside transactional data, institutions gather other more personal data due to the requirements of business or marketing purposes. That data includes sociodemographic information such as age, gender or marital status. For companies, foundation, sector or activity type are example of such data.
- Data poolers: Some companies, or government institutions, are specialized in collecting, processing and selling the data regarding individuals and firms. In Turkey, for instance, KKB collects data regarding credit history of individuals, score that data for final users and sell it to the institutions or individuals in line with legal regulations (Baesens et al., 2015).
- Behavioral information: Preferences, trends and usage variables form behavioral information. For organizations, turnover or number of employees are examples - Unstructured data: Although it is very difficult to process, data embedded in text
documents or multimedia contents can be included in the detection models. - Contextual or network information: In a network setting, context of a particular
entity may form a data source which can be used in some of detection models, particularly social network analytics (Baesens et al., 2015).
Exploratory Analysis
After determining data sources, getting an initial insight into the data should be the next step in preprocessing. The distribution of data may be visually examined using pie charts, histograms, scatterplots etc. Some of the unknown relationship between data elements may
23
be discovered in that stage, particularly if the data is flagged as fraudulent/not fraudulent (Baesens et al., 2015).
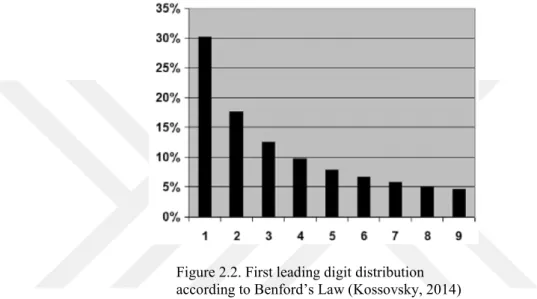
In data analysis, frequency distribution of the first digits of numbers may provide interesting insights. According to Benford’s Law, the frequency of the first digits in many data sets imply that in a typical data set, the count of items will diminish while the first digit of numbers increase. The theory states that 30.1% of the items start with 1, 17.6% start with 2, and only 4.6% starts with 9.
Figure 2.2. First leading digit distribution ac cor ding to Benfor d ’s Law
according to Benford’s Law (Kossovsky, 2014)
Benford’s Law may be used to detect heavily manipulated data sets, if the data set is normally expected to conform the distribution. It may be a sign of fraudulent or erroneous data in some cases, hence it may be considered as part of the exploratory analysis to spot irregularities.
Beside visual exploratory analysis and Benford’s Law, descriptive statistics such as mean, median, mode, percentile values, minimum and maximum values can be examined to reach a “gut feeling” for the data at hand (Baesens et al., 2015).
Handling Missing Values
Missing values are frequent problems in many data sets. They may be the result of incomplete data, privacy issues, errors in data manipulation or inapplicability of the data. The strategies can be replacing (imputing) values, deleting observations with missing values or keeping them if a relationship with target has been discovered (Baesens et al., 2015).
24
Handling Outlier Values
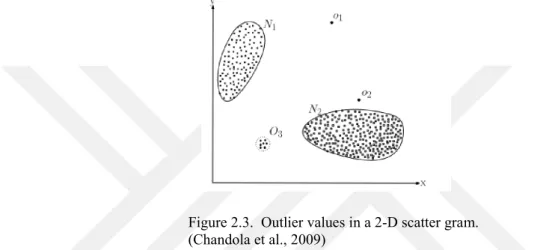
Extreme observations may occur in the data set. They may be either valid observations, such as the income of a millionaire person on an income data set, or invalid observations, such as height of a person being 4 meters. On the other hand, outliers can be multivariate, i.e. more than one dimension. For instance, having high income when the age is young forms a multivariate outlier, which can be seen on a scatterplot. Beside scatterplots, histograms and box plots can be used to visually identify outlier records. Calculating z scores is another frequently used tool to identify outliers (Baesens et al., 2015).
Figure 2.3. Outlier values in a 2-D scatter gram. (Chandola et al., 2009)
After outliers are detected, invalid outliers may be handled as missing value. For valid outliers, depending on the data mining technique to be used, they may be truncated to acceptable limits through various methods (Baesens et al., 2015).
Standardizing Data
For some data mining techniques, it is required to scale variables in a similar range. For instance, income variable should be standardized to make it a component for logistic regression analysis. Min/max standardization, z-score standardization and decimal scaling methods are alternatives of standardization (Baesens et al., 2015).
Categorization
Categorization helps reducing the number of categorical variables to reasonable levels. For continuous variables, it helps reflecting non-linear effects of variables on linear models. There are various methods to apply categorization (or binning) starting from equal frequency or equal interval binning to use of Chi-square analysis to determine bins (Baesens et al., 2015).
25
Weights of evidence
Although categorization reduces the number of variables, it means more than one variable for the same category. For instance, categorization may mean 5 categories, hence 5 variables, for age. Weights of evidence is a method aiming at assigning percentages to those 5 variables to merge them. This way, the model become more concise, but at some cost of interpretability (Baesens et al., 2015).
Variable selection
Data mining models start with lots of variables, but generally the few of them have actual explanatory power. To determine explanatory variables, various filters are used to measure correlations between each variable and the target. For different target/variable combinations, several filters are recommended in the literature. For instance, Pearson correlation measure may be used for selecting continuous variables for continuous targets. Filters are very useful for selecting variables, but other considerations such as the correlation between variables, regulatory compliance, Privacy issues and operational attributes such as computation costs should also be taken into consideration (Baesens et al., 2015).
Principal Components Analysis
In a data mining model, many initially defined variables may have correlation with each other. Also known as multicollinearity issue, that phenomenon reduces the stability of the model. If correlated variables can be combined and summarized through principle component analysis (aka primary component analysis), resulting indices would be uncorrelated with each other and increase the explanatory power of the model. In this transformation, interpretability will be impaired due to reduced meaning of new principal component variables (Baesens et al., 2015).
Segmentation
Before initiating model preparation, data may be segmented for various reasons. The first reason may be attributes for one type of records are substantially different from others and, hence, a specific model may be tailored for that segment. Other reasons are interactions between variables and specific strategies for each segment. Segmentation could be very useful, but at the cost of increasing the cost of modelling efforts due to more than one model (Baesens et al., 2015).
26
2.2.3. Descriptive analytics-unsupervised learning
Descriptive methods aim at “finding unusual anomalous behavior deviating from the average behavior or norm”. That anomalous behavior may also be called as outlier, which is partly explained in the data preprocessing stage. In a fraud detection setting, descriptive methods are used to indicate suspicious transactions. Because they aim at finding anomalous behavior for whatever reason, they can spot irregularities that can’t be indicated by supervised methods, which learn from previous experiences. On the other hand, there are also some challenges experienced by descriptive analytics. Defining “normal” may not be clear-cut in many instances and it changes throughout the time. The attempts of the fraudsters to make their misconducts similar to regular behaviors may lead failure of descriptive analytics and all outliers do not represent fraudulent behaviors. These factors indicate the necessity of extensive follow-up and validation for the unsupervised methods (Baesens et al., 2015).
Graphical Outlier Detection Techniques
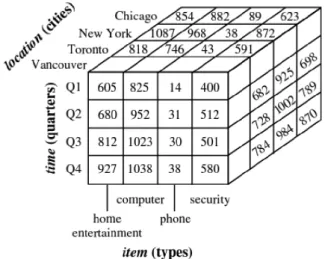
Partly mentioned in the above section of handling outliers, outliers can be detected on graphs. While histogram and box plots can be used for one-dimensional outliers, scatterplots can be used to indicate two-dimensional outliers. With the help of rotating the graph, scatterplots may also be used to indicate three-dimensional outliers. To help graphical analysis, OLAP cubes may be used. OLAP cubes have capabilities of rolling up (aggregating), drilling down (getting more dimensions), slicing (bringing details for one group) and dicing (fixing values for dimensions and creating a sub-cube). The insights provided by graphs, OLAP cubes and pivot tables may be very beneficial for exploring fraud patterns. They are also increasingly used in the postprocessing and monitoring stage in data mining. Disadvantages of graphical outlier detection methods are their difficulty for multidimensional analysis and the necessity of active involvement of the end-user (Baesens et al., 2015).
27
Figure 2.4. 3-D cube representation of sales data (Han et al., 2011)
Statistical Outlier Detection Procedures
Outliers can be identified statistically through z scores (z scores being more than 3 indicates outlier) or more formal tests such as Grubbs test. Grubbs test also use z scores to calculate one dimensional outlier detection. In multi-dimensional settings, it uses Mahalanobis distance. Grubbs test or other similar tests assume existence of normal or other distributions in the data, which is not always true.
Break Point Analysis
Initially proposed by Bolton & Hand (2001), this analysis is used to detect abrupt changes in an account (it may be a bank account, telecommunication account or credit card). It defines a fixed time window to determine the profile of the account and compares averages of this part with a subsequent smaller time window through t statistics. Observations can be ranked based on the calculated t statistics (Baesens et al., 2015).
Peer group Analysis
This method is also proposed by Bolton & Hand (2001). A peer group may be defined as “a group of accounts that behave similarly to the target account”. For instance, middle income wage earners who spend a determined average in their credit cards can form a peer group for credit card expenditures. The exact accounts that form the peer group could be determined by domain knowledge or by statistical analysis. The number of peers should not be too small or too large for meaningful results. The behavior of the individual account is compared with its peers through calculating t statistics or Mahalanobis distance, depending on the number of dimensions (Baesens et al., 2015; Bolton & Hand, 2001).
28
After determining peer group, the behavior of the account is compared with the overall behavior of the accounts in the peer group. In this way, seasonal variations that can be inferred from peer group could be grasped, which is not possible in break-point analysis. On the other hand, both peer group analysis and break point analysis show local outliers instead of global outliers, which means the behavior of account is considered anomalous because it is found anomalous within the account or peer context, rather than the universe of all accounts.
Association Rule Analysis
Association rules aim at analyzing frequently occurring relationships between items. In its origin, association rules were used to find items frequently purchased together. In fraud detection, it can be used to find frequent item sets and fraud rings in insurance claims. Data scientist firstly determine a threshold of support level, which is the determined percentage of “frequent item sets” in the total records. This ratio may be 10%. Aftermath, they determine a confidence level which may be defined as “the conditional probability of rule consequent, given the rule antecedent”. The determined frequent item sets may expose some irregularities, as in the case of fraud rings (Baesens et al., 2015).
Clustering
Clustering aims at splitting a set of observations into segments. Its objective is to maximize homogeneity within each segment (cohesiveness), while minimize homogeneity between segments (separated). In fraud detection settings, clustering can be used in many fields such as credit card transactions or insurance claims. Many types of data including account data, unstructured data, behavioral data, or RFM (recency, frequency and monetary) variables may be used in fraud detection settings.
In the calculated clusters, fraud should be considered in particularly sparse and small clusters. Clustering techniques require correlated inputs to be removed as much as possible. It can be categorized as hierarchical or non-hierarchical clustering at the main level (Baesens et al., 2015).
In the calculation of clusters, distance metrics provide the basic for quantifying similarity. Various distance metrics were accepted for different type of variables. For continuous variables, Euclidian distance or Manhattan (City block) distance may be used. In order to reach meaningful conclusions, variables should be standardized to make their ranges similar.
29
Hiearchical clustering, one of the main groups of clustering methods, aims at hierarchically forming clusters. It starts from either individual observations (agglomerative clustering) or set of all observations (divisive clustering) to reach necessary number of clusters. The number of clusters is not set before starting analysis and this is an advantage of the method. However, it is not appropriate for large data sets and interpretation of the resulting clusters require subjective expert analysis (Baesens et al., 2015).
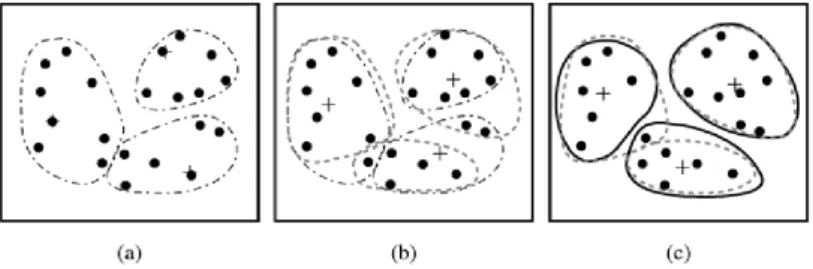
Partitioning clustering does not iterate hierarchically. For these methods, an initial number of clusters are determined before starting the analysis. Later, the software uses iteration to reach optimal cluster centroids. One of the most used non-hierarchical clustering methods is k-means clustering. In k-means clustering, mean of the observations is chosen as the centroid of the clustering. Other versions of the method use medians, which is less sensitive to outliers, and named as K-medoid clustering. For categorical variables, k-mode clustering uses modes for determining centroids (Han et al., 2011). The working of k-means clustering family is as follows:
- Identify k observations as seeds (initial cluster centroids)
- Assign each observation to the closest cluster (using Euclidian distance) - After assigning each observation, recalculate the centroids position
- Repeat until the centroids no longer change or adequate number of iterations reached (Baesens et al., 2015).
Figure 2.5. Iteration steps in k-means clustering + Denotes centroids (Han et al., 2011)
Hierarchical and partitioning clustering assumes spherical-shape clusters. For clustering based on arbitrary shape, density based clustering algorithms (such as DBSCAN) were produced (Baesens et al., 2015). Beside these three groups, grid and model clustering were discovered for different purposes (Ahmed et al., 2016).
30
Self-Organizing Maps
A relatively new method of unsupervised learning, SOM method enables visualizing and clustering high dimensional data on a low dimensional grid of neurons. Neurons in the output layer are ordered in a two-dimensional rectangular or hexagonal grid. They are handy for visualizing high-dimensional data. The downside of SOM is the requirement of expert knowledge to interpret optimal size of the SOM and to compare different SOM solutions (Baesens et al., 2015).
Evaluating Clustering Applications
Different applications of clustering algorithms may be evaluated statistically or logically. In statistical evaluation, sum of squared errors may be used to aggregate the distance between cluster centroids and observations. In terms of interpretation, distributions of observations regarding a variable in a cluster can be compared to the distribution in the overall data (Baesens et al., 2015).
2.2.4. Predictive analytics-supervised learning
Predictive analytics aims at building models to predict a target. In a broad sense, they can be divided into regression and classification. Regression is used to predict a continuous interval, such as 0 and 1 or such as 0 and infinity. Fraud amount can be a target for regression. On the other hand, classification uses categories as target measures. Thus, they can take a limited set of predefined values. For instance, fraud vs. no fraud can be a target variable for binary classification. In multiclass classification, more than two targets can be chosen such as severe fraud, medium fraud and no fraud. Different methods can be used together to solve complex problems such as fraud (Baesens et al., 2015).
The main challenge of predictive analytics in fraud detection field is inability to certainly flag observations as fraud or no-fraud. Flagging fraudulent transactions may be difficult due to the determining a higher threshold for examined observations and difficulty of examination. Because it is almost impossible to flag all fraud cases, models should take this into consideration (Baesens et al., 2015).
Linear Regression
To predict continuous target variables, linear regression is generally the first choice. It can be used to predict fraudulent amount in a fraud detection setting. The generalized formula of the regression is = + + ⋯ + . In this formula, Y represents the target variable and x1, … , xn represents explanatory variables. The simplest form of linear
31
regression is ordinary least squares (OLS) regression, which is easy to understand. More sophisticated versions of logistic regression, such as ridge regression or time series models aim at reducing the linearity assumption.
Logistic Regression
In order to predict binary variables (0-1), a modified version of linear regression should be used due to the attributes of OLS. Using bounding function modification, linear regression formula is converted to logistic regression, which provides targets between 0 and 1. In that sense, logistic regression provides a probability for the target. Probit or cloglog transformations are alternatives to logistic (logit) transformation of target. Once the parameters are estimated, logistic regression can be easily converted to a point-based fraud score calculation method which is very handy for straightforward interpretation and prioritization of observations at hand (Baesens et al., 2015).
Variables of linear and logistic regression are selected based on statistical tests which calculates whether coefficient of each variable is different from zero. However, beside passing statistical tests, several more criteria should be met for variables. First of all, the sign of the coefficients should be in line with the expectation of the expert to prove the interpretability of the variables. Furthermore, operational efficiency should be provided particularly for real-time detection solutions. Finally, legal issues should be taken into consideration regarding the collection of variables.
Decision Trees
Decision tree algorithms come up with a flowchart-like tree structure to represent patterns in the analyzed observations. The top node of the tree is known as a root node. Each node identifies a testing condition. The outcome of the test leads a branch which forms an internal node. Terminal nodes of the tree, also known as leave nodes, assign labels. Most popular decision tree algorithms are C4.5, CART and CHAID. In a decision tree, following two decisions should be made:
- Splitting decision: Which variable should be split at what value - Stopping decision: When to stop adding nodes (Baesens et al., 2015)
32
Figure 2.6. A part of decision tree predicting employee fraud
In splitting decision trees, the algorithm try to minimize impurity of labels in the child nodes. Various measures of impurity are being used such as Entropy, Gini or Chi-square. In stopping decision, the tree’s performance, which is trained through training sample, is tested on separate part of data, which is named as validation sample. Until some point, misclassification reduces on both training and validation samples. This point is defined as the stopping decision, beyond which decision tree overfits training sample and increase misclassification for validation sample.
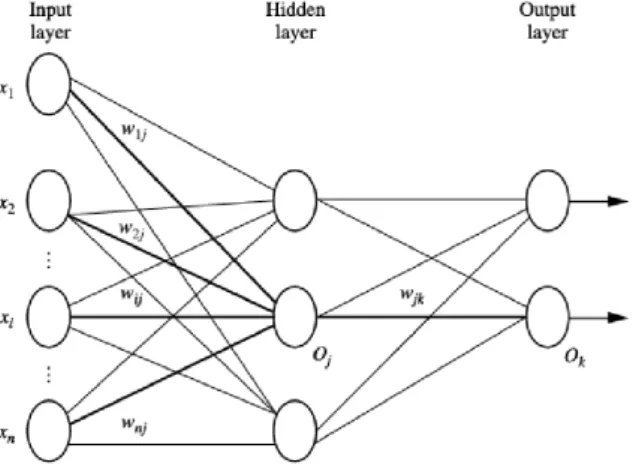
Neural Networks
Neural networks may be defined as generalization of existing statistical models. As can be seen in Figure X, they include a hidden layer between input and output layers, which make their interpretation difficult. As a black box method, they make the connection between inputs and outputs “mathematically complex and nontransparent” way (Baesens et al., 2015).
Figure 2.7. Multilayer feed-forward neural network (Han et al., 2011)
Although there are some methods which can partially expose inner working of a neural network, they remained less interpretable methods for fraud detection. The advantages of
33
neural networks are their tolerance to noisy data, their ability to classify without expert or domain knowledge and their aptitude to many real-world problems (Baesens et al., 2015).
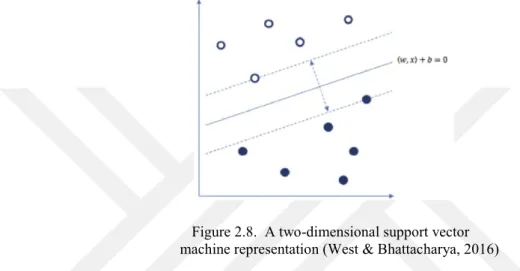
Support Vector Machine
Support Vector Machine (SVM) is another advanced classification method working by transforming a linear issue into a higher dimensional feature space. This property provides the method to reach linear solution for complex non-linear problems, such as fraud detection, without computational complexity (West & Bhattacharya, 2016).
Figure 2.8. A two-dimensional support vector m ac hine representation
machine representation (West & Bhattacharya, 2016)
Ensemble Methods
Ensemble methods were created with the assumption of “multiple models can cover different parts of the data input space and as such complement each other’s deficiencies”. Most popular implementations of ensemble methods are Bagging, Boosting and Random Forests. Bagging (bootstrap aggregating) works by taking B bootstraps from the sample and building a classifier for each bootstrap. The final classification is achieved by the votes of all bootstrap classifications. Boosting works by weighting the data according to misclassified observations. Random forests work by creating subset of the data, like in Bagging, and performing classification using a subset of attributes (Baesens et al., 2015).
As a popular ensemble method, random forests are devised to learn from subsets of data, thus to prevent overfitting, by considering certain number of fully-grown CART decision trees. They are used for both classification and regression. They train certain number of trees and give results based on the mode (classification) or average (regression) of the trained trees. Their popularity is especially evident in categorical variables vis-a-vis continuous variables (Bhalla, 2014).
34
a) Randomly selecting records: Each tree is trained using a 63.2% sample of originally available training data. This random sample is redrawn with replacement from training data for each tree.
b) Randomly selecting variables: Out of all predictor variables, some of them are selected randomly. For classification, this value is square root of the number of all variables. For regression, it is 1/3 of the number of all variables. This parameter can be changed in formula.
c) Leftover data (36.8%) for each tree is named as out-of-bag (OOB) data and misclassification rate on OOB is calculated for each tree. Aggregate error from all trees is used to indicate OOB error rate of the forest.
d) Each tree gives a classification (classification) or value (regression) for OOB observations. For classification, we can say that each tree votes for OOB observations and the ratio of votes to total votes (number of trees) for each OOB observation will determine the score given by this random forest for that class. For regression, average of values given by trees will produce model results (Bhalla, 2014).
Random forest can deal with high-order interactions, few observations but many variables problems and correlated variables. Beside prediction, assessing variable importance is one of their advantages (Strobl & Zeileis, 2008).
RIDIT and PRIDIT
RIDIT is a type of data standardization method used for categorical rank-ordered variables. Originally introduced by Bross (1958), it incorporates ranked nature of variables and observed response probabilities. Through this method, a categorical variable containing rank could be standardized within the range of -1 and 1 (Brockett et al., 2002). The equation of the RIDIT score is given below:
Equation 2.1. Computation of RIDIT Scores
35
In this equation, t denotes the ranked categorical variable, kt number of ranks in variable t,
p̂t =( p̂t1,.., p̂tkt) observed proportions of responses for variable t in the whole data set.
Response categories should be ordered in the same manner. In fraud detection setting, higher categorical response should mean less fraud suspicion. The result of this equation would be in the range of -1 and 1.
Brockett et al. (2002) stated that the RIDIT method have some advantages vis-à-vis other methods handling rank-ordered categorical variables. First of all, it doesn’t treat categorical values like they are interval values, as in the most usages of natural integer scoring in many research fields. Furthermore, it doesn’t require assumptions of other methods such as the equality of space between categories and conformity of distribution of the input data. Moreover, it reflects the relative abnormality of the response. Besides, this scoring method is “monotonically increasing” which corresponds the ranked nature of responses. Finally, for each variable, score would be centered and total of scores would be zero (Brockett et al., 2002).
Brocket et al. (2002) suggest that principal components analysis on RIDITs (PRIDIT) may serve as an objective suspiciousness scoring for fraud detection. Their proposal claims that principal component arisen from PCA would represent the variables best and thus can be used as a classification function. They assert that such a method would overcome several disadvantages of other predictive methods regarding its assumptions on requirement of training samples, its ability to distinguish information value of variables, and its power to accurately classify rank-ordered categorical variables (Brockett et al., 2002).
Evaluating Predictive Models
Predictive models are evaluated by splitting data at hand to two parts: training data and test data. They should be completely separated for a successful test. Beside these two sets, validation data sets should also be split for decision trees or neural networks. Validation data set is used to determine stopping decision. All of these data sets are expected to be formed through stratified sampling on target variable. For small data sets, there are other options for determining those splits (Baesens et al., 2015).
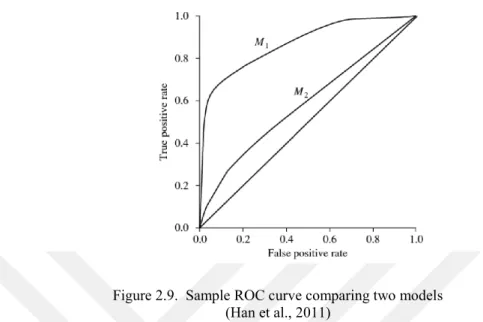
After splitting data sets, a performance measure is determined. A receiver operating characteristics (ROC) curve is one of these measures. Based on the concept of confusion matrix, which compares predicted status with actual status, area under ROC curve (AUC) is
36
used to compare different predictive models. In the following figure, M1 model seems producing better predictions (in AUC terms) than M2.
Figure 2.9. Sample ROC curve comparing two models (Han et al., 2011)
Beside AUC, there are various measures for model performance. The lift curve measures percentage of fraudsters per decile of observations. Cumulative accuracy profile (CAP) curve is another representation of the lift curve. Based on the CAP, Accuracy Ratio (AR) may be calculated for the model at hand to indicate its closeness to a perfect model. Accuracy ratio is also known as Gini coefficient. As stated before, statistical measures of model performance should be considered with other factors, such as comprehensibility, justifiability to previous business knowledge, and operational efficiency (Baesens et al., 2015).
Developing models for skewed data sets
In fraud detection model, one of the most significant challenges of fraud datasets is skewed data sets. A summary made by Baesens (2015) suggests that actual fraudulent observations may be as less as 5*10-5. The inadequate ratio of flagged observations may lead performance
measurements to indicate erroneous results. To overcome this problem, either number of fraudulent observations or their weights may be increased. Several methods such as undersampling, oversampling, SMOTE and cost-sensitive learning are proposed for correcting the skewed data sets to a certain extent (Baesens et al., 2015).
Oversampling works by replicating the fraudulent observations. On the other hand, undersampling works by reducing the number of non-fraudulent observations. Inactive accounts or low-value transactions can be first candidates for reducing legitimate
37
observations. Synthetic Minority Oversampling Method (SMOTE) synthetically add flagged data with the k-nearest neighbor calculation. Cost-sensitive learning changes the assumption of equal costs for the cases in confusion matrix and increase the cost of false negatives to reach a better prediction in a fraud detection setting (Baesens et al., 2015).
2.2.5. Other techniques
Social Network Analysis
Social networks have been a phenomenon of the last decade. Beside being the most prominent form of social activity, social networks provide a rich data set for data analysts, as far as it is allowed. In fact, social network analysis is not confined to popular social networks over internet and can be used for entities in enterprise data. For instance, having massive transactional databases, telecommunication companies can easily spot the strength of relationship between people based on the frequency and/or duration of calls (Baesens et al., 2015).
In fraud context, social networks may be very useful because of the requirement of collaboration for committing fraud. In the lack of required evidence for fraud, analyzing the network of people involved in the cases may provide important contributions to examine fraud. In insurance claims, fraudsters may employ same set of witnesses, claimers, claimees or vehicles. Examination of tax fraud cases can also benefit from social network analysis. In employee fraud context, some fraud types, which require collaboration between employees and other actors, social network analysis may be used (Baesens et al., 2015).
Social network analysis can be represented on unipartite, bipartite or multipartite graphs. Unipartite graphs include one type of entity. The relationship between people in a social network application is represented on a unipartite graph. Bipartite graphs include two types of entities, for instance, in credit card fraud, cardholders and merchandisers can be linked on a bipartite graph. Multipartite graphs are quite complex structures for analyzing and they are not used much in fraud detection context (Baesens et al., 2015).
Genetic algorithms and programming
Using the concept of evolution, genetic algorithms iteratively improve solutions for the problem. It starts by creating a starting generation randomly, then continues with reproducing each population using various techniques. Finally, it chooses survivors based on their fitness. To measure the fitness of the “children”, percentage of correctly classified