RISK CONSTRAINED SELF-SCHEDULING FOR A
POWER PRODUCER USING POWER TO HYDROGEN
STORAGE IN DAY-AHEAD MARKETS
N˙IDA NUR K ¨UC¸ ¨UK
MASTER’S THESIS
Submitted to the Graduate School of Science and Engineering of
Kadir Has University in partial fulfillment of the requirements for the degree of Master of Science in Industrial Engineering
TABLE OF CONTENTS
ABSTRACT . . . i ¨ OZET . . . ii ACKNOWLEDGEMENTS . . . iii DEDICATION . . . iv LIST OF FIGURES . . . vLIST OF TABLES . . . vii
LIST OF SYMBOLS/ABBREVIATIONS . . . viii
1. INTRODUCTION . . . 1
2. BACKGROUND . . . 4
2.1 Turkish Wholesale Competitive Market . . . 4
2.2 Alternatives to Meet Electricity Demand . . . 5
2.3 Market Structure . . . 6
3. POWER TO GAS (P2G) AND GAS TO POWER (G2P) CON-VERSION TECHNOLOGIES . . . 14
3.1 Hydrogen as an Energy Carrier . . . 15
3.2 Hydrogen Production From Water . . . 15
3.3 Hydrogen Storage . . . 18
3.4 PEM Technology . . . 22
4. SELF-SCHEDULING WITH HYDROGEN STORAGE . . . 29
4.1 Stochastic Programming and Risk Measures . . . 29
4.2 Overview of Self-Scheduling Models . . . 31
5. MATHEMATICAL MODEL . . . 37
5.1 Data and Assumptions . . . 39
5.2 Discussion of the Results . . . 42
6. CONCLUSIONS AND FUTURE RESEARCH . . . 63
REFERENCES . . . 65
Appendices . . . 69
RISK CONSTRAINED SELF-SCHEDULING FOR A POWER PRODUCER USING POWER TO HYDROGEN STORAGE IN DAY-AHEAD MARKETS
ABSTRACT
In this thesis, optimal weekly self-schedule of a natural gas power plant with a hydrogen storage system is determined by using a stochastic model with risk con-straints in a day-ahead electricity market. Different electricity price scenarios have been created for a weekly schedule where each scenario represents a certain month in a year. The risk associated with this scheduling decision is characterized by a conditional value at risk (CVaR) measure and a trade-off between this risk and op-eration profit is considered. The storage facility would allow electrical energy to be stored via hydrogen gas through electrolysis (power-to-gas, P2G, process) when the electricity prices are low or scheduled generation is more than required. On the other hand, stored hydrogen gas can be converted to electricity when the electric-ity prices are high or generation is less than required (gas-to-power, G2P, process). The self-scheduling model with risk trade-off has been formulated as a mixed integer linear program and a realistic case study that uses the proton exchange membrane (PEM) technology with eighty percent efficiency for electrolysis has been solved us-ing GAMS program and CPLEX solver. This hybrid system case study shows that this risk constrained method helps to improve generation scheduling and increases the overall profit and trade-off with risk.
Keywords: Power Storage, Self-Scheduling, P2G and G2P Conversion Technologies
G ¨UN ¨ONCES˙I P˙IYASADA B˙IR ELEKTR˙IK ¨URET˙IC˙IS˙I ˙IC¸ ˙IN R˙ISK KISITLI ¨
URET˙IM VE H˙IDROJEN DEPOLAMA ¨OZ C¸ ˙IZELGELEMES˙I
¨
OZET
Bu tezde, hidrojenle enerji depolama sistemine sahip bir do˘galgaz elektrik ¨uretim santralinin g¨un ¨oncesi piyasasında haftalık ¨uretim planlaması risk fakt¨or¨u altında stokastik model kullanılarak eniyilenmektedir. C¸ e¸sitli piyasa takas fiyatı (PTF) senaryoları, her senaryo yılın bir ayını temsil edecek ¸sekilde, santralin haftalık ¨uretim planlaması i¸cin tahmin edilmi¸stir. Eniyilenen planlamanın risk-kˆar ili¸skisi ko¸sullu riske maruz de˘ger ile hesaba katılmı¸stır. Tezde kullanılan depolama sistemi, PTF’nin d¨u¸s¨uk oldu˘gu veya ¨uretilen enerji miktarının talep edilenden fazla oldu˘gu zaman-larda elektroliz y¨ontemi ile elektrik enerjisini hidrojen gazı olarak depolayabilmek-tedir (P2G i¸slemi). ¨Ote yandan, depolanmı¸s hidrojen gazı PTF’nin y¨uksek oldu˘gu veya ¨uretilen enerji miktarının talepten az oldu˘gu zamanlarda, elektri˘ge ¸cevrilebilmektedir (G2P i¸slemi). Risk dengesi i¸ceren eniyi ¨uretim planlama modeli y¨uzde seksen ver-imlilikle ¸calı¸san PEM elektroliz teknolojisi i¸cin, karı¸sık tamsayılı do˘grusal program ve ger¸cek¸ci bir vaka ¸calı¸sması kullanılarak GAMS programında form¨ule edilmi¸s ve CPLEX ¸c¨oz¨uc¨us¨u ile ¸c¨oz¨um elde edilmi¸stir. Depolama sistemli bu ¸calı¸smada, risk kısıtlı y¨ontemin ¨uretim planlamasını eniyiledi˘gi ve toplam kˆar ile risk-getiri dengesini iyile¸stirdi˘gi g¨or¨ulm¨u¸st¨ur.
Anahtar S¨ozc¨ukler: G¨u¸c Depolama, ¨Oz C¸ izelgeleme, Gazdan Enerjiye ve Enerjiden Gaza C¸ evrim Teknolojileri
ACKNOWLEDGEMENTS
First of all, I would like to express my sincere gratitude to my advisor Asst. Prof. Emre C¸ elebi for his support, patience, and knowledge.
I also would like to thank my defense jury members, Prof. Mehmet ¨Ozg¨ur Kayalıca and Assoc. Prof. Ahmet Y¨ucekaya, for their thorough review and constructive criticism of this thesis.
I am thankful to my family for their support, motivation and sensibility.
I am using this opportunity to express my gratitude to my dearest friends, who give me hope with their motivation and support on my hopeless time.
Finally, I want to express my deepest thanks to the one that I have promised a future together with, the one both kept me harmonious and helped me putting pieces together.
LIST OF FIGURES
Figure 2.1 Wholesale competitive market structure . . . 4
Figure 2.2 Effects of the related operations with each others . . . 7
Figure 2.3 Supply and demand relation for a regular hour . . . 9
Figure 3.1 Process of reverse electrolysis for generating electricity . . . 17
Figure 3.2 Some of the examples of PEM systems around the World [2] . . 23
Figure 3.3 Breakdown of global energy-related CO2 emissions by sector in 2015 . . . 24
Figure 3.4 Hydrogen production and efficiency as a function of the total power consumption of a PEM production plant [2] . . . 26
Figure 3.5 Cost analysis of PEM system . . . 27
Figure 3.6 Cost summary for anode catalyst synthesis and materials . . . . 28
Figure 3.7 Operational cost details of PEM cells . . . 28
Figure 4.1 The connection among VaR and CVaR . . . 30
Figure 4.2 Out of sample testing of [26] . . . 34
Figure 5.1 Hourly MCPs for scenarios . . . 41
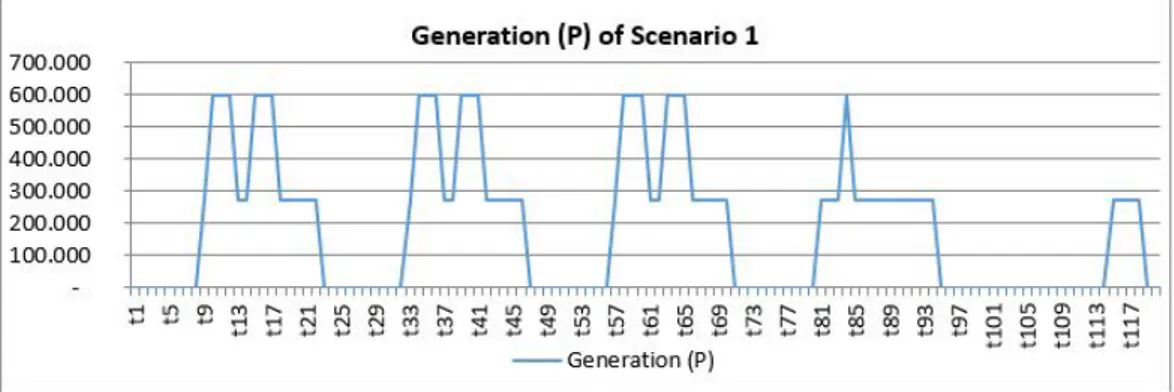
Figure 5.2 Generation at each hour of scenario 1 . . . 45
Figure 5.3 MCPs for each hour of scenario 1 . . . 45
Figure 5.4 State of charger for each hour of scenario 1 . . . 45
Figure 5.5 G2P and P2G operations for scenario 1 . . . 46
Figure 5.6 Generation at each hour of scenario 4 . . . 49
Figure 5.7 MCPs for each hour of scenario 4 . . . 49
Figure 5.8 State of charger for each hour of scenario 4 . . . 50
Figure 5.9 G2P and P2G operations for scenario 4 . . . 50
Figure 5.10 Generation at each hour of scenario 7 . . . 54
Figure 5.11 MCPs for each hour of scenario 7 . . . 54
Figure 5.12 State of charger for each hour of scenario 7 . . . 55
Figure 5.13 G2P and P2G operations for scenario 7 . . . 55
Figure 5.14 Generation at each hour of scenario 11 . . . 58
Figure 5.16 State of charger for each hour of scenario 11 . . . 59
Figure 5.17 G2P and P2G operations for scenario 11 . . . 59
Figure 5.18 Comparison of generation amounts for each scenario . . . 60
Figure 5.19 Comparison of MCPs for each scenario . . . 60
Figure 5.20 Efficient frontier for expected profit and risk . . . 61
Figure 5.21 Comparison of generation outputs with and without storage . . . 62
Figure A.1 Power generation for scenario 2 . . . 70
Figure A.2 Power generation for scenario 3 . . . 70
Figure A.3 Power generation for scenario 5 . . . 70
Figure A.4 Power generation for scenario 6 . . . 71
Figure A.5 Power generation for scenario 8 . . . 71
Figure A.6 Power generation for scenario 9 . . . 71
Figure A.7 Power generation for scenario 10 . . . 72
Figure A.8 Power generation for scenario 12 . . . 72
Figure A.9 G2P and P2G for scenario 2 . . . 72
Figure A.10 G2P and P2G for scenario 3 . . . 73
Figure A.11 G2P and P2G for scenario 5 . . . 73
Figure A.12 G2P and P2G for scenario 6 . . . 73
Figure A.13 G2P and P2G for scenario 8 . . . 74
Figure A.14 G2P and P2G for scenario 9 . . . 74
Figure A.15 G2P and P2G for scenario 10 . . . 74
Figure A.16 G2P and P2G for scenario 12 . . . 75
LIST OF TABLES
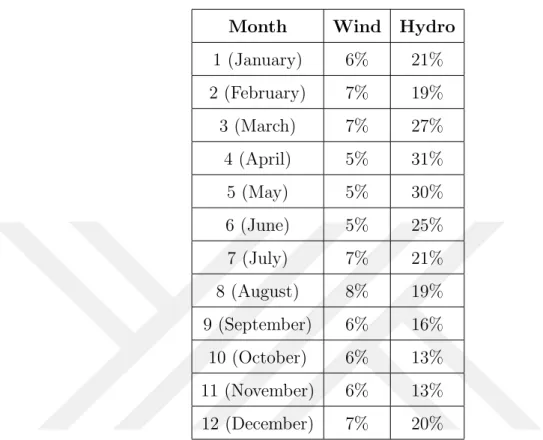
Table 5.1 Share of wind- and hydro-source generation for each month . . . 40
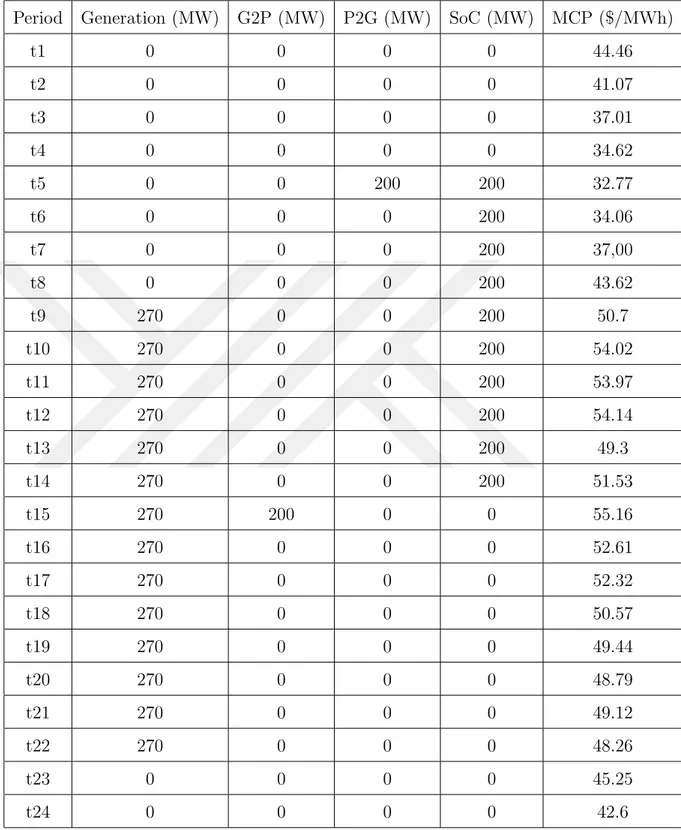
Table 5.2 First 24 hours of scenario 1 . . . 43
Table 5.3 First 24 hours of scenario 4 . . . 47
Table 5.4 First 24 hours of scenario 7 . . . 53
Table 5.5 First 24 hours of scenario 11 . . . 56 Table 5.6 Expected profit and risk measure (CVaR) for different weights (β) 61 Table 5.7 Expected profit for different weights (β) with and without storage 62
LIST OF SYMBOLS/ABBREVIATIONS
t Hourly time periods ω Scenarios
G2Pt,ω Amount of power converted from gas (Gas to Power) at time
period t for scenario ω
P 2Gt,ω Amount of gas converted from power (Power to Gas) at time
period t for scenario ω
Pt,ω Generated electricity volume at time period t for scenario ω
λt,ω Market clearing price at time period t for scenario ω ($/MWh)
CG Marginal cost of generation unit ($/MWh)
SDt Shut down cost at time period t
SUt Start Up cost at time period t
τ Number of hours
α Per unit confidence level to be used to compute the conditional value at risk (CVaR)
β Weighting factor to achieve an appropriate trade-off between profit and risk
φω Probability of occurrence for scenario ω
ηω Value at risk (VaR) for scenario ω
Pmax Maximum power generation capacity of power plant Pmin Minimum power generation requirement of power plant
µG2P Efficiency of G2P process µP 2G Efficiency of P2G process
1.
INTRODUCTION
Electrical energy is the key power in today’s world. It has become one of the most important requirement of the growing population, economy and developing technology. The importance of electricity in the daily life of humanity, which affects the standards of living, strategic decisions of the governments, political movements and economic growth of a country cannot be ignored. Electrical energy requires instant supply-demand balance and recent advances in new storage technologies has been improving this requirement. Imbalance between the estimated demand and the real amount of consumption or the unexpected cases in the system cause supply-demand mismatches and re-dispatch costs in the system. These costs are mainly reflected to the suppliers and even to the end user customers. Unexpected changes of intermittent electricity generation (e.g., wind), solar irradiation level or weather conditions (rain, overcast etc.) cause a deviation in electricity generation compared to the forecasted amount and it creates imbalances in the system or the grid. In such cases, market or system operators balance the system by dispatch instructions to generation (and consumption) firms who participate in the market such as natural gas power plants (interruptible loads). The growing electricity demand have led research on developing methods to access the electrical energy whenever it is needed and requires to minimize these imbalances.
The economic and strategic importance of electricity continues by liberalization pro-cess in Turkey and its “wholesale competition” market structure. Today, generation companies are obliged to deliver their generation volumes and prices to the market operator in the wholesale market in a day-ahead period, mostly putting a day of lag between the day-ahead market and real-time operations. However, the electricity prices of the following day is still unknown at day-ahead market. The unknown
prices and demand force the producer to plan and offer generation volume on the day-ahead market under a risk of financial loss, mostly due to unplanned or out of schedule generation outages that are penalized by the system operator. These penalties arises due to imbalance in the demand and supply of the real-time opera-tions. Hence, the importance of self-scheduling strategies become more prevalent in the wholesale electricity markets.
The objective of each generator in the market is to maximize its profit while con-trolling the risk of variability in its profit. Energy storage is a strategy which has almost no operational costs and compatible for any power plant that requires higher profits with lower risk. Energy storage may be in different forms, such as pumped hydro storage, lithium-ion batteries, hydrogen (or renewable gas) storage. The main idea of these storage types is storing electricity when the price is low, and using the stored energy when the electricity price is high. Another aim of energy storage is to match supply and demand at real-time operations. Hence, the main research question of this thesis is “what is the best strategy to maximize the profit by self-scheduling and storage operations under risk?” This thesis provides generators in the electricity market, a day-ahead market generation strategy (i.e., self-schedule) with an electricity storage option and risk trade-off under uncertain day-ahead market prices.
A stochastic self-scheduling model is developed that maximizes the operational profit of a natural gas power plant in day-ahead market by power to gas (P2G) and gas to power (G2P) energy storage. Because of the uncertainty in day-ahead market clearing prices and risk of financial loss, a conditional value at risk (CVaR) measure is used to maximize profit for given confidence levels. In this setting, it is important to optimize producer’s generation schedule and optimal start-up/shut-down strategy. This thesis proposes a scenario analysis with twelve different scenarios (including five different days of the week, i.e., 120 hours), where each scenario represents a certain month. The results show that the seasonal self-scheduling provides optimal generation strategy that increases profit under uncertainty with hydrogen storage
facilities.
The structure of the thesis is as follows: Chapter 2 includes a background on Turkish electricity market structure and explains the current market for each participant with alternatives to meet electricity demand and details of penalty calculations as well as supply-demand relations. Chapter 3 provides the details of power to gas and gas to power conversion technologies by focusing on hydrogen storage methods. Chapter 4 put forward a literature review where recent studies about self-scheduling, energy storage and scheduling under risk measures are reviewed. In Chapter 5, the mathematical model used in this thesis is presented and results are discussed. Finally, in Chapter 6, the thesis has been concluded and future research venues are explained.
2.
BACKGROUND
2.1 Turkish Wholesale Competitive Market
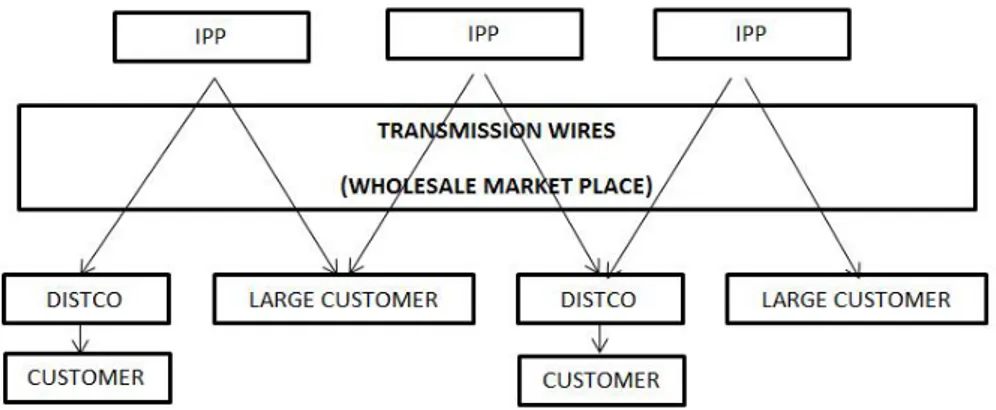
This section presents the structure of the wholesale electricity market in Turkey. In Turkish electricity market, the market participants are Independent Power Pro-ducers (IPPs) at the generation side, Distribution Companies (DistCos) responsible of maintaining the distribution grid and meter reading, and finally the customers (end-users) at the demand side. The market operator, Enerji Piyasaları ˙I¸sletme A.S¸. (EP˙IAS¸), controls and provides contracts and operation screens for the market participants. IPPs are able to sell their generated energy on the transparent market portal provided by EP˙IAS¸ or via bilateral agreements to the Distribution Companies (DistCos) or to large customers such as manufacturing plants. Figure 2.1 shows the wholesale competitive market structure:
Figure 2.1 Wholesale competitive market structure
Increasing competition level and liberalization rate have tremendously increased the volume of traded electricity in the market and delivered power to the end-user, in other words the demand volume. Moreover, these advancements in the market
positively affect the volume profile of the electricity generation and form trading mechanisms as well as create alternatives to traditional activities for generation and sales of the electricity.
2.2 Alternatives to Meet Electricity Demand
Alternatives to meet increasing energy demand are offered by EP˙IAS¸ through over the counter agreements, cross-border trades, generation companies or state-owned power plants. But, each of these operations has their own risks and profits. These operation mechanisms are explained as follows: EP˙IAS¸ exchange, Over-the-Counter (OTC), Cross-border, Genco and Toll mechanisms.
Day-ahead market (DAM) and intra-day market are the mechanisms of EP˙IAS¸ ex-change. Sellers inform their generation volume and buyers on the other hand, deliver their required amount of electricity to be traded and price of the electricity that they are willing to trade. EP˙IAS¸ is the exchange center of the market, which provides an opportunity for an easy and risk-free trading through their portal. Risk of EP˙IAS¸ portal for a supplier is the price risk and operational risk with a slightly low proba-bility.
OTC is a trade mechanism between two or more different trader companies which does not have an exchange supervisor. It contains more risk than trading on EP˙IAS¸ platform but also has a higher profit opportunity with a great deal. The main risks of OTC for a supplier are market risk, operational risk with a low probability, rep-utation risk and volume risk. Market risk is the foremost risk for OTC mechanism. Market clearing price (MCP), which is calculated based on supply and demand volume amounts on EP˙IAS¸ portal, may be lower than the OTC’s agreed price or vice-versa. Other than that, the agreed volume may not be fully provided from the agreed party and this would definitely defames reputation of this party in the market.
mechanism has all kind of risks. Because the trade is based on a foreign company and this is a trade mechanism with another market where different type of currency, payment rules and fees are applied.
In Genco mechanism, a generation firm simply generates the desired amount of elec-trical energy by its own power plants. This mechanism is trustful, more reliable, easy and hassle-free. The main risks are price risk and operational risk (e.g., an unex-pected breakdown in the generation units or any unforeseen technical disruptions). In this thesis, the Genco mechanism is used for a natural gas power plant.
In Toll mechanism, required energy is generated in a rented power plant. It is an easy, hassle-free and trustful trade mechanism. Similar to Genco mechanism, the major risks are price and operational risks.
2.3 Market Structure
Macro-level energy traders and energy institutions can trade energy with each other whenever they require. Also, they can trade with the other countries via cross-border trade mechanism. If the macro level energy institutions trade energy with countries, it makes the trade global.
At the wholesale competition market, each action of firms affects each other. Energy trading price is mostly affected by generation cost; that generation cost has an influence on the investment; demand and profitability is specified by this investment. Figure 2.2 shows the effects of the related operations with each other.
In DAM, there are three types of offers, namely hourly offers, block offers and flex-ible bids, which are provided to EP˙IAS¸ by generators and consumers in the current market. Each offer contains at least one relevant price level. In the DAM, each par-ticipant posts different types of offers for different hours of the next day, where “P” is the price. Market operator (EP˙IAS¸) is responsible to optimize buy/sell amount for each offer as matching quantity (see [14] for details of this optimization process).
Figure 2.2 Effects of the related operations with each others
In the electricity market, at the end of this optimization process, supply/demand amounts must be equal for the each hour of the day.
In a positive system hour, the generated electricity is more than the real demand for an hour, and therefore MCP is formed at the minimum offer price. Amount of electricity surplus at the positive system status is equal to the difference between demand and supply at the minimum price of any hour. For the positive system, matching quantity is calculated as below.
Curtailed quantity = Supply(Pmin) − Demand(Pmin) (2.1)
Curtailment ratio = Curtailed quantity/Supply(Pmin) (2.2)
qi,t = (Q0i,t− Q1i,t) ∗ (Curtailment ratio) (2.3)
At the negative system hour, the generated electricity is less than the demand in an hour, and hence the MCP is formed at the maximum price. Amount of electricity shortage at the negative system status is equal to the difference of demand and supply at the maximum price of the hour. For the negative system status, curtailed quantity is calculated as below [38]:
Curtailed quantity = Supply(Pmax) − Demand(Pmax) (2.4)
Curtailment ratio = Curtailed quantity/Demand(Pmax) (2.5)
qi,t = (Q0i,t− Q1i,t) ∗ (Curtailment ratio) (2.6)
In equations (2.1) and (2.4), the difference between supplied electricity and demand gives the curtailed quantity, which is either a surplus or lack of energy. Equations (2.2) and (2.5) calculates the curtailment ratio of that surplus or lack of energy from the share of total supplied energy. In equations (2.3) and (2.6), Q1it are used to calculate matching quantity qit for the related period by using the difference of
these quantities from earlier hours, Q0it.
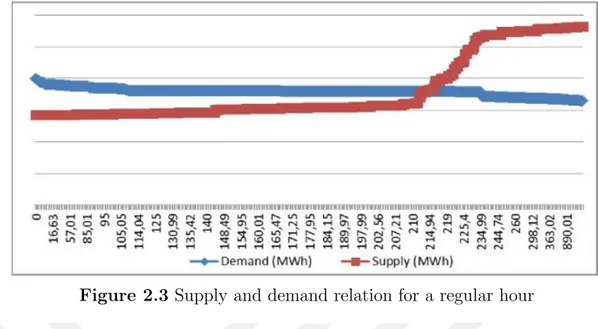
MCP changes each day and at any hour based on the supply and demand of electric-ity. A regular supply and demand relationship is heavily affected by the renewable energy generation at any time during a day and rapid changes in demand. Wind power generation may be very fluctuating throughout the day and requires a precise forecast. It can be a game-changer for the countries that have remarkable installed wind power capacity. Solar power generation is relatively more stable compared to wind power generation, but has to be forecasted properly in order to avoid system instability. However, there may be many other unexpected situations which can have great impact over supply and demand balance, such as an unexpected wind storm, the eclipse of the sun or an unexpected failure in an electricity generation plant. Addition to these events, public holidays, national team sports games and other events need to be considered in forecasts, as they have influential effects on the regular demand profile. These unexpected situations may change MCP in both directions remarkably. Figure 2.3 shows the classical supply-demand relation and their intersection point as the equilibrium price/quantity for a regular hour in a regular day for EP˙IAS¸ day-ahead electricity market [38].
Figure 2.3 Supply and demand relation for a regular hour
In the intra-day market, there are two types of supply-demand relationship: base generation/load and peak generation/load. Mostly, the hours between 01:00 and 06:00 are the base load hours because of low demand. Most of the generation plants work on base load and during this period of time, the energy consumption is highly passive compared to demand during the daytime. Mostly wind farms, run-of-river power plants and some fossil fuel power plants will be running on minimum load and it may be sufficient to meet demand on base load periods. In addition to that, coal fired power plants’ flexibility is highly lower compared to other type of power plants where fossil fuels are consumed. Therefore, it is not practical and feasible for a coal fired power plant to increase its generation with a short term notice, i.e., it has low ramping capability. This is why coal fired plants are inclined to work for longer periods of time, e.g., all day long.
Intra-day market acts as a bridge between DAM and balancing market, and it sup-ports the sustainability of the balancing market. Intra-day market supsup-ports the balancing market where the fluctuations in supply and/or demand may occur as a result of transmission/distribution line faults, power plant breakdowns or unex-pected changes in renewable energy generation volumes as mentioned above. In the intra-day market, a generation company is able to buy or sell any amount of electricity if there is a deviation between the expected generation amount from its
own power plant and its offered generation amount in the DAM. The generation company buys electricity when the offered amount to DAM is less than the realized generation amount and sells electricity when the reported amount to DAM is more than the realized generation volume in the intra-day market. For instance, suppose a wind power plant reports 3 MWh generation from 11 a.m. to 12 a.m. for the next day on DAM in EP˙IAS¸ platform. But in real time, wind power plant genera-tion may exceed the reported volume and may realize as 4 MWh of electricity from 11 a.m. to 12 a.m. In this case, the power plant causes an imbalance in the sys-tem starting from 11 a.m. and in order to not to pay the extra imbalance penalty, the generation company sells 1 MWh of excess electricity for the related hour in the intra-day market. Price of the electricity sold in intra-day market is calculated based on forecasted imbalance penalties. To calculate the real imbalance penalty for an hour “t”, the operator needs to know the MCP, system marginal price (SMP) and imbalance volumes. The SMP occurs at “t+2” but the amount of the electricity volume that will be sold or will be bought in intra-day market operations close at “t-2”. Furthermore, the penalty is decided based on system’s imbalance being in positive or negative direction [38]. When the imbalance is negative (generation < load), the penalty equation (2.7) is as follows:
Pimb,tneg = M ax(M CPt, SM Pt) ∗ (1 + 0.03) − M CPt (2.7)
When the imbalance is positive (generation > load), the penalty equation (2.8) is as follows:
Pimb,tpos = M CPt− M in(M CPt, SM Pt) ∗ (1 − 0.03) (2.8)
Note that 0.03 is a penalty ratio specified by EP˙IAS¸.
A generation company needs to buy electricity in the intra-day market, when it has a negative imbalance. On the other hand, a generation company needs to sell electricity in the intra-day market, when it has a positive imbalance. Because the SMP is not cleared for the hour “t-2”, the company specifies its lower limit of price offer based on MCP, which is cleared at “D-1, 14:00”.
Lower limit P(buy) = MCP * 1.03
Upper limit P(sell) = MCP * 0.97
Even though the company can buy electricity at a lower price or sell electricity at a higher price, there can be a loss of revenue for the company due to forecasted price. This situation is cleared when the SMP is announced. Apart from these, any system participant is able to sell/buy electricity independent from the imbalance penalty with another participant.
On the other hand, a system participant is able to use intra-day market trade to increase profit. For instance, suppose a trader forecasts a breakdown at the system or much lower wind generation than expected average. Hence, the trader can buy electricity more than the required volume at “D-1” at MCP. When the intra-day market prices go higher as forecasted by the long-positioned trader, the system goes to a negative imbalance. Then, the trader sells the extra electricity at a higher price than MCP. However, intra-day market is very risky in practice and this type of trade requires careful forecasts.
The balancing market provides reserve capacity to the market which can step in at most 15 minutes to start generation as ordered by the system operator. Further-more, the balancing market helps keeping the frequency of the system at 50 Hertz. Balancing market operates hourly and only for balancing the system in real time. Trade is a risky operation in the balancing market. Although the system balances on day-ahead market, some imbalances may occur in real-time. If a power plant with a high installed capacity has an unexpected breakdown or a major generation facility increases its production rate suddenly, this unexpected supply may create imbalances. In these cases, the market operator ensures that the system balance is satisfied by using balancing market offers.
Electrical energy has to be depleted simultaneously when it is generated. The value of Area Control Error (ACE) should be kept as close as possible to 0 or should be
equal to 0, which creates 50 Hertz (Hz) of frequency. The total electrical generation at time t (G(t)) must be equal or close enough to total demand at time t (D(t)) and total losses at time t (L(t). The equation (2.9) shows the total generated electricity amount with total demand and losses.
X Gt=
X
Dt+ Lt (2.9)
If total generation at time t is less than the total demand at time t, the frequency drops below 50 Hz. In this situation, the market administrator has to act in order to increase the generation or decrease the demand, depending on the current situation. Most of the times interfering demand is harder than interfering generation. For that reason, the market administrator uses offers to control generation in the balancing market.
SMP is calculated according to direction of the system’s load. If the system’s load direction shows energy shortage, SMP is calculated starting from the minimum value of load shedding offers. If the system’s load direction indicates energy surplus, SMP is calculated starting from the maximum value of load cycling offers. The average of the net amount of balancing operation’s volume and prices represents the SMP. Causes of imbalances might be power plant breakdowns or unpredictable changes of renewable energy generation volumes in a specific time interval.
Plant Breakdowns: If a breakdown occurs in a power plant, the generated vol-ume in real-time is actualized as less than the planned. In this case, the market administrator provides offers in intra-day market and increases generation volume by giving orders to other power plants in the balancing market. If a breakdown occurs in demand side, the demand volume of real-time is less than the planned. In this case, the market administrator requires offers in the intra-day market and decreases generation volume by balancing the market.
Unpredictable Changes in Renewable Sources: The solar and geothermal energy sources are generally predictable compared to other renewable energy gen-eration sources. On the other hand, hydro and wind energy sources have high rate of unpredictability and generation volume may fluctuate. If the generation occurs more than predicted, market administrator provides offers in intra-day market in order to decrease surplus energy output from the thermal energy generation or vice versa.
In some specific situations, if the system has energy surplus, market operator might offer higher price than the MCP of a specific hour to decrease generation of elec-tricity. In this case, a generator might be better off with not generating rather than generating electricity. These type of offers are given by the market operator in the balancing market and classified as: Electrical Charge (EC) and Electrical Discharge (ED).
Market operator also classifies the power plant with instructions (codes) of 0, 1 and 2 according to their capacity or availability of offers. Code 0 offers are given for supply-demand balance of the whole electricity grid. Code 1 offers are for removing the system constraints, such as the difference between forecasted and actual demand. Code 2 offers are for seconder reserve capacities, which are Electrical Charge and Discharge. Furthermore, these codes are categorized according to running-up times. Code 0 is for the first 15 seconds of imbalance periods, they balance the frequency immediately when an unpredictable problem occurs. Code 1 follows code 0 and known as also primer control codes. Finally, code 2 is the seconder reserve offers, which follows code 1.
3.
POWER TO GAS (P2G) AND GAS TO POWER
(G2P) CONVERSION TECHNOLOGIES
Renewable energy generation resources are considered as unlimited, but not always remain at disposal. In order to utilize the renewable energy sources, energy storage may be a good solution. Energy can be stored in batteries, or magnetic energy storages or by pumping technologies. A leading energy storage technology is hy-drogen polymer electrolyte membrane (PEM). This technology only requires pure water (H2O) and electricity as inputs for electrolysis. When the market prices are low, electricity can be stored in gas form of hydrogen through electrolysis of water, and hydrogen and oxygen can be stored in gas tanks. Eventually re-generation of electricity is possible when there is arbitrage opportunitys.
Power to Hydrogen (P2H) is a technological concept that can convert the surplus electrical energy into a gaseous energy carrier, typically, hydrogen by electrolysis. An important distinction between P2H and other storage technologies is that P2H allows the conversion of energy amongst variety of energy sectors and end-users. In case of energy imbalance in the system, having an electricity storage technology helps to balance the system in an easy and cheap way. P2H is a promising storage technology, which converts water (H2O) into Hydrogen (H2) and Oxygen (O2) in order to store by using excess or cheaper energy in the grid. This technology is also able to convert stored hydrogen and oxygen gases to electricity when energy is required in the system or prices are more expensive.
3.1 Hydrogen as an Energy Carrier
Hydrogen exists in three isotopes: protium, deuterium, and tritium. The standard form of a hydrogen atom is protium and it is the simplest of all the elements and consists of one proton and one electron [3]. Hydrogen energy systems are used almost all around the world and it is produced from available energy sources as input for certain processes, e.g., hydrogen and oxygen are produced in large industrial plants.
On the other hand, hydrogen can be stored in underground caverns in large-scale and can be transported by pipelines or super tankers to hydrogen consumption areas. It is then used in generation of electricity or mostly chemical generation of natural gas by using enough carbon. However, hydrogen itself is not a primary source of energy. It is a secondary or intermediary form of energy or a form of energy carrier. However, hydrogen had not been used directly as a fuel or energy carrier except for space programs before twentieth century. It has been used in refineries to upgrade crude oil in the chemical industry. Alternatively, hydrogen can be produced from fossil fuels (e.g., steam reforming of natural gas, partial oxidation, thermal cracking of natural gas, coal gasification), biomass and water.
3.2 Hydrogen Production From Water
Different methods of hydrogen production from water have been developed, such as electrolysis, direct thermal decomposition or thermolysis, thermo chemical processes and photolysis.
Production of hydrogen from water by electrolysis is a more than 50-year-old tech-nology, which has been discovered by Faraday, based on a fundamentally simple process that is very efficient. The water is used as a source and with the given elec-trical energy, water decomposes to hydrogen and oxygen. The following reactions below show details of electrolysis at the electrodes of an electrolysis cell filled with a suitable electrolyte upon the application of a potential:
Cathode reaction : (2)H2Oaq + (2)e− → H2(g)+ (2)OH(aq)− (3.1)
Anode reaction : (2)OH(aq)− → (1/2)O2(g)+ H2O(aq) (3.2)
Overall reaction : (1)H2O(aq)+ (energy) → (1)H2(g)+ 1/2O2(g) (3.3)
Cathode reaction 3.1 chemically breaks he H20 bounds and it is an endothermic reaction which absorbs energy from the environment. The reaction continues at Anode 3.2 by turning the ions into gaseous form.
The reversible decomposition potential of the above reactions is 1.229 Volt (V) at standard conditions. The total theoretical water decomposition potential is 1.480 V corresponding to hydrogen’s enthalpy. Due to irreversible processes occurring at the anode and cathode, including the electrical resistance of the cell, the actual potentials are always higher, typically between 1.75 and 2.05 V. This corresponds to the efficiencies of 72 to 82 percent. Faraday’s basic equation also proves that the energy generation is possible with the reverse process. According to studies by US Department of Energy, in order to generate 1 kg of hydrogen gas from electrolysis, 50 kWh of electricity is required and when the electrolysis process is reversed, it can produce 40 kWh of electricity.
A recent electrolysis technology is Proton Exchange Membrane (PEM) technology. PEM technology works using a proton-exchange membrane as the electrolyte. This membrane has a special property: it is permeable to protons but not to gases, such as hydrogen and oxygen. This means that in an electrolytic process the PEM acts as a separator to prevent mixing of the gas products.
Electrodes are attached on both sides of the proton-exchange membrane. Voltage is applied to the electrodes causing the water to decompose into oxygen, hydrogen ions, and free electrons. The membrane only allows the hydrogen ions to pass through. When they arrive on the other side, they encounter the free electrons with which they combine to form hydrogen. PEM technology is still relatively young, but it has enormous potential also capable of capturing the increasingly large amounts of energy from wind and solar electricity so that it can be transformed and used as required. The hydrogen obtained in this way is valuable and a versatile product for use in industry, for fuel cell mobility applications, and for re-conversion into electricity for a later time.
Some of the advantages of the PEM electrolysis technology are listed as:
• The technology has low maintenance needs. • The hydrogen produced is CO2 free.
• No hazardous substances are used which reduces the risks for the operators and increases the lifetime of the system.
Figure 3.1 Process of reverse electrolysis for generating electricity
PEM electrolyzers require no liquid electrolyte, which simplifies the design signif-icantly. The electrolyte is an acidic polymer membrane. PEM electrolyzers can potentially be designed for operating pressures up to several hundred bar. The ef-ficiency of PEM Technology is up to 85 percentage. The technology only requires electricity and hydrogen, since oxygen may be absorbed from the air. Figure 3.1
explains how the PEM technology works.
Another method to produce hydrogen from water is Direct Thermal Decomposition of Water, which is known as “thermolysis”. Water can be split thermally at temper-atures above 2000 Kelvin [3]. The overall thermal dissociation of water is formulated as in equation (3.4).
H20 → (a)H2O + (b)OH + (c)H + (d)O + (e)H2 + (f )O2 (3.4)
The main problems in connection with this method are related to the materials required for extremely high temperatures, recombination of the reaction products at high temperatures and separation of hydrogen from the mixture [5].
Thermo-chemical production of hydrogen is another method to produce hydrogen from water and it involves the chemical splitting of water at temperatures lower than those needed for thermolysis, through a series of cyclical chemical reactions, which ultimately release hydrogen. Depending on the temperatures, relatively high efficiencies are achievable (e.g., 40 to 50 percent). However, the problems related to this method are the movement of large mass materials in chemical reactions and the toxicity of some of the chemicals involved [6].
Direct extraction of hydrogen from water using only sunlight as an energy source can be accomplished by photo biological systems, photochemical assemblies or photoelectro-chemical cells [6]. This method is known as “photolysis”, which is one of the well-known hydrogen production methods from water.
3.3 Hydrogen Storage
Hydrogen as an energy carrier must be stored in order to overcome daily and seasonal discrepancies between energy source availability or changes in demand. Hydrogen
can be stored either as a pressurized gas or as a liquid. Hydrogen can also be stored in chemical or physical combination with other materials, such as metal hydrides, chemical hydrides, glass microsphere, and cryo-adsorbers. Depending on capacity size and application, a few sorts of hydrogen storage may be differentiated: stationary large storage systems, stationary small storage systems, mobile storage systems, vehicle tanks. Because of hydrogen’s low density, its storage generally requires extensive volumes and is related with either high weights or extremely low temperatures.
Underground storage of hydrogen in caverns, aquifers, depleted petroleum and nat-ural gas fields, and man-made caverns resulting from mining and other activities is likely to be technologically and economically feasible [32]. Hydrogen storage systems of the same type and the same energy content will be more costly by around a factor of three compared to gaseous natural gas storage systems due to hydrogen’s lower volumetric warming quality. The city of Kiel’s public utility has been storing town gas with a hydrogen content of 60 to 65 percent in a gas cavern with a geometric volume of 32,000 m3 and a pressure of 80 to 160 bar at a depth of 1,330 m since 1971 [25]. Gaz de France, the French National Gas Company, has stored hydrogen-rich refinery by-product gases in aquifer structure near Beynes, France. Imperial Chemical Industries of the United Kingdom stores hydrogen in the salt mine caverns near Seaside, UK [35].
Above-ground pressurized gas storage systems are used today in natural gas busi-ness in various sizes and pressure ranges from standard pressure cylinders (50,200 bar) to stationary high-pressure containers (over 200 bar) or low-pressure spheri-cal containers ( <30,000 m3, 12 to 16 bar). This application range is similar for hydrogen.
Production of liquid hydrogen or liquefaction is an energy-intensive process, typically requiring amounts of energy equal to about one-third of the energy in liquefied hydrogen [28]. Novel liquefaction methods are being investigated in order to reduce
energy requirements and costs. Magnetic liquefiers, for example, are expected to offer higher efficiency than conventional equipment, as well as reduced size and cost [4]. Hydrogen liquefaction and use of liquid hydrogen is usually practiced only where achieving high storage density is absolutely essential, such as in aerospace applications. The US National Aeronautics and Space Administration (NASA) uses a spherical tank with a geometrical capacity of 3,800 cubic meters. Evaporation losses from large stationary tanks are small, less than 0.1 percent per day [25]. However, smaller and particularly mobile tanks have much higher evaporation losses of about 2 to 3 percent per day.
One of the important challenges to overcome to make hydrogen an economic source of energy is the storage of hydrogen efficiently, economically and safely [24]. Presently, there are some hydrogen storage technologies available, most applicable ones are high-pressure gas compression, liquefaction, and metal hydroxide storage.
High Pressure Gas Compression is the most common used storage method. It consist of gas compression to lower the volume and high pressure for gaseous fuels. Because of hydrogen has a lower specific gravity than other fuel gases, it takes more energy to compress hydrogen for a given mass and compression ratio. The volumetric storage density of Hydrogen per kg per m3 at 250C can be calculated by 0.0807 P, based on thermodynamic rules. The efficiency of energy storage by compressed hydrogen gas is about 94 percent. It is noted that volumetric storage density increases due to the hydrogen storage pressure, yet the overall energy efficiency will decrease.
Commonly used materials for the production of pressure vessels are steel, aluminum, carbon fiber, epoxy resins, and polyethylene. These materials, consumed at a rate of about 20 to 100 kg for every 1 kg hydrogen storage capacity, are neither environ-mentally detrimental nor hazardous. In general, the safety concerns about hydrogen storage are same as those for storage of common fuel gases. As hydrogen gas is much lighter than air, any hydrogen leak will flow upward and disperse quickly. Accumu-lation of hydrogen around the source of leakage is less likely in comparison with
other fuels in gaseous form. Therefore hydrogen is less hazardous in comparison. The amount of the energy is used to press the hydrogen is about 2.2 kWh/H2-kg.
Production of liquid hydrogen or liquefaction is an energy intensive process, typically requiring amounts of energy equal to about one third of the energy in liquefied hydrogen. In order to minimize energy requirements and costs, novel liquefaction methods are being investigated. Hydrogen liquefaction and use of liquid hydrogen is usually practiced only where achieving high storage density is absolutely essential, such as in aerospace applications. Hydrogen gas gets 788 times smaller when it changes its phase from gas to liquid. Which means, lots of amount of hydrogen is able to be stored even in smaller places. The liquified material tanks have common usage on LNG sector. The tanks have high functional performance and contain low risk materials.
Some metals and alloys are able to form metal hydrides with hydrogen. Hydrogen molecules are split and hydrogen atoms are inserted in spaces inside the lattice of suitable metals or alloys, during the formation of the metal hydride. Hydrating substances is the safety aspect as an advantage of that method. Since hydrogen that remains in the metal structure has an extreme damage potential to hydride, tank would not pose fire hazard. On the other hand, transportation of stored hydrogen is hard with this method because of the high density of metals.
An example of hydrogen energy storage system is used by The Schatz Solar Hydrogen Project. The only difference is the source of hydrogen storage mechanism which includes solar panels. This project showed that hydrogen can be utilized in order to store energy obtained from the sun. The whole structure is fueled by the air blower that circulates air through the aquaria at Humboldt State University’s Telonicher Marine Laboratory in Trinidad, California. The structure harnesses solar energy to control the blower specifically. Moreover it yields hydrogen that fueled the blower when the sun was not accessible. The outcomes were the fish appreciated air bubbles which is fed by solar energy throughout a day and a sustained system. For the
sun powered hydrogen cycle, procedure of electrolysis is employed in order to expel hydrogen from the regular water by harnessing the solar energy. The hydrogen would then be able to be put away or transported. Accessible energy is formed at the point when hydrogen meets the oxygen again. No assets are expended and the main result is unadulterated water. For that revolution, hydrogen is an energy bearer; it enables us to store and mobilize solar energy in vast amounts. Daylight hits the solar PV which converts sunlight into power. This power is initially utilized to control the air blower sheerly. At the point when more energy is accessible than the blower needs, the overabundance power controls an electrolyzer, which separates water into oxygen and hydrogen. The oxygen in gaseous form released to the environment, and the hydrogen gas is put away in tanks near the facility. At the point that the solar PV do no longer acquire adequate daylight to run the compressor (both for during nightfall or when the weather is cloudy), the machine robotically switches power drain from the fuel cell. Consequently pre-made and kept hydrogen is combined again with the oxygen obtained from the environment - fundamentally the reversal of the electrolysis process. The harnessed solar energy is essentially being stored via hydrogen as a carrier, so the power is accessible at whatever point that it is required. [27]
3.4 PEM Technology
PEM electrolysis is credited to General Electric who brought forth further advance-ments through the 90s. Until now, PEM electrolysis has applications in the chemical and metallurgical ventures, just as with NASA and the U.S. Naval force. Reference 3.2 gives some of the oldest examples of PEM systems around World [20].
Proton exchange membrane (PEM) fuel cells and electrolysers are moving toward specialized development and more economically feasible. Business organization has begun in a few districts of the world (e. g. Japan, California, Europe). Energy organizations, modern gas organizations, unique gear producers for vehicles, and other industry partners have situated themselves and set up support gatherings
Figure 3.2 Some of the examples of PEM systems around the World [2]
(e. g. the Hydrogen Council) to exploit this possibly vast and quickly developing business sector. They plan to realize the best utilization of existing foundation (for example the gas grid).Additionally replacing hydrogen from renewables which are considered completely unlimited amount of energy source with limited amount fossil fuel based energy generation.
To accomplish the objectives in the Paris Agreement, the worldwide energy frame-work must experience a significant change from one greatly dependent on petroleum derivatives to an effective, efficient and sustainable low-carbon energy framework. As indicated in an investigation by the International Renewable Energy Agency, more than 90 percent of the essential worldwide CO2 emission could be decreased by these measures; sustainable power source is being replaced with 41 percent of the required energy outflow and an extra 13 percent through electrification.
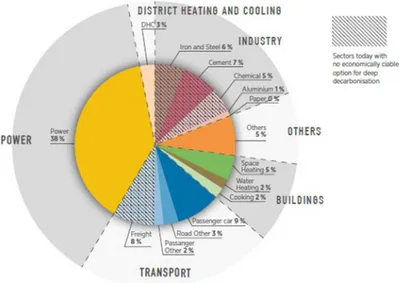
Today, 33 percent of worldwide energy related outflows originate from monetary areas for which there is no financial option in contrast to non-renewable energy sources.And the emissions mostly caused by the energy serious industry divisions and cargo transport. 3.3 shows the breakdown of global energy related CO2 emissions by sector.
Hydrogen could be the “missing connection” in the energy progress from a spe-cialized viewpoint. Hydrogen from inexhaustible power enables a lot of sustainable
Figure 3.3 Breakdown of global energy-related CO2 emissions by sector in 2015
power source to be diverted. For instance, the power division into parts, for which electrification (and subsequently decarbonisation) is generally troublesome, for ex-ample, transport, structures and industry. Hydrogen could in this manner assume a key job in encouraging three positive results: the decarbonisation of these divisions; the mix of a lot of variable sustainable power source; and the decoupling of variable sustainable power source and utilization through the generation of transportable hydrogen [2].
The hydrogen business is entrenched and has many years of involvement in industry segments utilizing hydrogen as a resource. The hydrogen resource advertise has an absolute evaluated estimation of USD 115 billion and is relied upon to develop fundamentally in the coming years, coming to USD 155 billion by 2022. In 2015 complete worldwide hydrogen request was assessed to be 8 exajoules (EJ) (Hydrogen Council, 2017). Just around 4 percent of worldwide hydrogen supply is created by means of electrolysis, chiefly with chlor-alkali base procedures. Hydrogen is an energy transporter and not a wellspring of energy. It very well may be created from a wide assortment of energy sources. Verifiably, hydrogen has been heavily created from fossil sources. In a low-carbon energy future, hydrogen offers new pathways to appraise sustainable power sources. This viewpoint report centers around hydrogen
delivered from sustainable power by means of electrolysis – alluded to, all the more basically, as “hydrogen from inexhaustible power”, or in industry speech as ”power to-hydrogen”.
An electrolyser is a gadget that parts water into hydrogen and oxygen utilizing power. Electrolysers offer an adaptable load that can give minimal effort adjusting administrations (here and there) to the power grid while delivering hydrogen for versatility applications, modern uses, or infusion into the gas grid. The inherent stockpiling limit of downstream parts (gas framework, hydrogen inventory network and so on) can be utilized as a cradle to modify hydrogen creation (and consequently power utilization) progressively relying upon the necessities of the power framework. Also to retain variable sustainable power source potentially over significant lots in this manner taking into consideration regular stockpiling. In the medium to long period, hydrogen could turn into an approach to transport and disseminate sustainable power source between distant places, particularly in those situations where the power lattice has lacking limit or when it is excessively unfeasible or costly to assemble. This may be the situation with offshore wind, where hydrogen could be delivered offshore and after that to be transported to the shore through natural gas pipelines, either changed over existing offshore pipelines or newly built. Areas with rich and modest sustainable power sources could deliver hydrogen for transport to locales with either constrained potential or greater expenses of renewable power generation. Transport of sustainable power source by means of hydrogen could be created at various scales, from neighborhood to worldwide. This last choice is being researched in a few nations either with copious sustainable power source potential (e. g. Australia) or with restricted indigenous sustainable power source potential, for example, Japan.
Three primary electrolyser advances are utilized or being produced today. Alkaline electrolysers have been utilized by industry for almost a century. Proton exchange membrane (PEM) electrolysers are financially accessible today and are quickly pick-ing up market footpick-ing as, among different components, they are increaspick-ingly
adapt-able and will in general have a littler impression. Strong oxide electrolysers hold the capability of enhanced vitality productivity however are still in the improvement stage and, dissimilar to alkaline electrolysers and PEM, work at high temperatures. Cutting edge PEM electrolysers can work more adaptably and responsively than current alkaline electrolysers innovation. This offers a huge preferred standpoint in enabling adaptable activity to catch incomes from numerous power markets, as PEM innovation offers a more extensive working extent and has a shorter reaction time. Systems can be kept up in remain by mode with insignificant power utilization and can work for a brief span period (10– 30 minutes) at higher limit than nominal load (past 100 percent, up to 200 percent). With both upward and descending direction ability, a PEM electrolyser can give ability to provide value frequency containment reserve without giving up accessible creation limit. At the end of the day, adminis-trators of PEM electrolysers can supply hydrogen to their customers (for industry, portability or infusion into the gas network), while as yet having the capacity to furnish auxiliary services to the framework with low extra CAPEX and OPEX, gave that adequate hydrogen stockpiling is accessible. Electrolysers work all the more productively at lower stack, with an irrational effect on hydrogen cost: in spite of most resources in the power sector, PEM electrolysers have a higher effectiveness when worked underneath nominal load. This is shown for a PEM creation plant in the 3.4 (MPa = megapascal; Nm3 = normal cubic metre).
Figure 3.4 Hydrogen production and efficiency as a function of the total power consumption of a PEM production plant [2]
Most of the big generator components’ producers continue their Research and Devel-opment operations which have remarkable impact on the cost of Pem Technology day after day. With the continuing studies, both Capex and Opex of PEM technology has been decreasing. There are several different studies to represent approximate cost of PEM Technology. One of the biggest market providers of PEM Technol-ogy is Proton OnSite and based on their studies, total CAPEX to generate 0.05 USD/kWhr electricity is 1.52 USD/kWh with 20 years amortization range. The operational cost to use the system is 3.6 USD. This study shows that, if we have 200 MW storage capacity, total CAPEX of that storage is around (1,52*200*1000) 305,000 USD with 20 year of amortization. This cost is changeable based on the uti-lization of the system. Also it is not right way to calculate the real Capex and Opex volume by using direct proportion since cost of some materials are not change. One of the cost studies about PEM Technology is prepared by Battelle Memorial Insti-tute for U.S. Department of Energy. Based on that study, A PEM system includes the fuel cell stack, hydrogen supply, air supply, controls and sensors, cooling system, electrical equipment, and assembly and support hardware. The estimated cost of the study is in excess of 10,300 USD for each 5-kW system. The cost increases to over 13,200 USD for a 10-kW system at the same production volume. This study also proves that direct proportion method is not right way to calculate Capex of 200 MW storage system.
A study prepared by United States Secretary of Energy at January 2017 details costs of PEM Technologies. For 500,000 units of annual production rate PEM system, total net cost details as 2.39 USD/kW. Means that, total membrane cost of 200 MW system is around 480,000 USD.
Figure 3.5 Cost analysis of PEM system
Figure 3.6 Cost summary for anode catalyst synthesis and materials
This study shows that, total cost of PEM system is around 3,94 USD/kW. Since the increase of capacity does not effect on total cost with the parallel increment rate, the total CAPEX of PEM system for 200 MW capacity is around 790,000 USD. The same study also details the operational cost of the system as shown in 3.7
Figure 3.7 Operational cost details of PEM cells
All of the studies detail costs for different capacity systems. Since the direct pro-portion calculation is not an exact match method for the cost calculation, the clear conclusion about the cost of PEM System for 200 MW capacity is between 480,000 USD and 790,000 USD. OPEX of the system breaks down with the increasing ca-pacity. Since the studies show the operational cost of PEM Cell system is between 3.6 USD and 9.67 USD per kWh and the operational cost decreases with the in-creasing capacity, operational cost of 200 MW system should be much less than this range.On the other hand, the biggest install capacity PEM Plant ever built has 2 MW of capacity. Since the size of PEM Cells is really small, it possible to build 100 different cells together. Today, most of the countries have trains or busses which are working by using generated energy by PEM Cells. [7]
On the light of these studies, the total cost of PEM Technology is higher than other storage methods. However, with the high cost, PEM system has more amortization time than other methods, clean and quick source of energy. Furthermore, Hydrogen Storage System is suitable system to transport energy easily.
4.
SELF-SCHEDULING WITH HYDROGEN STORAGE
4.1 Stochastic Programming and Risk Measures
The main goal of the optimization model proposed in this thesis is to maximize the profit of an electricity generation company which operates in a deregulated elec-tricity market. However, there are many uncertain parameters (e.g., market prices, demand, intermittency and availability of the generation) to be input into this model and a deterministic approach may only use the expected values for this uncertain values. A stochastic approach would provide an adequate modeling framework where there is uncertainty in decision making process. This uncertainty is usually char-acterized by a stochastic processes describing the uncertain parameters and each uncertain parameter is usually modeled by a set of finite scenarios, where each scenario represents a plausible realization of the uncertain parameters with an as-sociated probability of occurrence (i.e., a probability distribution). As a result of uncertain parameters characterized by a probability distribution, the objective func-tion is also uncertain and needs to be characterized as a random variable. Hence, the models in this thesis are formulated as a stochastic mathematical program with uncertain parameters (see [9] for details).
The concept of risk is directly linked to the likelihood of obtaining undesirable results from a probability distribution (e.g. a low profit outcome with a high probability as a result of a decision). Generally, stochastic programming problems optimize an objective function (e.g., expected profit) and the focus of the decision maker is on the expected value of the objective function, ignoring distribution of it. This type of models are referred as risk-neutral models. On the other hand, when the decision maker accounts for risk, the objective function values for the worst scenarios are
considered in addition to the expected value. This constitutes a risk-averse model. In a stochastic decision making process, risk averse models includes measures that provide a control mechanism by decision makers to avoid implementing strategies that may possibly cause undesirable results (e.g., low profits or high costs). A risk measure embedded into modeling of a decision-making problem may help to manage this process.
Considerable number of risk measures are mentioned in the literature, but particular measures such as Value-at-Risk (VaR) and Conditional Value-at-Risk (CVaR) are most useful. Considering those alternatives, the CVaR comes to the forefront by the following reasons:
1. By employing a linear formulation, CVaR can be embedded into a problem.
2. CVaR is a compatible risk measure, it provides such features as monotonicity, translation invariance, positive homogeneity and sub-additivity [9].
Figure 4.1 The connection among VaR and CVaR
CVaR, which is also known as mean excess loss or average value-at-risk, is an exten-sion of VaR that provides the aggregate sum of the benefit given a certainty level. CVaR is determined as a portfolio’s likelihood weighted normal benefit and expected to be lower than VaR. The connection among VaR and CVaR is shown in figure 4.1, in which CVaR is the normal benefit estimation of the territory on the left of VaR. CVaR presents the expected value of profit of the area on the left of VaR which represents lower profit than VaR. Pointing out that the region on the left of VaR speaks to the benefit that is lower than VaR. Cumulative probability in this region
is equal to (1 − α) [17]. Confidence level (α) corresponds to the right side (larger than VaR) of the figure and it is the cumulative probability. In this case, confidence level is equal to α and is generally determined as 95 or 99 percent.
One of the most important risk in energy industry is the price risk and CVaR is the most widely used risk measure to model it in the literature. The loss distribution caused by the fat tail behavior as energy prices are taken into consideration by using CVaR downside risk measurement. For a given time presence and a confidence level (β) and with probability less than 1−β the conditional value at risk at the confidence level β is the smallest cost over the time presence. This means that cost of CVaR with a certain confidence level provides the loss distribution.
In this thesis, the objective function of the self-scheduling problem includes a CVaR risk measure for the forecasted market clearing prices. This is the reason for adding a negative value of conditional variation of risk to the objective function. Without taking into account the risk factor, the profit gets higher under no risk constraint. CVaR (an effective financial risk measure for the optimization model) is used with a weighting factor (β) to achieve an appropriate trade-off between profit and the value at risk (ζ). The factor β, ranging between 0 and 1, shows risk aversion for the trade-off between financial loss and profit. Higher β comes with higher risk and lower β brings lower risk. Note that lower risk of profit variability corresponds to a higher CVaR (see chapter 4 in [9] and references therein for further details in “Risk Management”).
4.2 Overview of Self-Scheduling Models
Accelerating renewable energy and storage system investments has created a large volume of renewable energy generation. Together with the rapid developments in the smart grid technologies, this has attracted academic and industry attention to energy storage in power systems. Many researches and energy policy makers have already focused on system reliability, more flexibility of the system and also
environmental friendly operations of the power system. There are many research work available in the literature regarding the energy storage optimization problem. In this literature review section, prominent research studies are reviewed.
In [18], the authors present a power producer who trades generated energy volumes via the weekly contracts and trades in the market. This article presents a stochastic programming model and self-schedules the weekly generation of a producer. The modeling framework includes uncertainty characterization and scenario tree, decision sequence, forward contract model, production unit model and the risk model. The study aims to achieve a trade-off between modeling accuracy and computational efficiency. First day of the week (Monday) is modeled hourly and the rest of the week is modeled based on peak (08-20), shoulder(21-23) and valley (00-07) hours. A scenario tree is used for the uncertainty characterization of the market prices. The scenarios have equal probabilities and involve a stochastic process to describe them in details. The decisions to be made are separated for the opening day of the week (Monday) and for each hour of Monday as well as for each period in the rest of the weekdays. The decision sequence is presented conjointly for the sake of clarity. The forward contracts are modeled for a multi-block period and span the whole week. Operating costs, including start-up and shut-down costs are piece-wise modeled as linear costs, while production units are modeled using the constraints for maximum capacity, minimum power output and up-down ramping limits. The risk model of the study includes a CVaR measure for the risk of profit variability. Risk factor (α) is considered between 90 and 99 percent and a higher CVaR corresponds to a lower risk of profit variability. The study assumes a generation plant that trades its generation volume in the pool and via forward contracts in a period of week. Moreover this study provides a procedure that enables the generation owner to self-schedule of itself. Moreover, it has also decide on week by week forward contract amounts as well as the bidding strategy for Monday’s pool. The methodology is based on a stochastic program that enables the generation owner to maximize its expected revenue while managing the risk of variance for this revenue. Trading energy in the pool involves high revenue instability as pool prices shifts, whereas
trading through forward contracts at fixed prices provides more predictability. This choice allows the generation owner to exploit earnings during times of high pool prices. Hence, this model help generation owner to decide its optimal contribution in the pool and the forward contracts.
In [8], the authors focus on a hydro system which has several cascading plants in a river basin and a self-scheduling model in a pool based electricity market. Aim of this study is to maximize the profit in a day-ahead market by using linear mixed integer programming for the cascading plants through nonlinear relationship between the water discharge and generated energy. The study concludes by different realistic case studies including start-up costs.
Reference [11] represents a self-scheduling model for a price-taker power producer. This study considers a risk model which underlines the trade-off between risk and profit with a mixed integer quadratic programming problem and a self-scheduling model is presented. The case studies in the article points out that plant revenues are dependent to each other and the risk can be measured by variance, e.g., the higher the variance the higher is the risk. On the other hand, the authors in [37] propose a self-scheduling problem under risk constraints for a price taker generation company, which generates electricity for a competitive day-ahead market.
Another study [26] points out a model that focuses on forecasting of electricity prices. This study uses autoregressive integrated moving average (ARIMA) and ar-tificial neural network (ANN) with back propagation forecasting methodology for a day-ahead market. Another time series forecasting method, seasonal ARIMA (SARIMA), and the historical data is used for comparison. ANN is able to get the nonlinear relation among time-series data while SARIMA provides a linear se-quence of the past values. This strategy allows to observe a multi-layer feed forward network structure clearly. A hybrid ARIMA-ANN model is proposed for more effec-tive results. The time series data is processed by Box-Jenkins method to clarify a SARIMA which includes three steps as: identification, estimation and verification.
As a final step, the residuals of the fitted SARIMA model are used as inputs for the ANN model to forecast the error sequence of the fitted model as depicted in Figure 4.2.
Figure 4.2 Out of sample testing of [26]
In [19], the authors focus on decreasing the risk of the fluctuating prices by using a robust self-scheduling optimization. It includes a CVaR measure, which is a more consistent measure than VaR. On the other hand, [29] expands the forecasted revenue of a hydro-energy producer by using stochastic linear and non-linear programming for the scheduling of forward contracts in each period and scenarios. Moreover, [10] points out the ideal association in a futures power market of a generation owner to hedge against the risk of pool price instability. In this case, the trading time-span is a year. A stochastic programming model with response is utilized to model the decision-making problem. They have employed a scenario reduction method for computational efficiency. Moreover, risk is conveniently modeled by using a CVaR measure. A realistic case study is presented and numerical results are analyzed.
In [17], high penetration in wind generation problem which causes fluctuations in local marginal prices is addressed. In this case, the scheduling decision for load serv-ing entities with energy storage (chargserv-ing, dischargserv-ing) becomes more complicated. The authors propose a risk-constrained scheduling model, which maximize the load serving entities’ profit under financial loss risk with optimum charge and discharge
![Figure 3.2 Some of the examples of PEM systems around the World [2]](https://thumb-eu.123doks.com/thumbv2/9libnet/4342304.71956/37.892.256.722.124.359/figure-examples-pem-systems-world.webp)
![Figure 3.4 Hydrogen production and efficiency as a function of the total power consumption of a PEM production plant [2]](https://thumb-eu.123doks.com/thumbv2/9libnet/4342304.71956/40.892.260.706.798.1037/figure-hydrogen-production-efficiency-function-total-consumption-production.webp)
![Figure 4.2 Out of sample testing of [26]](https://thumb-eu.123doks.com/thumbv2/9libnet/4342304.71956/48.892.171.768.220.603/figure-out-of-sample-testing-of.webp)