KADIR HAS UNIVERSITY
GRADUATE SCHOOL OF SOCIAL SCIENCES BUSINESS ADMINISTRATION DISCIPLINE AREA
THE IMPACT OF HRM PRACTICES ON JOB SATISFACTION IN
YEMEN: THE CASE OF ALKURAIMI BANK
ABDULRAQEB ALABARAH
SUPERVISOR: ASST. PROF. DR. NUR CAVDAROGLU
MASTER’S THESIS
THE IMPACT OF HRM PRACTICES ON JOB SATISFACTION IN
YEMEN: THE CASE OF ALKURAIMI BANK
ABDULRAQEB ALABARAH
SUPERVISOR: ASST. PROF. DR. NUR CAVDAROGLU
MASTER’S THESIS
Submitted to the Graduate School of Social Sciences of Kadir Has University in partial fulfillment of the requirements for the degree of Master’s in the Discipline Area of Business Administration under the
Program of MBA
ACKNOWLEDGEMENTS
It has been real opportunity to gain a lot of experience and knowledge during my study in KADIR HAS UNIVERSITY. Firstly, I would like to express my deep appreciation to my parents especially my father who push me to the first step of getting knowledge and this gratitude also goes to my unique advisor, Nur Cavdaroglu, for her support, patience, and encouragement throughout my graduate studies.
Besides that, I would like to thank Prof. Nimet Uray for her meaningful helping in understanding the methods of research and her cooperation and support.
Furthermore, I am so grateful to my wife Wafa for her understanding and love during the past few years. Her support and encouragement were in the end what made this dissertation possible.
Last but not least, my best thanks go for my workmate and managers in Belquess channel who provide me time to
TABLE OF CONTENTS
ACKNOWLEDGEMENTS ... iii LIST OF TABLES ... vi ABSTRACT ... vii ÖZET viii CHAPTER 1 ... 1 INTRODUCTION ... 1 1.1 INTRODUCTION ... 1 1.2 RESEARCH QUESTION ... 3 1.3 RESEARCH OBJECTIVES ... 31.4 SIGNIFICANCE OF THE STUDY ... 3
1.5 HYPOTHESIS OF THE STUDY ... 4
CHAPTER 2: ... 5
LITERATURE REVIEW ... 5
2.1 INTRODUCTION ... 5
2.2 JOB SATISFACTION ... 5
2.3 HUMAN RESOURCE MANAGEMENT ... 6
2.4 HUMAN RESOURCES MANAGEMENT PRACTICES ... 6
2.4.1 Recruitment and Selection ... 7
2.4.2 Training and Development ... 8
2.4.3 Performance Appraisal (Pa) ... 9
2.4.4 Compensation ... 10
2.4.5 Job Security ... 11
2.4.6 Job design ... 11
2.4.7 Promotion ... 12
2.4.8 Work Environment ... 12
2.4.9 Recognition and appreciation ... 13
CHAPTER 3: ... 14
RESEARCH METHODOLOGY ... 14
3.1 INTRODUCTION ... 14
3.2 RESEARCH DESIGN ... 14
3.3 DATA COLLECTION METHODS ... 15
3.4 DATA COLLECTION INSTRUMENTS ... 16
3.5 DATA ANALYSIS TECHNIQUES ... 16 3.5.1 Descriptive Analysis ... 17 3.5.2 Reliability Test ... 17 3.5.3 Inferential Analysis ... 18 CHAPTER 4: ... 19 ANALYSIS RESULTS ... 19 4.1 INTRODUCTION ... 19 4.2 RELIABILITY ANALYSIS ... 19 4.3 DESCRIPTIVE ANALYSIS ... 20
4.3.1 Descriptive Statistics Of Job Satisfaction ... 20
4.4 INFERENTIAL STATISTICS ... 37
4.4.1 Correlation Analysis ... 38
4.4.2 Hypotheses Testing ... 38
4.5 RESEARCH FINDINGS OF HRM PRACTICES ... 40
CHAPTER 5: ... 43
CONCLUSION AND RECOMMENDATION ... 43
5.1 INTRODUCTION ... 43
5.2 RECOMMENDATIONS ... 43
5.3 LIMITATIONS OF THE STUDY ... 44
5.4 CONCLUSION ... 45
REFERENCES ... 46
APPENDICECS ... 50
LIST OF TABLES
Table 4. 1 Reliability Statistics of HRM Practices and Job Satisfaction ... 19
Table 4. 2 Descriptive statistics of job satisfaction ... 20
Table 4. 3 Descriptive Statistics of Recruitment and Selection ... 21
Table 4. 4 Descriptive Statistics of Training and Development ... 22
Table 4. 5 Descriptive Statistics of Compensation ... 23
Table 4. 6 Descriptive Statistics of Performance Appraisal ... 24
Table 4. 7 Descriptive Statistics of Working Environment ... 25
Table 4. 8 Descriptive Statistics of Job Design ... 26
Table 4. 10 Descriptive Statistics of Job Security ... 27
Table 4. 11 Descriptive Statistics of Recognition and Appreciation ... 28
Table 4. 12 Descriptive analysis of HRM practices... 29
Table 4. 13 Gender Analysis ... 30
Table 4. 14 Age analysis ... 30
Table 4. 15 Education analysis ... 31
Table 4. 16 position analysis ... 31
Table 4. 17 length service analysis ... 32
Table 4. 18 descriptive analysis for HRM practices based on age ... 33
Table 4. 19 Descriptive analysis for demography based on Education ... 34
Table 4. 20 Descriptive analysis for demography based on position... 35
Table 4. 21 Descriptive analysis for demography based on length of services ... 36
Table 4. 22 correlation coefficient ... 38
Table 4. 23 model summary ... 39
ABSTRACT
ABDULRAQEB ALABARAH R. THE IMPACT OF HRM PRACTICES ON JOB
SATISFACTION IN YEMEN: THE CASE OF ALKURAİMİ BANK, MASTER’S THESIS, Istanbul, 2019.
This study is done to explore and define the impact of human resource practices on job satisfaction of employees in ALKURAIMI bank in Yemen. In a world full of changes there is a crucial need to acquire better knowledge about the problems and things that affects employees since the employees are the most important asset for any organization.
The core objective of this research is to find and explore the impact of human resource management practices in ALKURAIMI bank in Yemen. These practices include recruitment and selection, performance appraisal, training and development, compensation, working environment, job design and responsibilities, promotion, job security and appreciation.
For our research, we focused on the case of ALKURAIMI bank in Yemen. A questionnaire has been distributed for around 500 Hundred of employees and 91 of them responded. We collected that primary data and used Statistical Package for Social Science (SPSS) computer software program to analyze data. Finally, the research is concluded with findings and recommendations for the bank to improve their HRM practices.
Keywords: HRM, Job Satisfaction, Turnover, Performance, Compensation, Benefit, Safety and Health.
ÖZET
ABDULRAQEB ALABARAH R. İKM UYGULAMALARININ YEMEN'DEKİ İŞ MEMNUNİYETİNE ETKİSİ: ALKURAİMİ BANKASI'NIN VAKFI, YÜKSEK LİSANS TEZİ, İstanbul, 2019.
Bu çalışma, insan kaynakları uygulamalarının Yemen'deki ALKURAIMI bankasında çalışanların iş tatmini üzerindeki etkisini araştırmak ve tanımlamak amacıyla yapılmıştır. Değişikliklerle dolu bir dünyada, çalışanları herhangi bir kuruluş için en önemli varlık olduğu için çalışanları etkileyen problemler ve şeyler hakkında daha iyi bilgi edinmeye çok ihtiyaç var.
Bu araştırmanın asıl amacı, Yemen'deki ALKURAIMI bankasında insan kaynakları yönetimi uygulamalarının etkisini bulmak ve araştırmaktır. Bu uygulamalar işe alım ve seçme, performans değerlendirme, eğitim ve gelişim, ücretlendirme, çalışma ortamı, iş tasarımı ve sorumlulukları, terfi, iş güvenliği ve takdirini içerir.
Araştırmamız için Yemen'deki ALKURAIMI bankası örneğine odaklandık. Yaklaşık 500 yüz çalışanı için bir anket dağıtılmış ve 91 tanesi yanıtlamıştır. Bu birincil verileri topladık ve verileri analiz etmek için Sosyal Bilimler için İstatistik Paketi (SPSS) bilgisayar yazılımı programını kullandık. Son olarak, araştırma, bankanın İKY uygulamalarını iyileştirmesi için bulgular ve tavsiyelerle tamamlanmıştır.
CHAPTER 1
INTRODUCTION
1.1 INTRODUCTION
In a world full of changes, there is a strong need to manage the operations of a firm. Nowadays, it has become crucial for every company or corporation to have a stable human resource management, which is able to deal with all the issues that corporations face. The microfinance banks in Yemen is among the rising economic sectors, so their human resource management issues must be handled with utmost importance. This need is becoming higher every day since these banks are dealing with thousands of people and employees.
Human resource management (HRM) is the effective management of people at work. Beardwell, Holden & Claydon (2004) regard HRM as the philosophy, policies, procedures, and practices related to the management of people within the organization. Among the organizational issues that require managerial attention comes the need of strong and flexible human resource in the first place.
HRM can also be considered as the utilization of individuals to achieve organizational objectives (Mondy and Noe, 2005). Denishi and Griffin (2009) suggest that HRM is the comprehensive set of managerial activities and tasks concerned with developing and maintaining a qualified workforce. The dimensions of HRM that affect the workforce morale and job satisfaction involve recruitment and selection process, training and development opportunities, performance appraisal methods, compensation packages, conditions in the work environment, job design, growth opportunity, job security and non-financial rewards and appreciation among others. Human resource is an important factor that contributes to organizational effectiveness. In most of today’s organizations, the role of HRM has become quite important (Blake,1995).
Job satisfaction, which can be defined as the employee being content with the work, he/she is doing, plays an essential role in retaining employees work for their organization and prevent them from transferring to another competitive organization. Job satisfaction is measured by the human resource practices that create spirit of commitment among employees.
Job satisfaction is a pre-requisite for employee performance in any company organization. It is important for both the employee and the employer in an organization. Job satisfaction provides them a sense of mental, physical, financial, technical and human security. It helps the employee to retain in the future in the organization
It is argued that low job satisfaction leads to high rates of employees’ turnover and that cause a lot of problems for the organization. Since it costs company a lot of time and money to train and develop qualified employees in the first place, maintaining a high job satisfaction for employees is essential and crucial. Hence, job satisfaction is very significant, since employees are the most valuable assets in the organization.
Griffeth,Hom and Gaertner (2000) give a negative association between job satisfaction and employees turnover. In addition, Glance, Hogg and Huberman (1997) mention the relationship between turnover and productivity asserting that lower turnover is positively correlated with productivity. Amah (2009) stresses that job satisfaction was found to have a direct negative relationship with turnover intention and the production system in the organization.
As we know, a lot of research and studies have been made in HRM practices that measure the impact of these practices on employees, but very few of them are related to the bank sector in Yemen. The activities in the banking sector depend heavily on relationships between the employee and the customer; therefore, one must pay much more attention to the HRM practices that organize these kinds of relationships in the banks. However, the HRM strategies and practices in Yemen are not broadly explored since the banking sector in this country does not give enough attention to the human resource, even though it is one of the most valuable assets of the organization.
Impact of HRM practices in Arabic countries are studied less and focus only in few practices like performance and compensation. Aiman (2002) mentions that job satisfaction has huge impact on the employee performance and behaviors as well as motivate origination for better achievement. She adds that failure in building robust job satisfaction will lead to organization failure. Ameen (2016) argues that job security has impact on the job satisfaction and performance of employees. He adds that organization needs to reduce turnover rate by improving working environment and response to the employee’s needs.
During my experience as an employee of the ALKURAIMI bank in Yemen, we observed that the employee turnover rate was high. Hence, in connection with the above discussion, I would like to explore this situation on this research and hope to shed light on the reasons of the high employee turnover rates and suggest solutions to reduces that rate.
In the light of my experience of working in HR units in the bank of Yemen, there exists a lot of issues that need to be addressed. I hope that this research attracts more attention to the area.
1.2 RESEARCH QUESTION
This study will focus on HRM practices in ALKURAIMI bank in Yemen and its impact on employee’s satisfaction. In comparison, only a few studies have been done in HRM in banks sector in Yemen. In this study, we hope to find answers to the following research questions:
Which human resources practices affect job satisfaction in Alkuraimi bank in Yemen?
How much does each one of these practices affect job satisfaction in Alkuraimi bank in Yemen?
1.3 RESEARCH OBJECTIVES
This research aims to analyze and explore the impact of human resource management practices on job satisfaction and those practices are recruitment and selection, training and development, compensation system, performance appraisal, working environment, job design, growth opportunity, job security and rewards and appreciation
1.4 SIGNIFICANCE OF THE STUDY
The study has a significant role due to the following reasons. In terms of the study environment, there is a lack of studies on HRM practices in Yemen since the human capital is not given sufficient attention in the developing countries. Moreover, in the previous studies, most researchers measured the job satisfaction based on three to five HRM practices. This study on the other hand considers nine practices and attempts to measure the impact of all of them on the job satisfaction. Hence, our study is among the very few works that analyze several HRM practices in a comprehensive manner.
1.5 HYPOTHESIS OF THE STUDY
H1: Recruitment and selection has significant and positive effect on employees’ job satisfaction in Alkuraimi bank
H2: Training and development has significant and positive effect on employees’ job satisfaction in Alkuraimi bank
H3: Performance appraisal has significant and positive effect on employees’ job satisfaction in Alkuraimi bank
H4: Compensation has significant and positive effect on employees’ job satisfaction in Alkuraimi bank
H5: Work environment has significant and positive effect on employees’ job satisfaction in Alkuraimi bank
H6: Job design has significant and positive effect on employees’ job satisfaction in Alkuraimi bank H7: Growth opportunity significant and positive effect on employees’ job satisfaction in Alkuraimi bank
H8: Job security has significant and positive effect on employees’ job satisfaction in Alkuraimi bank H9: Recognition and appreciation has significant and positive effect on employees’ job satisfaction in Alkuraimi bank
CHAPTER 2:
LITERATURE REVIEW
2.1 INTRODUCTION
In this chapter reviews of previous studies from scientific journals, reports books which relate to job satisfaction are addressed. The previous work that is addressed involve different combinations of human resource practices such as recruitment and selection, training and development, performance appraisal, compensation, job security, job design, work environment, promotion, recognition and appreciation.
2.2 JOB SATISFACTION
Job satisfaction has received significant attention from researchers in different fields in recent years. Part of the interest in job satisfaction is due to the correlation between satisfaction and the employee behavior. “More satisfied workers are less likely to leave their employer” (Clark, 2001). Shields and Ward 2001, Pergamit and Veum 1989, Akerloff et al. 1988, McEvoy and Cascio 1985, Freeman 1978), have lower rates of absenteeism (Clegg 1983) and have higher productivity (Mangione and Quinn 1975).
Job satisfaction can be defined as the attitude that employees have towards the job. Researchers define job satisfaction as behavior of the employees which are determined by issues such as salary, working conditions, control, promotion, social network, talent and some similar variables (Blum and Naylor, 1986). Another definition of job satisfaction is the collection of feeling and beliefs that people have about their current job. People’s levels of degrees of job satisfaction can range from extreme satisfaction to extreme dissatisfaction. (George et al, 2008).
Job satisfaction helps to retain employees and attracts other competent employees to the organization which brings benefits for the organization (Nabi et al., 2016). High job satisfaction relates to high productivity and low turnover and low absenteeism in the workplace (Hackman and Oldham,1975). That is, high job satisfaction can bring high talented employees to the organization and will positively affect in achieving organizational goals. High job satisfaction pushes the employees to increase their efforts and that improves productivity of company, in opposite of less
satisfied employees causing many problems for the organization. There are many factors that can affect job satisfaction such as compensation, work conditions, relations with top managers, promotion opportunities, etc.
Wong (1989) states that the employees are tending to leave their jobs if they feel low job satisfaction. His research emphasizes that low satisfaction levels at work tends to result in low level of commitment and productivity. Many researchers mentioned that low job satisfaction leads to high turnover since the employees could not find the motivation and recognition for their efforts, and for that reason employees wait for another job to leave. The problem of high turnover is that company is losing a lot in training and developing the employees.
2.3 HUMAN RESOURCE MANAGEMENT
Human resource management (HRM) is defined as comprehensive and coherent approach to the employment and development of the people. (Armstrong, 2006). Armstrong adds that HRM can be regarded as a philosophy about how people should be managed.
For any organization, human resource management is a crucial factor to face challenges of today’s business and to help organization to expand and grow. Those benefits and advantages will not be achieved without satisfied employees. In order to sustain employee satisfaction, proper HRM policies and practices should be practiced (Rahman, 2013).
The success of the organizations is measured by the competitive advantage they offer and for organizations human capital has certain qualities that make it valuable and different from others. This necessity makes HRM even more significant in today’s business world.
2.4 HUMAN RESOURCES MANAGEMENT PRACTICES
Edgar and Greare (2005) identify that HRM practices had a significant impact on employee job satisfaction, organizational commitment and organizational fairness.
HR practices and job satisfaction are studied widely in different parts of the world. Absar et al. (2010) assume that HR practices are closely associated with job satisfaction.
Teseem and Soeters (2006) study about eight HRM practices and policies and their relationship with job satisfaction in Eritrea. These HR practices are namely human resource management policy, human resource planning, policy and philosophy, recruitment and selection practices, placement practices, training practices, compensation practices, employee performance evaluation practices, motivational forces and factors, employee grievances, promotion practices, empowerment and physical and social safety security, self-esteem security and self-actualization security or pension. They find that economic and political environment within which HR practices operate has not been conducive in maximizing the impact of HR practices on performance.
In the previous studies of HRM practices, researchers addressed around five to eight practices. In contrast with other research, this study is going to discuss the impact of HRM practices on job satisfaction widely which can add value to previous literature. The practices that will be considered here are recruitment and selection, performance appraisal, training and development, compensation, working environment, job design and responsibilities, promotion, job security and appreciation. Next, we will review literature on each one of these dimensions one by one.
2.4.1 Recruitment and Selection
Recruitment is the process of generating a pool of capable people to apply for employment to an organization, and selection is the process by which managers and others use specific instruments to choose from a pool of applicants a person or persons more likely to succeed in the job (Bratton and Gold, 2007, p 239). The process of recruiting and selecting may come in four stages: defining requirement, planning recruitment campaign, attracting candidates and selecting candidates (Armstrong, 2010). According to Werner and DeSimone (2009), recruitment and selection techniques are required for the identification of potential applicants for current and future jobs and make appropriate choices.
Effectiveness and efficiency for any organization are always measured by the works of the employees in that organization. For that reason, organization always look for those employees who have the best knowledge and skills required in the job, and the organization benefits from their ideas and suggestion to grow. Recruitment and selection are the first and the essential step to achieve that goal for organization.
Gopinath (2014) states that recruitment and selection process are important practices for human resource management and are crucial in affecting organizational success. He mentions that the quality of new recruits depends upon an organization's recruitment practices. Recruitment and selection is a major HRM function as it encompasses all organizational practices and decisions. Recent technological advances, globalization, social trends and changes within organizations have brought new challenges for recruitment and selection. On the other hand, Ray (2011) finds that recruitment and selection have very negligible impact on job satisfaction.
Nowadays, recruitment process becomes more important for the organization since it also helps in saving time and money for the organization. For example, organizations are investing a lot of time and money in recruiting employees and in training them. If only a few months later they quit, this will negatively affect the organization. Hence, a good recruitment process can reduce the turnover rate provided that the recruitment committee select the right people who have no intention to leave soon. Hence, hiring the best employees can be a competitive advantage for an organization whereas ineffective recruitment and selection reduces productivity and increases cost.
From the employees’ perspective, a good recruitment policy will involve fairness and merit. If the employees sense inequality or nepotism in the recruitment process, their motivation and job satisfaction levels may decrease. Therefore, this dimension can relate to job satisfaction level of the employees, which we will measure in our research.
2.4.2 Training and Development
Forgacs (2009) defines training as a planned activity aimed at improving employees’ performance by helping them to realize an obligatory level of understanding or skill through the impartation of information. Armstrong (2000) also defines training as an organized process to amend employee proficiencies so that they can achieve its objectives.
Training fundamentally enables employees’ learning, confidence, motivation and commitment which eventually enhance their skills and abilities to execute skills in better way (Mullins, 2005). According to Mullins (2005, p.756), “Training is an important area of HRM, having relevance to effective management”.
Training and development process are always aimed to enhance and develop employees’ skills and knowledge which can be resulting in increasing productivity and achieving goals. Studies have shown that specific training of employees can have a greater impact on wages and productivity (Barrett, 1998).
Training and development have a cost attached to it. However, since it is beneficial for companies in the long run, they ensure employees are trained regularly. There are some advantages of training since it helps employees develop new skills and increase their knowledge as well as improving efficiency and productivity of the individuals. Since training provides employees with good knowledge and skills, it might also create risk for the company and increase the turnover rate.
However, receiving good training is a positive aspect for employees since they will fell more empowered and will be able to complete their work more efficiently. Hence, training possibilities in an organization is supposed to improve employee motivation and job satisfaction levels. We include this aspect in our research to see if there is really a strong connection between job satisfaction and proper employee training levels.
Training is pivotal for upgrading the knowledge, skill development that will bring about changes in behavior and attitude of individual and this goes to improve the ability of the trainee's performance at work which leads to job satisfaction (Deshwal, 2015). In the light of these discussions, training is added as an independent variable in this study that could affect job satisfaction.
2.4.3 Performance Appraisal (Pa)
Performance appraisal is one of HRM practices which is used to evaluate employees in the organization. Performance appraisal has been considered as an indispensable tool for an organization, as the information and outcomes it provides is highly useful in making decisions regarding various personnel aspects such as promotion criteria and salary increases (Muczyk and Gable, 1987).
Researchers have studied performance appraisal and employee outcomes (Vignaswaran, 2005; Kuvaas, 2006; 2007). Bekele and Shigutu (2014) found that the perception of employees regarding
performance appraisal is positively related to organizational commitment and work performance, while negatively related to employees’ turnover intentions.
A robust performance appraisal clarifies expectations and improves the accuracy and objectivity of performance evaluation. However, performance appraisals have been found to be a major source of discrimination in managing diversity and equity in workplaces, especially due to raters’ influence on the actual process (Sharma, 2016). Hence, employee satisfaction could also be related to how employees recognize the objectivity of evaluations, and therefore we include this dimension in our research, too.
2.4.4 Compensation
Compensation is the money paid for the employees for work. The productivity and efforts of employees are always increased when they receive enough remuneration. It has been revealed in the past researches that rewards are very strongly correlated with job satisfaction. Rewards are positively linked to employee job satisfaction (Gerald & Dorothee, 2004). Their research extracts another important element stating that employees are more satisfied with those rewards that they perceive as they deserved.
Compensation has a motivational effect and therefore implies that having a compensation structure in which the employees who perform better are paid more than the average-performing employees is vital to enhancing organizational performance (Hewitt, 2009).
Satisfaction with pay is higher where performance‐related pay and seniority‐based reward systems are in place. A pay structure that is perceived to be unequal is associated with a substantial reduction in both non‐union members' overall job satisfaction and their satisfaction with pay. Although HRM practices can raise workers' job satisfaction, if workplace pay inequality widens therefore then non‐ union members may experience reduced job satisfaction (Petrescu and Simmons, 2008).
Compensation plays an important role in recruitment and retention of talented people (Mondy and Mondy, 2014; Noe et al., 2010). We will also include this dimension in our research to see if there is a strong connection between job satisfaction and the rate at which the employees are satisfied
with their compensation; so that we can possibly comment on how compensation affects job performance and contribution level of employees to business success.
2.4.5 Job Security
In world full of changes, it becomes difficult for the employees to retain in job for long time. From time to time, organization are looking for those employees who are skilled and aim to hire these kinds of people. For that reason, some unskilled people could lose their jobs.
There are many reasons that make employees feel unsafe in the workplace. One of them could be the financial problems that face the organization, and another is related to the employee’s skills which may not be regarded as enough to meet the demands of organization goals.
In a study of the financial performance of 192 banks, Delery and Doty (1996) observe a significant relationship between job security and the banks’ return on assets, an important measure of financial performance. Employment security maintained over time helps to build trust between people and their employer, which can lead to higher productivity and success rates of the employees.
2.4.6 Job design
Job design is the functions of arranging task, duties and responsibilities in to an organizational unit of work. The process of job design has been defined as the specification of the contents, methods, and relationships of jobs in order to satisfy technological and organizational requirements (Buchanan, 1979).
With challenging and changing in technology and business environment, it becomes essential to build and define new structures for the jobs in order to meet job requirements. Garg and Rastogi (2006) have mentioned that job rotation and job enlargement can be used to allow employees to work in different departments and help in increasing motivation by giving employees different tasks.
The clear description of job design can clarify the tasks need to be performed by the employees and that will eventually lead to positive productivity and job satisfaction.
2.4.7 Promotion
Promotions refer to the individuals’ progression into new positions with greater challenges, higher work responsibility and authority than their previous job positions (Dessler, 1999). The growth opportunity within the organization affects the employee’s performance and productivity since they feel that they have chance to reach better position within the organization.
For most employees, promotion is one of the essential factors that persuade them to stay satisfied in the organization. With a promotion the employee typically receives a pay increase and moves to a lower relative position in a new pay grade, thereby having the opportunity to earn larger and perhaps more frequent within-grade increases (Milkovich & Newman, 1993). Pergamit and Veum (1989) find a positive correlation between promotions and job satisfaction. However, their empirical model only controls for promotions and the type of job change.
Nowadays, organization use promotion as motivation and rewards for the employees in order to make the satisfied and remain in the organization. Hence, measuring the connection between job satisfaction levels and the promotion opportunities could help us understand the merit of this policy in organizations.
2.4.8 Work Environment
Work environment refers to the conditions in the workplace that surrounds the employees and it can be considered as one of the factors that affect job satisfaction. The employees need to use modern equipment and facilities in addition to adequate space with the necessary air conditioning and ventilation, lightening in order to be more content in the workplace (Abel, 2012).
In the present time, it becomes crucial for all organization to have conducive work environment in order to motivate and satisfy their employees. The working conditions are conducive when organization provides their employees a safe and healthy environment. According to Mondy and Noe (2005), safety is protecting employees from injuries caused by work related accidents, and health is keeping employees free from physical or emotional illness.
Spector (1997) observed that most businesses ignore the working environment within their organization resulting in an adverse effect on the performance of their employees. According to him, working environment consists of safety to employees, job security, good relations with co-workers, recognition for good performance. Hence, not only the physical conditions of the workplace, but also the interpersonal relationships among the employees can define the working environment.
Different factors within the working environment such as wages, working hours, autonomy given to employees, organizational structure and communication between employees and management may affect job satisfaction (Lane et al., 2010). Therefore, we also involve this dimension in our research in order to understand how strong the connection of work environment is with the job satisfaction level.
2.4.9 Recognition and appreciation
A fair pay system is not always the core point that make employees satisfied. Employees also require their efforts to be appreciated and valued in order to be satisfied at work.
Recognition refers to the process of valuing the employees at work. Armstrong (2006) indicates that job satisfaction can also be increased by acknowledging a job well done. Positive and constructive feedback boosts performance. When the employees meet negative feedback from top management, they tend to leave the organization, increasing turnover rate and costing the company.
Lawler (2003) also states that recognition play an imperative role in motivating employees and improving performance. According to Harrison (2011), recognition is the timely, informal or formal acknowledgement of a person’s or team’s behavior, effort or business result that supports the organization’s goals and values, and which usually is beyond normal expectations. Hence, we finally include this dimension of the HRM practices to see how the recognition impacts the job satisfaction level of employees.
CHAPTER 3:
RESEARCH METHODOLOGY
3.1 INTRODUCTION
In this section outline of the research methodology will be presented. As stated earlier, the objective of this research is to examine the relationships between HRM practices and their connection to job satisfaction. The dependent variable is the job satisfaction and the independent variables are recruitment and selection, training and development, compensation, promotion, job security, job design, work environment, recognition and performance appraisal. Questionnaire were distributed to the employees of Alkuraimi bank and responses were received from 71 employees. Data collected has been analyzed to meet the target of the project research.
3.2 RESEARCH DESIGN
A research design is a function that enable us to answer the research question as clearly as possible, and performed by build meaningful structure for the project (Kirshenblatt, 2006) In this research we use explanatory research design since we are looking for correlation between variables of HRM practices and how they affect job satisfaction.
Explanatory research is also called causal research and it is conducted to identify the extent and nature of cause-and-effect relationships. Causal studies focus on an analysis of a situation or a specific problem to explain the patterns of relationships between variables (Zikmund, 2009).
In a causal study, researchers manipulate the set of independent variables to determine their effect, if any, on dependent variables. Researchers in causal studies also typically make use of a “control” -- a case in which the independent variables have not been manipulated, to allow researchers to compare the effects of manipulating the independent variables to the effects of leaving them the same. A descriptive study does not typically involve variable manipulation or a control (Jeffery, 2018). Since we do not have control over the independent variables, our research is more of descriptive nature.
Survey is the research strategy used in order to collect quantitative data. A questionnaire is designed and distributed to Alkuraimi bank employees and analyzed using SPSS. The results were analyzed by using several statistical methods, which will be explained in the later sections.
3.3 DATA COLLECTION METHODS
For any research, data is the core and it is crucial thing for researcher who need to address problem and conduct research. Without accurate data, results will be dismissed and non- functional. In this research, the data that is used is primary data.
Primary data is the data collected by the researcher for the first time. It is also called as the raw data. In our research, primary data is obtained through questionnaire technique, which is directed to lower level employees of the bank and managers at the head offices. An advantage of using primary data is that researchers are collecting information for the specific purposes of their study. The questions the researchers ask are tailored to elicit the data that will help them with their study. In this work, we used the same approach, tailoring the questionnaire specific to our research objectives and questions.
Target population is the total group of individuals from which the sample might be drawn. It would be timely and costly for us to target the all employees of the banks in Yemen, hence we have focused in ALKURAIMI bank employees which is considered as one of the best and largest banks in Yemen. Questionnaire has been created online using Google survey and distributed to more than 200 employees but only we got response from 91 of them.
Sampling is a process of selecting individuals from a larger group of people in order to draw assumptions of accurate representation of how the larger group of people act or what they truly believe (Fraenkel and Wallen, 2006). A sampling frame is a comprehensive list of all cases in the target population from which a sample can be drawn (Saunders et al., 2009).
There two types of sampling which are probability sampling and non-probability sampling. The former is used in generalizing the findings and not limited to a particular group of people. The non-probability sampling on the other hand focuses in a more specific area. It aims to target people from
probability sampling method is taken in order to select enough people to represent the entire workforce of the bank.
3.4 DATA COLLECTION INSTRUMENTS
Data collection instruments are essential to conducting scientific research. It allows us to collect information that we want. Some tools used to collect data are documents review, observation, questioning, measuring, or a combination of different methods (Abawi, 2014). In this work, we use questionnaires as our data collection instrument.
3.4.1 Questionnaire Design
Questionnaires are mostly employed in descriptive and explanatory research, but their use is probably inappropriate when the nature of research is exploratory, which requires numerous open-ended questions (Saunders et al., 2009). Frazer and Lawley (2000) mention that a questionnaire survey is the most suitable data collection method in the field of business and social sciences.
For the purpose of research, we designed a questionnaire with two sections. Section A consists of questions related to job satisfaction and HRM practices and section B is about demographic background. The set of questionnaires in section A consists of 51 questions whereas there are 5 questions in section B. Section A involves 10 sets of questions corresponding to questions related to job satisfaction, recruitment and selection, compensation, training and development, performance appraisal, work environment, job design, promotion, job security, and recognition and appreciation respectively. Section B includes questions related to gender, age, qualification and work experience and position in the bank. The questions were adapted from Qunash and Raheel (2013). In this research we used Likert scale ranging from 1 to 5 (1- strongly agree to 5 – strongly disagree). The questionnaire is added to Appendix.
3.5 DATA ANALYSIS TECHNIQUES
Data analysis is process of converting data into comprehensive context. It is essential to make useful information from the data since otherwise the data comprised of numbers and figures will not be of value for developing managerial insights. There are many analysis techniques which are used in
analysis software to interpret the data, but it is more essential for researcher to choose the method that can be suitable to the data at hand and will be compatible with the research objectives.
In this research, primary data has been collected by using the questionnaire method and analyzed using Statistical Package for Social Science (SPSS). Descriptive statistics and frequency, correlation analyzes, and regression analysis used to analyze data. In descriptive statistics, mean and standard deviation were computed as variables of interest. In addition, in correlation analysis, the relationship between two variables was measured in order to find whether they are correlated or not. Finally, multiple linear regression is used to identify which of the independent variables have the most major effect on the dependent variable, namely job satisfaction. Below, more detailed information is given about each one of these steps.
3.5.1 Descriptive Analysis
Descriptive analysis of data limits generalization to a particular group of individuals observed. No conclusions extend beyond this group and any similarity to those outside the group cannot be assumed (Best & Kahn, 2003). Descriptive analysis provides simple summaries about the sample and the measures. Together with simple graphical analysis, they form the basic virtual of any quantitative analysis of data. In this research data is collected and by the aid of Statistical Package for the Social Sciences (SPSS) we analyze the mean, mode and standard deviation, and develop graphics regarding the clusters in the data.
3.5.2 Reliability Test
Reliability refers to how dependably or consistently a test measures a characteristic. Reliability is one of the most important elements of test quality. In reliability test, the results for two actions need to be same. If one action differs from the other, it means that test is poor and unreliable. Types of test reliability are test-retest reliability, parallel forms reliability, decision consistency, internal consistency, and interrater reliability. In this research, a type of internal consistency test will be performed to examine the reliability of variables. The reliability of the scale is measured using the Cronbach’s alpha.
3.5.3 Inferential Analysis
Unlike descriptive statistics, inferential statistics provide conclusion for the data obtained from the survey. These statistics answer questions about population that has not been tested.
Inferential statistics is a process of inference the differences between groups that we see in our data and help us to decide whether are strong enough to provide support for our hypothesis that group or not. In our research we apply Pearson’s correlation coefficient analysis and multiple regression analysis. Pearson’s correlation coefficient analysis is used to measure the strength of a linear association between two variables. It focuses on how the data points are far from the line. In Pearson’s analysis the range from +1 to -1 is concerned, the value greater than 0 indicates positive association and the value less than 0 indicate negative association. The closer the value is to -1 or 1, the stronger is the relationship between the measured variables.
Regression analysis is a reliable method of identifying which variables have an impact on a topic of interest. The two factors that are under consideration are dependent variable which we try understand or predict, and the independent variable which is supposed to have an impact on the dependent variable. Here, with multiple regression analysis, we hope to understand whether each one of the HRM dimensions has an impact on the job satisfaction level.
CHAPTER 4:
ANALYSIS RESULTS
4.1 INTRODUCTION
In this chapter, collected data of the research has been analyzed with the aid of SPSS and the results were summarized. Several analyses have been used to evaluate data such as reliability analysis, descriptive analysis, regression analysis and correlation analysis. Around 91 of respondents answer the questionnaire, hence, 91 set of questionnaires has been analyzed using several analysis techniques to clarify the results.
4.2 RELIABILITY ANALYSIS
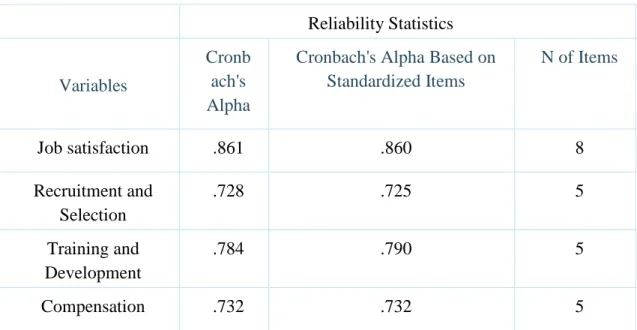
Since we developed an original questionnaire by adapting from various previous research papers, the reliability of the questionnaire questions needs to be measured. To do this, the reliability of the scale was measured using the Cronbach’s alpha. With the aid of SPSS, we compute Cronbach alpha for each set of questions to measure reliability of questionnaire. The results were presented in the Table below.
Table 4. 1 Reliability Statistics of HRM Practices and Job Satisfaction
Reliability Statistics
Variables
Cronb ach's Alpha
Cronbach's Alpha Based on Standardized Items N of Items Job satisfaction .861 .860 8 Recruitment and Selection .728 .725 5 Training and Development .784 .790 5 Compensation .732 .732 5
Performance Appraisal .807 .808 5 Work Environment .597 .618 5 Job Design .798 .799 4 Promotion .758 .759 5 Job Security .742 .746 4 Recognition and Appreciation .785 .789 5
Table 4.1 represents the reliability statistics of job satisfaction and HRM practices questionnaire. A Cronbach’s Alpha value of above 0.7 is considered as sufficient and acceptable in general. The Table shows that all of the dimensions measured in the questionnaire are reliable and consistent since the alpha values are more than 0.7. Only the work environment variable shows an alpha value of .597 which means not such reliable and consistent data. However, setting an acceptable alpha value of 0.6, this might be considered acceptable and we choose to proceed in that dimension.
4.3 DESCRIPTIVE ANALYSIS
Next, we move to analyze data from a descriptive analysis dimension by providing simple summaries and graphs about the sample and the measures. We proceed by analyzing each dimension of the questionnaire one by one. Each of the following tables summarizes the minimum, maximum, mean and standard deviation values of the questions in the 10 parts of the questionnaire.
4.3.1 Descriptive Statistics Of Job Satisfaction
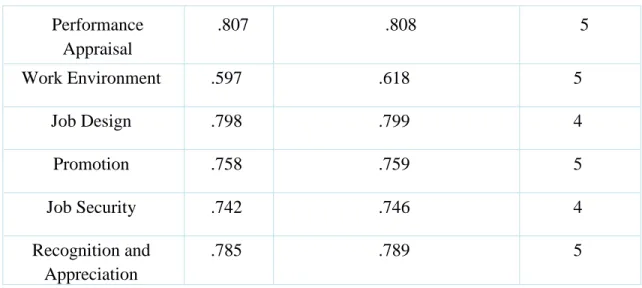
Table 4. 2 Descriptive statistics of job satisfaction
N Mini mum Maxi mum Mean Std. Deviation I am satisfied with recruitment process in the bank 91 1.00 5.00 3.549 5 .90999
I am satisfied with the job I do, and my work
is recognized
91 1.00 5.00 3.461
5
1.17670
I am satisfied with the pay system applied in
the bank
91 1.00 5.00 3.022
0
1.23808
I am satisfied with the promotion practice applied in the bank
91 1.00 5.00 2.890
1
1.21519
I am satisfied with the training program in the
bank 91 1.00 5.00 3.263 7 1.15311 I am satisfied with working environment in the bank 91 1.00 5.00 3.439 6 .92146
I am satisfied with job security applied in the bank
90 1.00 5.00 2.733
3
1.27904
I feel that if one has my job, he will not want to leave
91 1.00 5.00 3.120
9
1.20955
Valid N (listwise) 90 Aver
age
3.18 507
1.13789
Source: Researcher field survey
The table 4.2 clarifies that the highest mean is 3.54 and the lowest is 2.73 and the average is 3.18 for the 8 items which represent how much employees are satisfied about their jobs in Alkurimi bank.
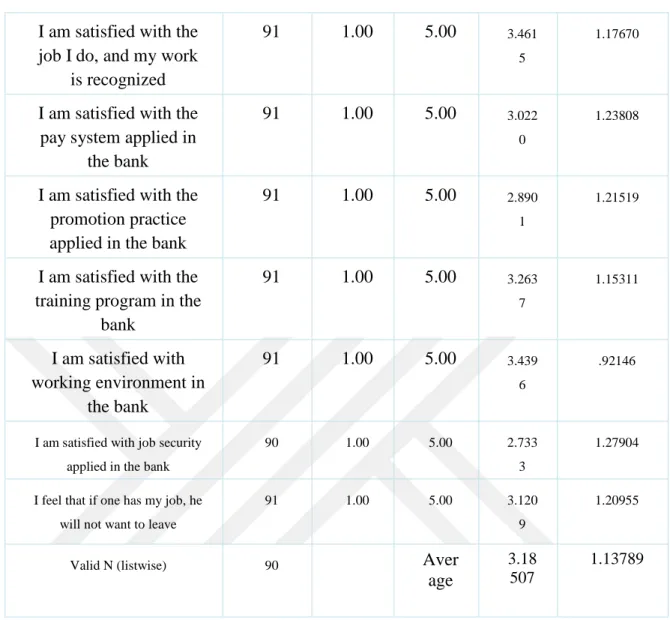
Table 4. 3 Descriptive Statistics of Recruitment and Selection
Descriptive Statistics N Mini mum Maxi mum Mea n Std. Deviatio n Usually jobs are
advertised on bank website and other
media to recruit people
91 1.00 5.00 3.74 73
Bank is committed to the procedures and policies of selection process 91 1.00 5.00 3.43 96 1.02425 Standardized tests are used to select suitable employees 91 1.00 5.00 3.48 35 1.12904 Employees are selected based on
their skills and knowledge
91 1.00 5.00 3.31 87
1.04221
Duties of jobs are clearly defined by HR department
91 1.00 5.00 3.42 86
.93265
Valid N (listwise) 91 Aver
age
3.48 354
1.03346 2
Source: Researcher field survey
The table 4.3clarifies that the highest mean is 3.74 and the lowest is 3.31 and the average is 3.48 for 5 items which represent how much employees are satisfied about and agree with recruitment process in Alkurimi bank.
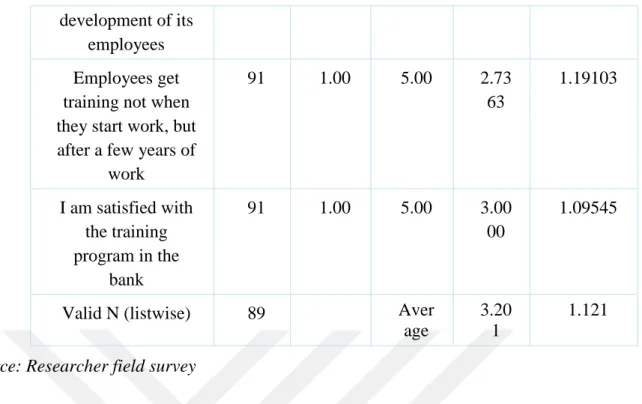
Table 4. 4 Descriptive Statistics of Training and Development
N Mini mum Maxi mum Mea n Std. Deviatio n Employees are always provided with an extensive training program 90 1.00 5.00 3.07 78 1.06241 Training programs are beneficial and help employees to learn and improve
their skills 91 1.00 5.00 3.82 42 1.12144 Bank is investing a lot in the 90 1.00 5.00 3.36 67 1.13623
development of its employees Employees get training not when they start work, but after a few years of
work 91 1.00 5.00 2.73 63 1.19103 I am satisfied with the training program in the bank 91 1.00 5.00 3.00 00 1.09545
Valid N (listwise) 89 Aver
age
3.20 1
1.121 Source: Researcher field survey
The table 4.4 clarifies that the highest mean is 3.82 and the lowest is 2.7 and the average is 3.21 for 5 items which represent how much employees are more satisfied with Training and development in Alkurimi bank.
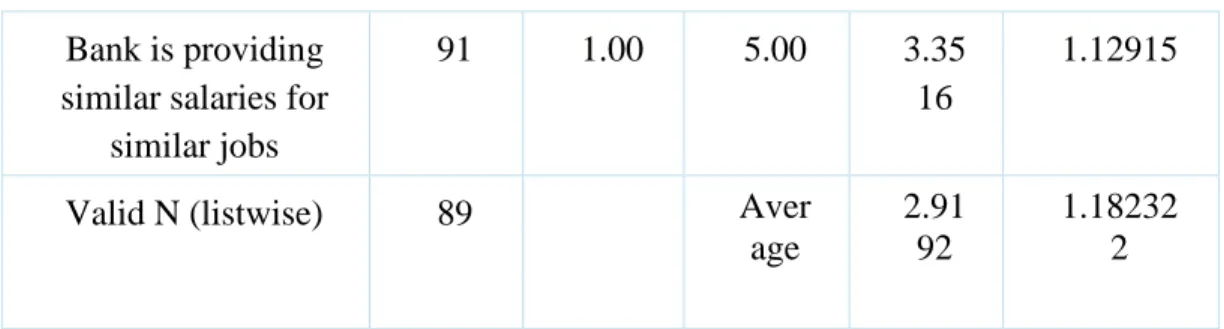
Table 4. 5 Descriptive Statistics of Compensation
N Mini mum Maxi mum Mea n Std. Deviatio n Compared with others, I feel my salary is fair 91 1.00 5.00 2.96 70 1.18744 Normally, pay is linked to the performance appraisal 91 1.00 5.00 2.74 73 1.09131 I am satisfied with my annual raise 90 1.00 5.00 2.82 22 1.27709 Health care package is provided by the bank 89 1.00 5.00 2.70 79 1.22662
Bank is providing similar salaries for
similar jobs
91 1.00 5.00 3.35
16
1.12915
Valid N (listwise) 89 Aver
age
2.91 92
1.18232 2
Source: Researcher field survey
The table 4.5 clarifies that the highest mean is 3.35 and the lowest is 2.7 and the average is 2.9 for the 5 items which represent how much the employees are satisfied and agree with the compensation in Alkurimi bank.
Table 4. 6 Descriptive Statistics of Performance Appraisal
N Mini mum Maxi mum Mea n Std. Deviatio n I am informed about how my
performance will be evaluated 91 1.00 5.00 3.01 10 1.18785 Performance appraisal feedbacks are discussed with
employees
91 1.00 5.00 3.37
36
1.00718
Performance appraisal helps me to learn and grow
90 1.00 5.00 3.54
44
1.09299
Bank management takes performance appraisal into consideration for promoting
decisions
90 1.00 5.00 3.05
56
1.15497
Salaries are raised based on performance appraisal
91 1.00 5.00 2.79
12
1.16920
Valid N (listwise) 89 Aver age
3.15 516
1.12243 8
The table 4.6 clarifies that the highest mean is 3.54 and the lowest is 2.79 and the average is 3.16 for the 5 items which represent how much the employees are satisfied and agree with the performance appraisal in Alkurimi bank.
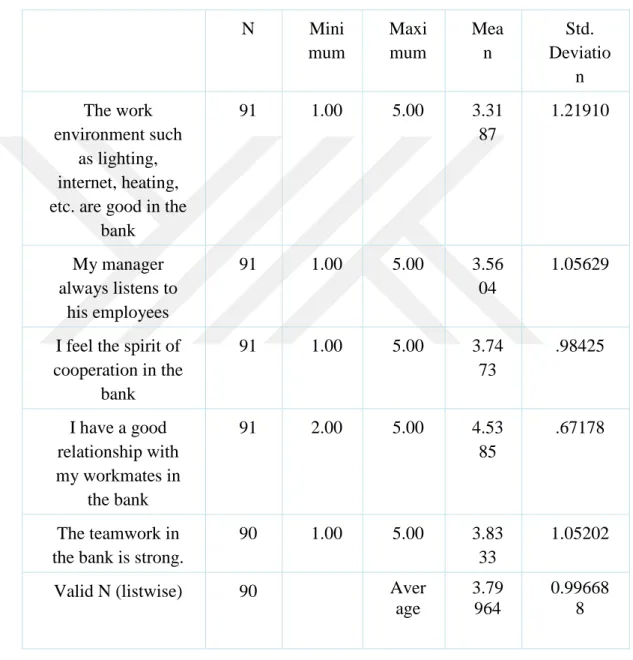
Table 4. 7 Descriptive Statistics of Working Environment
N Mini mum Maxi mum Mea n Std. Deviatio n The work environment such as lighting, internet, heating, etc. are good in the
bank 91 1.00 5.00 3.31 87 1.21910 My manager always listens to his employees 91 1.00 5.00 3.56 04 1.05629
I feel the spirit of cooperation in the bank 91 1.00 5.00 3.74 73 .98425 I have a good relationship with my workmates in the bank 91 2.00 5.00 4.53 85 .67178 The teamwork in the bank is strong.
90 1.00 5.00 3.83
33
1.05202
Valid N (listwise) 90 Aver
age
3.79 964
0.99668 8
Source: Researcher field survey
The table 4.7 shows that the highest mean is 4.53 and the lowest is 3.31 and the average is 3.80 for the 5 items which represent how much the employees are satisfied with the working environment in Alkurimi bank.
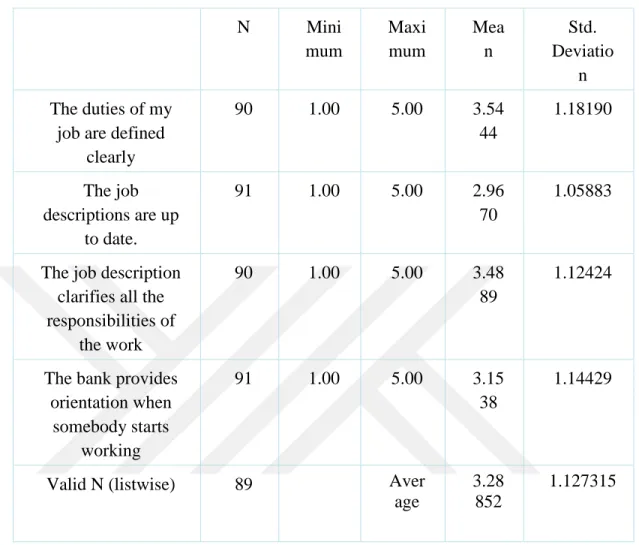
Table 4. 8 Descriptive Statistics of Job Design N Mini mum Maxi mum Mea n Std. Deviatio n The duties of my
job are defined clearly 90 1.00 5.00 3.54 44 1.18190 The job descriptions are up to date. 91 1.00 5.00 2.96 70 1.05883
The job description clarifies all the responsibilities of
the work
90 1.00 5.00 3.48
89
1.12424
The bank provides orientation when somebody starts working 91 1.00 5.00 3.15 38 1.14429
Valid N (listwise) 89 Aver
age
3.28 852
1.127315
Source: Researcher field survey
The table 4.8 shows that the highest mean is 3.54 and the lowest is 2.96 and the average is 3.29 for the 4 items which represent how much the employees are satisfied with the job design in Alkurimi bank.
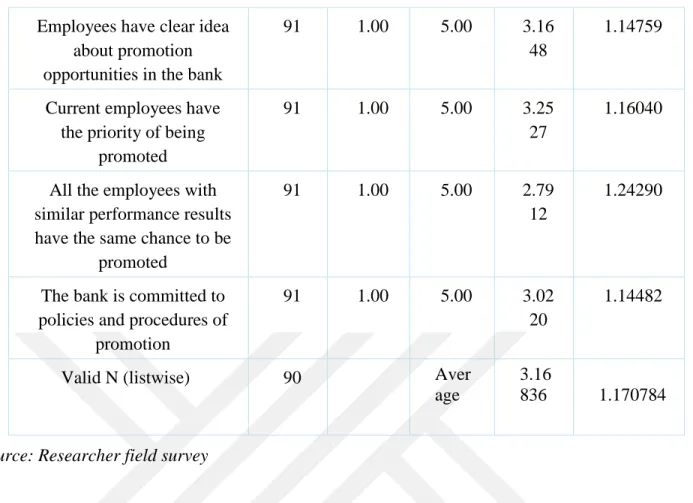
Table 4. 9 Descriptive Statistics of Promotion
N Mini mum Maxi mum Mea n Std. Deviatio n I have a good chance to be
promoted in the bank
90 1.00 5.00 3.61
11
Employees have clear idea about promotion opportunities in the bank
91 1.00 5.00 3.16
48
1.14759
Current employees have the priority of being
promoted
91 1.00 5.00 3.25
27
1.16040
All the employees with similar performance results have the same chance to be
promoted
91 1.00 5.00 2.79
12
1.24290
The bank is committed to policies and procedures of
promotion
91 1.00 5.00 3.02
20
1.14482
Valid N (listwise) 90 Aver
age
3.16 836
1.170784
Source: Researcher field survey
The table 4.9 shows that the highest mean is 3.61 and the lowest is 2.79 and the average is 3.17 for the 5 items which represent how much the employees are satisfied with the promotion practices in Alkurimi bank.
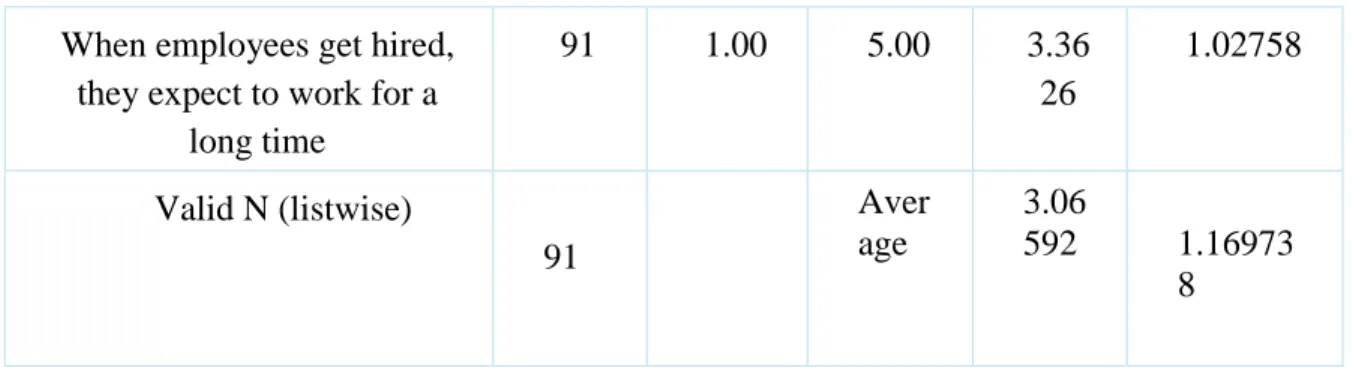
Table 4. 9 Descriptive Statistics of Job Security
N Mini mum Maxi mum Mea n Std. Deviatio n Bank management
appreciate their workers
91 1.00 5.00 3.01
10
1.16899
If the bank faces financial problems, employees will
be the last to get their payments cut
91 1.00 5.00 2.96
70
1.26008
I feel my job is secure in this bank
91 1.00 5.00 2.92
31
When employees get hired, they expect to work for a
long time 91 1.00 5.00 3.36 26 1.02758 Valid N (listwise) 91 Aver age 3.06 592 1.16973 8
Source: Researcher field survey
The table 4.10 shows that the highest mean is 3.36 and the lowest is 2.92 and the average is 3.06 for the 4 items which represent how much the employees agree with several dimensions of the job security in Alkurimi bank.
Table 4. 10 Descriptive Statistics of Recognition and Appreciation
N Minim um Maxim um Mean Std. Deviation I always get appreciated when
doing my work well
91 1.00 5.00 3.0659 1.17191
Bank helps its employees balancetheir work time and
family time.
89 1.00 5.00 2.4719 1.00102
Working hoursis convenient to meet the demands of one’s
personal life
91 1.00 5.00 2.5714 1.17514
Usually, employees can participate in decision making
91 1.00 5.00 2.8022 1.06687
Employees’ suggestions are always taken under
consideration
91 1.00 5.00 2.9670 1.18744
Valid N (listwise) 89 Averag
e
2.7756 8
1.120476
The table 4.11 shows that the highest mean is 3.06 and the lowest is 2.47 and the average is 2.78 for the 5 items which represent how much the employees are satisfied with recognition and appreciation in Alkurimi bank.
Finally, we present a summary of the above results in a single Table as follows. Table 4. 11 Descriptive analysis of HRM practices
Variable Average Mean Average standard dev
Job satisfaction 3.18 1.13
Recruitment and selection 3.48 1.03
Training and development 3.201 1.121
Compensation 2.91 1.18 Work environment 3.799 0.996 Job design 3.28 1.12 Promotion 3.16 1.17 Job security 3.06 1.16 Recognition and appreciation 2.77 1.12
Based on Table 4.12 the highest mean is 3.799 which means that employees are mostly satisfied with the work environment, while the lowest mean is obtained as 2.77 for recognition and appreciation which means that employees are least satisfied about this dimension in the bank. In addition, the highest standard deviation is for compensation, promotion and job security; which may be an indication that the satisfaction levels of employees in these dimensions are highly volatile, meaning there are both very satisfied and not-so-satisfied employees present. Next, we would like to present the descriptive statistics of demography for the respondents of the survey. The data is collected from the employees of Alkuraimi bank, which is one of the widely spread banks in Yemen serving thousands of people and with a diversified workforce coming from
different educational backgrounds and ages. We present the demographic statistics of the respondents by the following graphs and tables.
Table 4. 12 Gender Analysis
Frequen cy Perce nt Valid Percent Cumulative Percent Va lid MAL E 90 98.9 98.9 98.9 FEM ALE 1 1.1 1.1 100.0 Total 91 100.0 100.0
Based on the table 4.13 above, it shows that majority of respondents were male with the percentage of 98.9%. and only 1.1 female. The survey respondents are representative of the bank employees; hence this picture shows that the bank is dominated by the male gender. This is mainly because the recruitment policy of Alkurimi bank was based on refusing recruiting female before. They started recruiting females for specific branches only a few years ago.
Table 4. 13 Age analysis
Freque ncy Perce nt Valid Percent Cumulativ e Percent V ali d From 18-40 87 95.6 95.6 95.6 up 41 4 4.4 4.4 100.0 Total 91 100.0 100.0
Table 4.14 represents the ages of employees in Alkurimi bank. It shows that majority of them are young between 18 and 40 years with the percentage of 95.6% and only 4.4% of them are above 40. That means that Alkuriami bank is depending on young people to run the organization with a hope that this policy affects the productivity and efficiency positively.
Table 4. 14 Education analysis Frequ ency Perc ent Valid Percent Cumulati ve Percent Val id secondary school 30 33.0 33.3 33.3 bachelor and master 60 65.9 66.7 100.0 Total 90 98.9 100.0 Mis sin g System 1 1.1 Total 91 100. 0
According to the table 4.15, the majority of employees have bachelor’s degree or master’s degree with the percentage of 66.7%. This is an indication that the bank is depending on the employees who have high level of education. The employees who have secondary school graduation or diploma are around 33.3%.
Table 4. 15 position analysis
Freque ncy Perce nt Valid Percent Cumulativ e Percent V ali d employ ees 39 42.9 42.9 42.9 manage rs 52 57.1 57.1 100.0 Total 91 100.0 100.0
Based on the table 4.16, majority of respondents for the survey come from managerial position with the percentage of 57.1% which means that managers are concerned about the research that aims to clarify the impact of HRM practice on job satisfaction. The percentage of employees in the survey,
which is only 42.9, reflects that employees are not preferring to share their opinion which is a negative point.
Table 4. 16 length service analysis
Freque ncy Perc ent Valid Percent Cumulati ve Percent V al id under 5 years 49 53.8 53.8 53.8 up 5 years 42 46.2 46.2 100.0 Total 91 100. 0 100.0
Table 4.17 shows that there is a little difference in percentage between the employees who work less than 5 years and those who work for more than 5 years. The table also shows that around 46.2% of the respondents are working in Alkuriami bank for more than 5 years which is a signal that job security in Alkuraimi bank is high. Next, we will analyze average scores on each HRM dimension for different groups of age, education level, position and length of service.
Table 4. 17 descriptive analysis for HRM practices based on age
Based on Table 4.18, job satisfaction is high on the employees between 31-40 with the average of 3.30 and standard deviation of 0.85. Moreover, the table shows the employees between 18-30 are the least satisfied category in the group with average of 3.05 and standard deviation of 0.70. Among the other variables, one of the biggest discrepancies is observed in compensation. The age group 41-50 are satisfied (with an average of 3.30) while the other two groups can be regarded as dissatisfied with their compensation packages. Moreover, age group 18-30 are dissatisfied with the
Age 18-30 31-40 41-50
Variable Average Standard deviation Average Standard deviation Average Standard deviation Job satisfaction 3.05 0.70 3.30 0.85 3.22 0.99 Recruitment and selection 3.48 0.72 3.51 0.64 3.30 1.25 Training and development 3.22 0.73 3.18 0.83 3.30 1.32 Compensation 2.86 0.78 2.94 0.80 3.30 1.14 Performance appraisal 3.14 0.87 3.18 0.81 3.10 0.94 Work environment 3.75 0.54 3.84 0.68 3.75 0.75 Job design 3.25 0.76 3.31 0.90 3.44 1.46 Promotion 3.21 0.81 3.14 0.89 3.00 0.62 Job security 2.94 0.86 3.18 0.86 3.06 1.04 Recognition and appreciation 2.67 0.71 2.84 0.86 3.10 1.06
the rest of the variables, the group averages are very similar. According to the above Table, all age groups seem to be most satisfied about the work environment while their satisfaction is the lowest for compensation and recognition and appreciation dimensions. Finally, despite the fact that the average satisfaction levels of the oldest age group (41-50) are generally the highest for all dimensions, the largest standard deviations are observed in this group too, suggesting a non-homogeneous group of employees
Table 4. 18 Descriptive analysis for demography based on Education
Education Secondary Diploma Bachelor Master
Variable Averag e Standar d deviatio n Averag e Standar d deviatio n Averag e Standar d deviatio n Averag e Standar d deviatio n Job satisfaction 2.82 0.95 3.11 0.95 3.29 0.70 2.56 0.18 Recruitment and selection 3.16 0.76 3.5 0.82 3.50 0.65 3.20 0.4 Training and development 2.64 1.22 2.94 1.05 3.37 0.55 3.40 0 Compensatio n 2.42 0.93 2.93 0.78 2.99 0.78 3.00 0.6 Performance appraisal 2.69 1.04 3.11 0.79 3.24 0.81 3.30 0.5 Work environment 3.29 0.61 3.78 0.77 3.90 0.53 3.20 0 Job design 2.92 1.17 3.24 1.05 3.38 0.73 2.75 0
Table 4.19 displays that employees who have bachelor’s degree seem more satisfied (with an average of 3.29 and standard deviation of 0.70) than those who have other education levels. The study emphasizes that employees who have master’s degree are the least satisfied among the all groups of employees with the average of 2.56 and standard deviation of 0.18. Standard deviation values in the secondary school graduates and diploma graduates are higher, while the master graduates seem to be a more homogeneous group. Among the several HRM dimensions, all groups are more or less satisfied with the work environment and recruitment and selection. Moreover, compensation and recognition are the two practices which less satisfied by majority of employees and that need to be under consideration.
Table 4. 19 Descriptive analysis for demography based on position
Education Financing and risk officer
Customer services and cashiers
Branch managers Administrative manager
Variable Average Standard deviation Average Standard deviation Average Standard deviation Average Standard deviation Job satisfaction 2.95 0.72 2.96 0.85 3.44 0.72 3.14 0.79 Recruitment and selection 3.09 0.72 3.27 0.79 3.71 0.52 3.68 0.69 Training and development 3.16 0.77 2.93 1.02 3.38 0.66 3.25 0.64 Compensation 2.96 0.84 2.90 0.75 3.02 0.65 2.61 1.16 Promotion 2.96 0.81 3.11 0.76 3.20 0.89 2.80 0.2 Job security 2.83 0.72 3.12 1.03 3.10 0.84 2.50 0 Recognition and appreciation 2.38 0.97 2.89 0.87 2.81 0.76 2.40 0.2
Performance appraisal 3.00 0.84 2.97 0.88 3.42 0.64 2.92 1.03 Work environment 3.55 0.52 3.70 0.63 3.94 0.59 3.85 0.72 Job design 3.00 1.10 3.29 0.73 3.45 0.75 3.11 1.04 Promotion 2.79 0.68 2.86 0.83 3.52 0.68 3.12 1.03 Job security 2.70 0.73 2.86 0.99 3.24 0.71 3.38 0.97 Recognition and appreciation 2.61 0.69 2.49 0.94 2.98 0.61 2.93 0.98
According to Table 4.20, branch managers are the most satisfied employee group with the average of 3.44 and standard deviation of 0.72 and the least satisfied employees are financing and risk officers with average of 2.95 and standard deviation of 0.72. In general, the study shows that branch managers are more satisfied about most of the HRM practices, however, the employees who work as finance officer and risk officer or either cashiers and customer services are generally not satisfied with the HRM practices in the bank. Employees in general are not satisfied about compensation, promotion and job security. The study emphasize that employees are more satisfied more about work environment.
Table 4. 20 Descriptive analysis for demography based on length of services
Education From one year to 3 years From 3 years to 5 years From 5 years to 10 years More than 10 years
Variable Average Standard deviation Average Standard deviation Average Standard deviation Average Standard deviation Job satisfaction 2.97 0.65 3.19 0.71 3.08 0.95 3.63 0.77
Recruitment and selection 3.37 0.71 3.33 0.68 3.52 0.70 3.86 0.65 Training and development 3.00 0.73 3.19 0.74 3.08 0.99 3.68 0.57 Compensation 2.86 0.72 2.88 0.61 2.93 1.01 3.08 0.93 Performance appraisal 3.16 0.99 3.16 0.68 3.01 0.90 3.36 0.76 Work environment 3.75 0.57 3.71 0.51 3.90 0.71 3.86 0.75 Job design 3.31 0.79 3.22 0.75 3.07 1.04 3.70 0.78 Promotion 3.01 0.92 3.15 0.81 3.01 0.82 3.63 0.66 Job security 3.13 1.03 2.93 0.74 3.09 0.82 3.20 0.93 Recognition and appreciation 2.61 0.70 2.73 0.71 2.70 0.85 3.22 0.94
Based on the table above, employees who work for more ten years are the most satisfied employee group with an average of 3.63 and standard deviation of 0.77, whereas the least satisfied group among employees are those who work from one year to three years with an average of 2.97 and standard deviation of 0.65. Table 4.21 in general clarifies that employees are more satisfied with work environment practices and recruitment and selection, whereas they are less satisfied about compensation and recognition practices.
4.4 INFERENTIAL STATISTICS
In this section, we apply Pearson’s correlation coefficient analysis and multiple regression analysis to understand the relationship between dependent and independent variables further.
4.4.1 Correlation Analysis
First, we measure the correlation between job satisfaction and each one of the HRM dimensions one by one by using Pearson’s correlation analysis. The following table presents the resulting correlation coefficients.
Table 4. 21 correlation coefficient
Correlation coefficient
Job Satisfaction 1
Recruitment and Selection .263*
Training and Development .226*
Compensation .323** Performance .255* Work environment .343** Job design .250* Promotion .241* Job security .288**
Recognition and appreciation .285**
*. Correlation is significant at the 0.05 level (2-tailed). **. Correlation is significant at the 0.01 level (2-tailed)
According to the results in Table 4.22, all of the independent variables are positively correlated with the dependent variable, job satisfaction. The correlation with the variables job security and recognition and appreciation are significant at a higher significance level. Evaluating the values, the work environment and compensation have the two highest correlation coefficients (0.343 and 0.323 respectively, while promotion and training and development have the lowest values (0.226, 0.241 respectively).
4.4.2 Hypotheses Testing
In this research we are going to test the hypotheses to explore whether there is a relationship between dependent variable which is job satisfaction and other independent variables. Based on the table 4.23, there seems to be a positive correlation between all variables and the job satisfaction.