1
INDUSTRY THROUGH CUMULATIVE BELIEF DEGREES
*ÖZGÜR KABAK
Industrial Engineering Department, Istanbul Technical University, Macka Istanbul 34367, Turkey
FÜSUN ÜLENGİN, ŞULE ÖNSEL, ÖZAY ÖZAYDIN
Industrial Engineering Department, Dogus University, Acibadem Zeamet Sok. Istanbul 34722, Turkey
EMEL AKTAŞ
Business School, Brunel University, Kingston Lane Uxbridge, UB8 3PH, UK
This study aims to analyze the automotive industry from competitiveness perspective using a novel cumulative belief degrees (CBD) approach. For this purpose, a mathematical model based on CBD is proposed to quantify the relations among the variables in a system. This model is used to analyze the Turkish Automotive Industry through scenario analysis.
1. Introduction
Competitiveness is generally defined as the set of institutions, policies and relevant factors that determine the level of productivity of a country [1]. Each year, selected organizations, such as the World Economic Forum (WEF) and the Institute for Management Development (IMD), apply several hundred objective and subjective indicators to assess the wealth created by the world’s nations, and subsequently publish rankings of national competitiveness. As traditional competition becomes global, businesses fail to take the required measures on their own to become more competitive. Hence, in a globally competitive environment, national improvement has also become vital. Businesses need to utilize and be supported by countries’ international competitiveness. The purpose of this study is to analyse the system of automotive industry that enable national competitive advantage through a novel approach. In this way, it is
* This research is supported by SEDEFED (Federation of Industrial Associations), REF (TÜSİAD
aimed to facilitate the selection and prioritization of policies to be followed in order to improve Turkish Automotive Industry.
This study is a part of a large-scale project [2] that aims to analyse the competitiveness of the automotive industry. In this particular paper, we focus on the quantification of the relations in the system of automotive industry. The second section summarises the project. The third section gives the details of the proposed model. The fourth section presents the application of the model to Turkish Automotive Industry. Finally the fifth section concludes the paper. 2. Background of the study
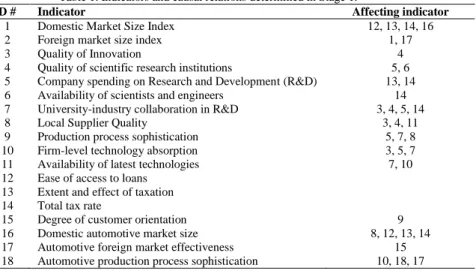
The methodology used in the project consists of three- stages. In the first stage, we collect information from various stakeholders to define the problem situation of the automotive industry. Indicators of the competitiveness are listed depending on the WEF indicators [3] and expert knowledge using a survey that is conducted to the stakeholders of the automotive industry. Furthermore; the relations among the indicators are determined through a workshop, participants of which are also the stakeholders. The results of the workshop are integrated to the mathematically found relations. As a result the indicators and the causal relations given in Table 1 are specified. The third column of the table shows the relations between indicators. For instance Foreign market size index (ID#2) is affected from Domestic market size index (ID#1), and Automotive foreign
market effectiveness (ID#17).
Table 1. Indicators and causal relations determined in Stage 1.
ID # Indicator Affecting indicator
1 Domestic Market Size Index 12, 13, 14, 16
2 Foreign market size index 1, 17
3 Quality of Innovation 4
4 Quality of scientific research institutions 5, 6 5 Company spending on Research and Development (R&D) 13, 14 6 Availability of scientists and engineers 14 7 University-industry collaboration in R&D 3, 4, 5, 14
8 Local Supplier Quality 3, 4, 11
9 Production process sophistication 5, 7, 8
10 Firm-level technology absorption 3, 5, 7
11 Availability of latest technologies 7, 10 12 Ease of access to loans
13 Extent and effect of taxation 14 Total tax rate
15 Degree of customer orientation 9
16 Domestic automotive market size 8, 12, 13, 14 17 Automotive foreign market effectiveness 15 18 Automotive production process sophistication 10, 18, 17
In the light of the results of first stage, a mathematical model based on Bayesian Causal Networks (BCNs) was set up. It is aimed to formulate the relationships that will enable to calculate the results of the various policies under different scenarios. During the second stage we realised that some of the observed evidence required for building BCNs are missing or not adequate. The stakeholders prefer to use linguistic terms instead of numerical expressions that improves the understanding of the system. Therefore in this study we develop a novel model based on cumulative belief degrees (CBDs) to reveal the relationships among the indicators using fuzzy linguistic terms.
3. CBDs approach for quantification of causal relations
The CBDs approach was developed for nuclear safeguards evaluation based on fuzzy linguistic terms and belief structure [4]. Basically, CBDs enable mathematical operations on the belief structures. In this research we use CBDs to quantify the causal relations among the variables in a system. For instance, suppose that we intent to analyze the relations in the system given in Figure 1, where variables A and C are inputs and variable D is the output. Our aim here is to quantify the given relations (i.e., AB; BD; CD) so that we can make interpretations about the output when the inputs are changed.
Figure 1. An example of a system with four variables
Quantification of the relations in such a system can be achieved by the use of past data and/or expert opinions. In this study we assume that all the data and/or expert opinions are represented by belief structures and linguistic terms. Given the fact that most of the different type of information represented by different scales can be converted to belief structures [4] it is a valid assumption. 3.1. CBDs Defined
We use fuzzy linguistic terms [5] to represent the information by the belief structure. Let S = {si}, i {0,...,m} be a finite and totally ordered term set. Any label, si, represents a possible value for a linguistic variable. Linguistic term sets can be defined according to the nature of the problem. For the current study we use a five-term set, S = {si}, i {0,...,4}, in which the following meanings to the terms are assigned. s0: very low, s1: low, s2: medium, s3: high, s4: very high.
The belief structure represents general belief of the level of an indicator as a result of past data or expert evaluations. Such that, if the past data of an
indicator is available, the fuzzy linguistic sets are defined and the membership degrees of evidence to the fuzzy sets are specified as belief degrees.
In general, the belief structure can be defined as follows:
( ) {( ) )} ∑ (2) where k and i are indices for indicators and linguistic terms, respectively, and βik is the belief degree for the level of indicator k at si level.
The CBD at certain linguistic term level can be defined as the aggregated belief degrees of greater or equal terms of the related linguistic term. The cumulative belief structure can be defined as follows:
( ) {( ) )} ∑ (3) where γik is CBD related to indicator k at threshold level i.
3.2. Proposed model
We assume a system of variables (or indicators) with relations among them. The aim is to quantify the relations given past data or expert opinions in CBDs. Suppose that N, the set of relations between indicators such that if indicator l affects indicator k, then (l,k) N, is known and we try to find , importance weight related to the relation (i,k), in the following equation:
∑ ( ) ∑ (4)
where i and j are indices for linguistic terms (i corresponds to indicator k, and j corresponds to indicator l). Here we assume that CBD of any indicator at each linguistic term set level is affected from CBDs of affecting indicators at all linguistic term set levels. The importance weights can be derived from the given data or expert opinion as a regression-based model as follows.
For k, which is an affected indicator; l, which are affecting indicator of k. Find , ; By minimizing ∑ ∑ ( ) (5) Subject to ∑ ( ) ∑ ; ∑ ∑ where n is an index for the evident data, is the error related to dataset n, for calculating . This model can be solved like a classical regression model or by any non-linear optimization method.
4. Analyzing the Turkish Automotive Industry using CBDs approach The proposed CBDs approach is used for quantification of the relations in Turkish Automotive Industry, which are given in Table 1. We used the data of
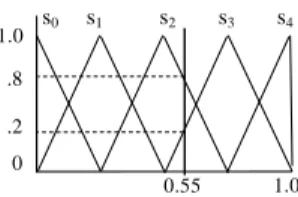
28 countries provided from WEF report [3]. The data first normalized to 0-1 interval (the best score is 1 and the worst score is 0). Then the membership values of the normalized scores to the fuzzy sets defined in Figure 2 are determined as the belief degrees. For instance if the normalized score is 0.55 then the related belief structure is B(I) = {(s2, .8), (s3, .2)} (See Figure 2)
Figure 2. Fuzzy sets for transforming the data to belief structure
The proposed model is built for 15 indicators (all indicators except #12, #13, and #14) that are affected from other indicators. For instance for indicator #9, the affecting indicators are #5, #7, and #8, and the weights calculated as given in Table 2. Results show that #8 has the highest impact on #9.
Table 2. Weight related to indicator #9
.333 0 0 0 0 .333 0 0 0 0 .333 0 0 0 0 0 .092 0 0 0 0 .099 0 0 0 0 .604 .205 0 0 0 .066 .061 .001 0 0 0 0 .154 0 0 0 .471 .247 0 0 0 .106 .097 0 0 0 0 .269 0 0 0 0 .518 .011 0 0 0 .014 .598 0 0 0 0 0 0 0 0 0 .389
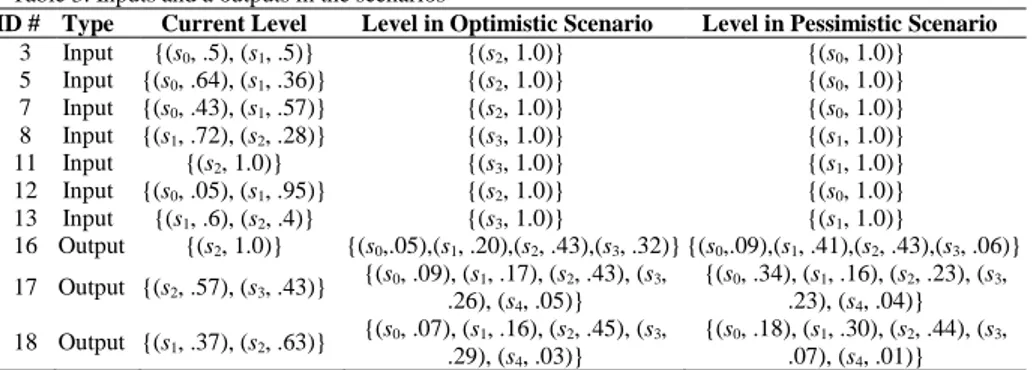
After finding all the weights they are used for analyzing different scenarios for Turkish Automotive Industry. Optimistic and pessimistic scenarios are designed for this purpose [2]. In the scenario analysis the input indicators, namely #3, #5, #7, #8, #11, and #13, are selected based on previous analysis of the industry [2]. The output indicators are performance indicators of the automotive industry, namely indicators #16, #17, and #18. In the optimistic scenario each input indicator set as a next upper linguistic term level. in the pessimistic scenario, each input indicator drops to next lower level. The levels of input indicators in the scenarios are presented in Table 3.
The resulting levels of the output indicators are given in the last three rows of Table 3. The results are consistent with the expectations. In the optimistic scenario, the possibility of outputs’ level increases while the possibility of outputs level decreases in the pessimistic scenario. According to the results, if Turkey shows an improvement defined in the optimistic scenario, the Domestic
automotive market size will be medium with .43 and high with .32 possibilities,
s0 s1 s2 s3 s4 0.55 1.0 .8 .2 0 1.0
the Automotive foreign market effectiveness will be medium with .43 and high with .26 possibilities; and Automotive production process sophistication will be
medium with .45 and high with .29 possibilities. However, when the situation
worsens (i.e., the pessimistic scenario), the Domestic automotive market size will decrease to low with .41 and medium with .43 possibilities. The level of the
Automotive foreign market effectiveness become very uncertain, as the
possibility is distributed to very low, low, medium, and high almost evenly. The pessimistic scenario does not yield a significant change for the Automotive
production process sophistication.
Table 3. Inputs and a outputs in the scenarios
ID # Type Current Level Level in Optimistic Scenario Level in Pessimistic Scenario 3 Input {(s0, .5), (s1, .5)} {(s2, 1.0)} {(s0, 1.0)} 5 Input {(s0, .64), (s1, .36)} {(s2, 1.0)} {(s0, 1.0)} 7 Input {(s0, .43), (s1, .57)} {(s2, 1.0)} {(s0, 1.0)} 8 Input {(s1, .72), (s2, .28)} {(s3, 1.0)} {(s1, 1.0)} 11 Input {(s2, 1.0)} {(s3, 1.0)} {(s1, 1.0)} 12 Input {(s0, .05), (s1, .95)} {(s2, 1.0)} {(s0, 1.0)} 13 Input {(s1, .6), (s2, .4)} {(s3, 1.0)} {(s1, 1.0)} 16 Output {(s2, 1.0)} {(s0,.05),(s1, .20),(s2, .43),(s3, .32)} {(s0,.09),(s1, .41),(s2, .43),(s3, .06)} 17 Output {(s2, .57), (s3, .43)} {(s0, .09), (s.26), (s1, .17), (s2, .43), (s3, 4, .05)} {(s0, .34), (s1, .16), (s2, .23), (s3, .23), (s4, .04)} 18 Output {(s1, .37), (s2, .63)} {(s0, .07), (s1, .16), (s2, .45), (s3, .29), (s4, .03)} {(s0, .18), (s1, .30), (s2, .44), (s3, .07), (s4, .01)} 5. Conclusions
One of the novel contributions of this study is the use of the CBD approach to quantify the relations among the variables in a system. The method can be applied to any data as long as they are transformed to belief structures. This property can be useful when different types of data available, such as expert opinions, numerical values, linguistic expressions etc., in a single problem. The applicability of the problem is justified by the automotive industry application.
Further studies may be done to investigate to application of the proposed model to analyze other sectors.
References
1. E.W. Artto, Management International Review; 27, 47-58 (1987)
2. F. Ulengin, Ş. Önsel, E. Aktaş, Ö. Kabak, www.sedefed.org/documents/ RK_2010_Raporlar_-_Otomotiv_Sektoru_Raporu_2010.pdf (2010)
3. WEF, Global Competitiveness Report 2010-2011 (2010)
4. Ö. Kabak and D. Ruan, IEEE Transactions on Knowledge and Data Engineering; 23, 1441-1454 (2011)