Tar. Bil. Der. Dergi web sayfası:
www.agri.ankara.edu.tr/dergi www.agri.ankara.edu.tr/journalJournal homepage:
Segregation of Blackberry Cultivars Based on the Fruit
Physico-Chemical Attributes
Tomo MİLOSEVİCa, Evica MRATİNİCb, Nebojsa MİLOSEVİCc, Ivan GLİSİCd, Jelena MLADENOVİCe
a
Faculty of Agronomy, Department of Fruit Growing and Viticulture, Cara Dusana, SERBIA
b
Faculty of Agriculture, Department of Fruit Growing, Belgrade, SERBIA
c
Fruit Research Institute, Department of Pomology and Fruit Breeding, Cacak, SERBIA d
Faculty of Agronomy, Department of Fruit Growing and Viticulture, Cacak, SERBIA
e
Faculty of Agronomy, Department of Chemistry and Chemical Engeneering, Cacak, SERBIA
ARTICLE INFO
Research Article — Crop Production
Corresponding Author: Evica MRATİNİC, e-mail: [email protected], Tel: +381 65 60 600 11 Received: 04 February 2012, Received in revised form: 30 Agust 2012, Accepted: 18 December 2012
ABSTRACT
Blackberries are considered as a rich source of phyitochemicals with high nutraceutical value and beneficial health effects. The objective of this work was to determine the berry size and composition status of blackberry cultivars grown under Serbian conditions. Fresh berries of seven blackberry cultivars (‘Black Satin’, ‘Dirksen Thornless’, ‘Chester Thornless’, ‘Thornfree’, ‘Čačanska Bestrna’, ‘Loch Ness’ and ‘Navaho’) were used as a plant material during two growing seasons. According to the results, the highest berry size was found in ‘Čačanska Bestrna’ and ‘Loch Ness’, dry matter (DM) and titratable acidity (TA) in ‘Chester Thornless’ and pH value in ‘Dirksen Thornless’ cultivars. The highest content of soluble solids (SSC), sugars content, SSC/TA rate and total sugars (TS)/TA rate was observed in ‘Navaho’, and mineral mater (MM) in ‘Loch Ness’ and ‘Chester Thornless’. The highest total phenolics content (TPH) and total antioxidant capacity (TAC) were found in ‘Black Satin’, total flavonoids content (TFC) in Thornfree, and ascorbic acid (AA) in ‘Loch Ness’. Based on the present results, the strong relationships between some phytochemicals, especialy between bioactive compunds, were observed. On the basis of principal component analysis (PCA), the cultivars were segregated based on the better quality attributes, which were observed in ‘Navaho’ and ‘Loch Ness’, somewhat in ‘Chester Thornless’ and ‘Black Satin’.
Keywords: Acidity; Antioxidant capacity; Blackberry cultivars; Sugars; Total phenolics content; Principal component analysis
Fiziko-Kimyasal Özelliklerine Göre Böğürtlen Çeşitlerinin Belirlenmesi
ESER BİLGİSİAraştırma Makalesi — Bitkisel Üretim
Sorumlu Yazar: Evica MRATİNİC, e-posta: [email protected], Tel: +381 65 60 600 11 Geliş Tarihi: 4 Şubat 2012, Düzeltmelerin gelişi: 30 Ağustos 2012, Kabul: 18 Aralık 2012
ABSTRACT
Böğürtlen yüksek fonksiyonel gıda değerine sahip, sağlık üzerinde olumlu etkileri olan ve fitokimyasallar bakımından zengin bir meyvedir. Bu çalışma, Sırbistan koşullarında yetiştirilen böğürtlen çeşitlerinin, meyve iriliğinin ve kompozisyonunun belirlenmesi amacıyla yürütülmüştür. İki yıl süreyle yapılan analizlerde yedi böğürtlen ('Black saten', 'Dirksen Thornless', 'Chester Thornless', 'Thornfree', 'Čačanska Bestrna', 'Loch Ness' ve 'Navaho') çeşidine ait yaş meyve materyal olarak kullanılmıştır. En iri meyveler 'Čačanska Bestrna' ve 'Loch Ness' çeşitlerinde, en yüksek kuru madde ve titre edilebilir asit (TA) 'Chester Thornless' çeşidinde ve en yüksek pH değeri 'Dirksen Thornless' çeşidinde bulunmuştur. En yüksek suda çözünebilir kuru madde (SÇKM), SÇKM / TA oranı, şeker içeriği, ve toplam şeker /TA oranı 'Navaho' çeşidinde ve en yüksek mineral madde içeriği 'Loch Ness'
TA RI M B İL İM LER İ D ERG İS İ JOU RN AL O F AG RI CU LT U RA L SC IE N CE S 1 8 (2 01 2) 1 00 -1 09
ve 'Chester Thornless' çeşitlerinde tespit edilmiştir. En yüksek toplam fenolik içeriği ve total antioksidan kapasitesi ‘Black Satin’ çeşidinde, en yüksek toplam flavonoid içeriği ‘Thornfree’ çeşidinde ve en yüksek askorbik asit 'Loch Ness' çeşidinde bulunmuştur. Özellikle bazı fitokimyasallar ve özellikle biyoaktif bileşikler arasında güçlü ilişkiler gözlenmiştir. Temel bileşenler analizi (PCA) çeşitleri meyve kalitesine göre ayırt etmiş, 'Navaho' ve 'Loch Ness' çeşitleri diğerlerine göre daha yüksek ve 'Chester Thornless' ile ‘Black Satin’ ise orta derecede kaliteli bulunmuştur.
Anahtar Kelimeler: Asitlik; Antioksidan kapasitesi; Böğütlen çeşitleri, Şekerler; Toplam fenolik içerik; Temel bileşenler analizi
© Ankara Üniversitesi Ziraat Fakültesi
1. Introduction
In recent years, increasing attention has been paid to consumers’ health, nutritional aspects (vitamin content, mineral elements, antioxidants etc.) of horticultural products. A diet rich in fruits offers protection against some most spread diseases such as cardiovascular, cancerous and many age-related degenerative diseases (Ames et al 1993). As one of the most popular berry crops, blackberry (Rubus spp.) are consumed as fresh, frozen, or commercially processed into a variety of foods and other products such as jam, wine, tea, ink, dyes, fruit leather, and medicine (Türemiş et al 2003). It has been a favorite fruit, not only due to its pleasant flavor but also to its high nutritive value. They are reach sources of carbohydrates, dietary fiber, vitamin and minerals (Kafkas et al 2006). Also, blackberries are rich in phenolic compounds such as anthocyanins,
flavonols, ellagitannins, gallotannins,
proanthocyanidins and phenolic acids (Seeram et al 2006). These phenolic compounds from berries provide many biological functions such as antioxidant,
anticancer, anti-neurodegenerative, and
anti-inflammatory activities (Seeram et al 2006; Wang 2007). The discoveries of the health benefits of blackberries have spurred the rapid growth of blackberry production for the fresh, processed, and nutraceutical markets. For these reasons, the production of blackberries has increased by 45% from 1995 to 2005, reaching a worldwide production of 154643 tons at the end of the period (Strik et al 2007). In their survey, Serbia accounted for 69% of the blackberry area in Europe and had the greatest area in the world. Serbia produced 27557 tons, the fourth highest production in the world after USA, Mexico and China. However, Serbian production was predominantly intended for processing, whereas production for fresh market was low as unsuitable cultivars were used. To meet the expanding world market, blackberry cultivars with different characteristics that will meet the demands of the fresh and processing markets are needed. In this context, more interest had arisen in analyzing the composition of phytochemicals in fresh blackberries. Previous studies on blackberries indicated
that genetic and environmental factors, such as cultivar, maturity, UV light exposure, soil, cultural practices and harvesting method, play an important role in berry composition (Siriwoharn et al 2004). Due to blackberry composition highly influenced by above factors, multivariate analysis must be used to study correlations among variables and to establish relationships among cultivars (Milosevic & Milosevic 2010). In addition, principal component analysis (PCA) is a method of data reduction that transforms the original variables into a limited number of uncorrelated new variables.
The objective of this work was to evaluate and compare fruit quality attributes of seven blackberry cultivars based on the basic physico-chemical properties, total phenolic and flavonoid content and antioxidant capacity, and segregation of cultivars with best fruit primary and secondary metabolites. The results may be applied in areas with climatic and soil conditions similar to those in Western Serbia. They may also help the processing industry to choose appropriate cultivars for its products, and consumers by providing basic information about the nutraceutical value of blackberries.
2. Materials and Methods
2.1. Plant material and field trialBlackberries were grown in private plantation in Prislonica village (43°53’N; 20°21’E; 340 m altitude) near Cacak (Western Serbia). Soil and weather characteristics during experimental period (2009 and 2010) were similar to data previously described by Milosevic et al (2011). Six introduced cultivars (‘Black Satin’, ‘Dirksen Thornless’, ‘Chester Thornless’, ‘Thornfree’, ‘Loch Ness’, ‘Navaho’) and one Serbian cultivar (‘Čačanska Bestrna’) used as plant material. A
randomized complete block design with four
replications and 10 plants per replicates was used. Two harvest season, commercially ripe-dull black fruit, stage VII as described by Perkins-Veazie et al (2000) were hand-picked from each replication at the peak harvest period for each cultivar, placed in plastic zip lock bags and stored in an ice chest during transport to laboratory within 6 h of harvest. Samples were segregated based on size and freedom from blemish or
damage. Twenty five berries with four replicates were analysed immediately to establish berry weight (BW). After arrival at the laboratory the samples were immediately cleaned with distilled water, chopped into small pieces and freeze-dried. After lyophilisation, samples were allowed to equilibrate in open air and ground to pass a 0.5 mm sieve. The samples were stored at -20°C for further chemical analysis.
2.2. Determination of berry weight, dry and mineral matter contents
The BW (n = 100) was measured by a Tehnica ET– 1111 technical scale (Iskra, Horjul, Slovenia) with a sensitivity of ±0.01 g. For determination of DM, thirty whole berries were randomly selected from each cultivar in three replicates and mixed thoroughly. DM contents were then determined by drying triplicate 20 g samples at 80°C for 72 h to the constant weight in a forced air oven. For MM, samples were prepared as described by Chaira et al (2009). One gram of powdered dry pulp was ignited and incinerated in the muffle furnace at 530°C for 8 h. The ash was then dissolved in 5 ml of hydrochloric acid (20%) and the solution was transferred to a 50 ml volumetric flask. The final volume was achieved with ultra pure water. Data are given as % of fresh weight (FW).
2.3. Determination of soluble solids contents, titratable acidity, juice pH and sugars content
Fruit slices, obtained from 30 whole berries in three replicates, were homogenized in a blender and the homogenate used to determine SSC, TA and juice pH, respectively. For their determination, ∼10 g of slices per replicate were homogenized, and the homogenate filtered through several layers of cheese-cloth to obtain a clear juice. The SSC was recorded with a hand refractometer Milwaukee MR 200 (ATC, Rocky Mount, USA) at 20°C, and expressed as °Brix. For determination of TA, aliquots of 5-10 ml berry juices were diluted with 40-50 ml of distilled water. Prepeared juice was titrated with 0.1 mol l-1 NaOH, up to pH 8.1 using a titrimeter Metrohm 719S (Titrino, Herisau, Switzerland), and expressed as % of malic acid. Once the SSC and TA were assessed, the SSC/TA rate or ripening index (RI) was calculated. The pH of the aforementioned blackberry juice was measured using a Cyber Scan 510 pH meter (Nijkerk, Netherlands), and results expressed as units of pH.
The TS and reduced sugars (RS) contents were determined on triplicate samples by the Luff-Schoorl method based on reduction reaction of copper (II) ions contained in Luff’s liquid [sodium carbonate, citric acid, copper (II) sulphate (VI)] by the reduced sugars present in the studied solution (Schneider 1979). The sucrose content (SC) was calculated according to the
relationship: SC = (TS – RS) × 0.95. The results were expressed in % of FW.
2.4. Determination of bioactive compounds
The AA was determined by titration with Tillman solution (0.02% 2,6 dichloro-indophenol, DFI from Sigma) described by Strohecker & Henning (1967). One gram of assay was diluted to 100 ml of 0.5% oxalic acid and then homogenized. Then 5 ml of this solution was taken and added to distilled water at the level of 50 ml and titrated, thus results were expressed as mg 100 g-1 FW.
The TPH, TFC and TAC were determined
spectrophotometrically using UV-Vis
spectrophotometer MA 9523-SPEKOL 211 (Iskra, Horjul, Slovenia). All three values are presented as means of triplicate analyses for each cultivar.
The TPH was estimated according to the Folin-Ciocalteu method (Gutfinger 1981). Berry extracts were diluted in methanol to the concentration of 1 mg ml-1, and aliquots of 0.5 ml were mixed with 2.5 ml of Folin-Ciocalteu reagent (previously diluted 10-fold with distilled water) and 2 ml of NaHCO3 (7.5%). After 15 min of staying at the 45°C the absorbance was measured at 765 nm on a spectrophotometer versus blank sample. Total phenols were determined as gallic acid equivalents [mg GAE g-1 dry extract (DE)].
The TFC was determined according to Brighente et al (2007). Briefly, 0.5 ml of 2% aluminium chloride (AlCl3) in methanol was mixed with the same volume of methanol solution of plant extracts. After 1 h of staying at room temperature, the absorbances of the
samples were measured at 415 nm on a
spectrophotometer versus blank sample. The TFC was determined as rutin equivalents (mg RU g-1 DE).
The TAC of the methanol extracts were evaluated by the phosphor-molybdenum method (Prieto et al 1999). The assay is based on the reduction of Mo (VI) - Mo (V) by the antioxidant compounds and subsequent formation of a green phosphate/Mo (V) complex at acid pH. The 0.3 ml of sample extracts were combined with 3 ml of reagent solution (0.6 M sulfuric acid, 28 m mol-1 sodium phosphate and 4 m mol-1 ammonium molybdate). The tubes containing the reaction solution were incubated at 95°C for 90 min. Then the absorbance of the solution was measured at 695 nm using spectrophotometer against blank after cooling to room temperature. Methanol (0.3 ml) in the place of extract was used as the blank. Ascorbic acid (AA) was used as standard and the total antioxidant capacity is expressed as mg AA g-1 of DE.
All chemicals and reagents were of analytical grade and were purchased from Sigma Chemical Co. (St Louis, MQ, USA), Aldrich Chemical Co. (Steinheim,
Germany) and Alfa Aesar (Karlsruhe, Germany). Double-deionized water was used in all experiments.
2.5. Data analysis
Data for each parameter measured were subjected to an analysis of variance (ANOVA) using the MSTAT-C statistical package (Michigan State University, East Lansing, MI, USA). Differences between cultivars were assessed using the F-test, and the least significant difference (LSD) was calculated at 0.05 probability level (P≤0.05). The relationships between the fruit quality attributes were evaluated by Pearson’s product moment correlation at P≤0.05. As a tool of cultivar description and determine the relationships among them to study correlations among variables in blackberry, we have used PCA. The PCA was performed using the PRINCOMP procedure of the SAS statistical package (SAS Institute Inc., NC, USA). All data are presented as mean ± standard error for two seasons.
3. Results and Discussion
3.1. Evaluation of physico-chemical attributes
The mean of BW values among the cultivars were found statistically significant (Table 1).
The largest berries were observed in ‘Čačanska Bestrna’ and ‘Loch Ness’, While the lowest in ‘Navaho’. Present results were much higher with the observations of Eyduran et al (2008) and lower than those of Vrhovsek et al (2008) for set of same cultivars. The differences among same cultivars could be due to environmental conditions, growing season and cultural practices, as previously recorded (Gercekcioglu & Esmek 2005; Yılmaz et al 2009). In general, the ideal BW for fresh market uses is 8-10 g (Clark & Finn 2011).
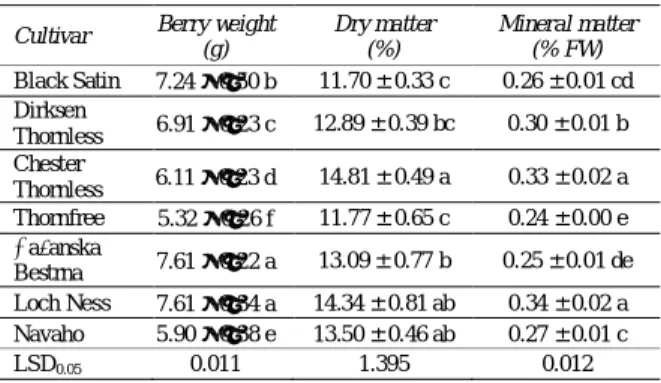
Table 1- Berry weight, dry matter and mineral matter content of blackberry cultivars
Çizelge 1– Böğürtlen çeşitlerinde mineral madde içeriği, kuru madde miktarı ve ağırlık
Cultivar Berry weight (g) Dry matter (%) Mineral matter (% FW) Black Satin 7.24 ± 0.50 b 11.70 ± 0.33 c 0.26 ± 0.01 cd Dirksen Thornless 6.91 ± 0.23 c 12.89 ± 0.39 bc 0.30 ± 0.01 b Chester Thornless 6.11 ± 0.23 d 14.81 ± 0.49 a 0.33 ± 0.02 a Thornfree 5.32 ± 0.26 f 11.77 ± 0.65 c 0.24 ± 0.00 e Čačanska Bestrna 7.61 ± 0.22 a 13.09 ± 0.77 b 0.25 ± 0.01 de Loch Ness 7.61 ± 0.34 a 14.34 ± 0.81 ab 0.34 ± 0.02 a Navaho 5.90 ± 0.38 e 13.50 ± 0.46 ab 0.27 ± 0.01 c LSD0.05 0.011 1.395 0.012
Data are the means of three replications ± standard error (SE), except berry weight.
Values within column followed by the same letter(s) are not significantly different at P ≤ 0.05 by LSD test.
Tested blackberry cultivars differed considerably in terms of DM (Table 1). ‘Chester Thornless’ contained the highest DM content, whereas ‘Black Satin’ and ‘Thornfree’ had the smallest. Tosun et al (2008) reported that average content of DM in nine wild blackberries were 15.43%, whereas Tamer (2012) and Miletić et al (2006) found that DM in blackberry cultivars varied from 13.76 to 15.58 g 100 g-1, and from 8.78% to 11.14%, respectively, so these results were consistent with ours. Generally, DM content is a very important characteristics in determining suitability of cultivars for processing and drying.
The highest content of MM was observed in ‘Chester Thornless’ and ‘Loch Ness’, and the lowest in ‘Thornfree’ (Table 1). Previous studies also reported important levels of minerals in blackberries (Kafkas et al 2006; Tosun et al 2008).
SSC significantly changed among cultivars (Table 2). The best value was found in ‘Navaho’ and the poorest in ‘Black Satin’. A high variability among cultivars regarding SSC has been previously reported in the literature (Gerçekcioğlu & Esmek 2005; Miletić et al 2006; Tosun et al 2008; Yılmaz et al 2009; Tamer 2012). For example, Vrhovsek et al (2008) reported that SSC were 9.3°Brix, 7.0°Brix, 7.5°Brix and 10.6°Brix for ‘Black Satin’, ‘Čačanska Bestrna’, ‘Chester Thornless’ and ‘Loch Ness’, respectively, while Basaran & Kepenek (2011) exhibited range from 8.5°Brix to 14.1°Brix, which confirmed our results. Clark & Finn (2011) concluded that SSC of at least 10% provides for a “sweet” eating experience for fresh blackberries. In the present study, all blackberries, except ‘Black Satin’, provide SSC beyond to 10° Brix and had good performances for consumer acceptance, as previously described (Vrhovsek et al 2008). The variation of SSC in blackberries could be due to different cultivars used, environmental conditions, maturity stage, nutritional status of the plantations and numerous pre-harvest factors as well (Prange & De Ell 1997; Yılmaz et al 2009).
Content of TA significantly varied among cultivars (Table 2), being higher in ‘Chester Thornless’ and lower in ‘Navaho’. Variability among cultivars regarding TA has been previously reported in the literature (Kafkas et al 2006; Miletić et al 2006; Basaran & Kepenek 2011; Tamer 2012). Generally, our data are similar to those obtained by Vrhovsek et al (2008) for set of same cultivars, but different when compared with above authors. The differences may originate from cultivar, ecological conditions and harvesting time (Miletić et al 2006; Tamer 2012). For example, organic acids usually decline during ripening as they are respired or converted to sugars (Tosun et al 2008).
Table 2 - Soluble solids content, titratable acidity, pH values and soluble solids content/titratable acidity ratio of blackberry cultivars
Çizelge 2 -Çözünür madde miktarı, titre edilebilir asitlik, pH ve suda çözünür kuru madde içeriği / böğürtlen çeşitlerinin titrasyon asitliği oranı
Cultivar Soluble solids
(°Brix) Titratable acidity* (%) pH SSC/TA ratio (RI) Black Satin 9.90 ± 0.28 e 2.04 ± 0.09 e 2.99 ± 0.06 ab 4.85 ± 0.47 c Dirksen Thornless 12.20 ± 0.53 cd 1.77 ± 0.04 f 3.12 ± 0.07 a 6.89 ± 0.72 ab Chester Thornless 13.30± 0.59 ab 2.36 ± 0.08 a 2.76 ± 0.05 c 5.63 ± 0.56 bc Thornfree 10.30 ± 0.44 e 2.09 ± 0.06 d 2.92 ± 0.06 b 4.93 ± 0.39 c Čačanska Bestrna 11.40 ± 0.39 d 2.28 ± 0.09 b 2.76 ± 0.07 c 5.00 ± 0.46 c Loch Ness 12.80 ± 0.69 bc 2.20 ± 0.07 b 2.67 ± 0.05 c 5.82 ± 0.57 bc Navaho 13.50 ± 0.88 a 1.69 ± 0.05 g 2.94 ± 0.05 ab 7.99 ± 0.81 a LSD0.05 1.038 0.036 0.196 1.379
*As malic acid.Data are the means of three replications ± standard error (SE).
Values within column followed by the same letter(s) are not significantly different at P ≤ 0.05 by LSD test. Data in the Table 2 showed that pH values in raw
materials significantly changed among cultivars. The highest values were found in ‘Dirksen Thornless’ and the lowest in ‘Chester Thornless’, ‘Čačanska Bestrna’ and ‘Loch Ness’. Basaran & Kepenek (2011) and Tamer (2012) reported that pH values in ‘Chester Thornless’ and ‘Navaho’ were 2.91 and 2.9 units, respectively, which confirmed our results. Differences among cultivars regarding pH values also previously reported (Pantelidis et al 2007). In addition, the quality attributes of juice acidity (total acidity and pH) and the total soluble solids content are very important in the food industry and critical in comparative studies where variations by genotype and environment are high (Šturm et al 2003).
The ratio of SSC and TA or RI plays an important role for evaluating the fruit quality. In the present study, the best RI was observed in ‘Navaho’, and the poorest in ‘Black Satin’, ‘Thornfree’ and ‘Čačanska Bestrna’. Türemiş et al (2003) also found that ‘Navaho’ had the best RI values, whereas ‘Loch Ness’ had the
poorest RI in their study. Kafkas et al (2006) reported that ‘Loch Ness’ had the lowest SSC/TA rate when compared with data for ‘Navaho’ and ‘Chester Thornless’, whereas Joo et al (2011) was found that ‘Chester Thornless’ had higher RI value than ‘Čačanska Bestrna’, which confirmed our results. From these results, it was concluded that some of the cultivars seem to have an effect on the carbohydrate metabolism of the berries (Basaran & Kepenek 2011). The earlier studies also showed that blackberries exhibit high variability among cultivars regarding RI (Siriwoharn et al 2004; Vrhovsek et al 2008; Yılmaz et al 2009). Generally, consumers preferred blackberries with high RI values (Kafkas et al 2006).
According to our data, ‘Navaho’ had the highest content of RS, SC and TS (Table 3). Also, ‘Loch Ness’ had high amount of RS. Contrary, the lowest amounts of RS and TS were observed in ‘Black Satin’ and ‘Thornfree’, whereas the lowest SC was registered in berries of ‘Čačanska Bestrna’.
Table 3 - Sugar contents and total sugars/titratable acidity ratio (index of sweetness) of blackberry cultivars Çizelge 3 - Şeker içeriği ve toplam şeker / böğürtlen çeşitlerinin titrasyon asitliği oranı (tatlılık endeksi)
Cultivar Reducing sugars
(% FW) Sucrose (% FW) Total sugars (% FW) TS/TA ratio (IS) Black Satin 5.65 ± 0.33 c 0.98 ± 0.06 c 6.68 ± 0.48 e 3.27 ± 0.29 d Dirksen Thornless 7.98 ± 0.62 ab 1.00 ± 0.07 b 9.04 ± 0.67 cd 5.11 ± 0.48 b Chester Thornless 8.18 ± 0.83 ab 0.89 ± 0.03 e 9.12 ± 0.79 bc 3.86 ± 0.34 cd Thornfree 6.12 ± 0.41 c 0.86 ± 0.06 f 7.02 ± 0.53 e 3.36 ± 0.33 d Čačanska Bestrna 7.36 ± 0.49 bc 0.85 ± 0.05 g 8.25 ± 0.64 d 3.62 ± 0.39 d Loch Ness 9.01 ± 0.89 a 0.90 ± 0.05 d 9.96 ± 0.78 ab 4.53 ± 0.41 bc Navaho 9.08 ± 0.91 a 1.08 ± 0.06 a 10.22 ± 0.88 a 6.05 ± 0.62 a LSD0.05 1.784 0.003 0.874 0.780
Data are the means of three replications ± standard error (SE).
Kafkas et al (2006) reported that sugar accumulation, especially high level of reducing sugars i.e. fructose, is a very important process that determines the desert fruit quality. In their survey, content of reducing sugars (glucose, fructose), sucrose and total sugars among the cultivars were found statistically significant. So, above authors reported that mean sucrose contents in ‘Navaho’, ‘Chester Thornless’ and ‘Loch Ness’ were 2.6 mg g-1, 1.5 mg g-1 and 2.0 mg g-1, respectively, whereas mean total sugar amounts for above cultivars were 62.5 mg g-1, 43.6 mg g-1 and 52.5 mg g-1, respectively. Contrary to our data, Miletić et al (2006) reported that ‘Thornfree’ contained significantly higher TS than ‘Čačanska Bestrna’ and ‘Black Satin’. The differences between the results could be due to geographical or maturity stage differences (Tosun et al 2008). In the present study, SC was detected in lower amounts compared to RS in all the cultivars due to the fact that it may be converted to invert sugars during the ripening process, as previously reported (Türemiş et al 2003; Kafkas et al 2006).
The ratio of sugar/acid or IS play an important role for evaluating the fruit quality, especially to berry flavor (Kafkas et al 2006), and determine the optimum time for harvesting, because it is considered as an index of quality (Perkins-Veazie et al 2000; Yılmaz et al 2009). Data summarized in the Table 3 showed that high level of IS was obtained in the ‘Navaho’, whereas low IS was found in the ‘Black Satin’, ‘Thornfree’ and ‘Čačanska Bestrna’. Previous study on blackberries also reported that ‘Navaho’ had best IS values than other cultivars (Türemiş et al 2003; Kafkas et al 2006; Perkins-Veazie et al 2000). Generally, our results for TS were much better with the findings of Miletić et al (2006) who reported that these nutraceutical significantly affected by cultivars and varied from 2.01 to 2.75 units. The differences may originate from ecological conditions, cultural practices and harvesting time, as previously reported (Siriwoharn et al 2004; Yılmaz et al 2009; Basaran & Kepenek 2011).
3.2. Evaluation of bioactive compounds
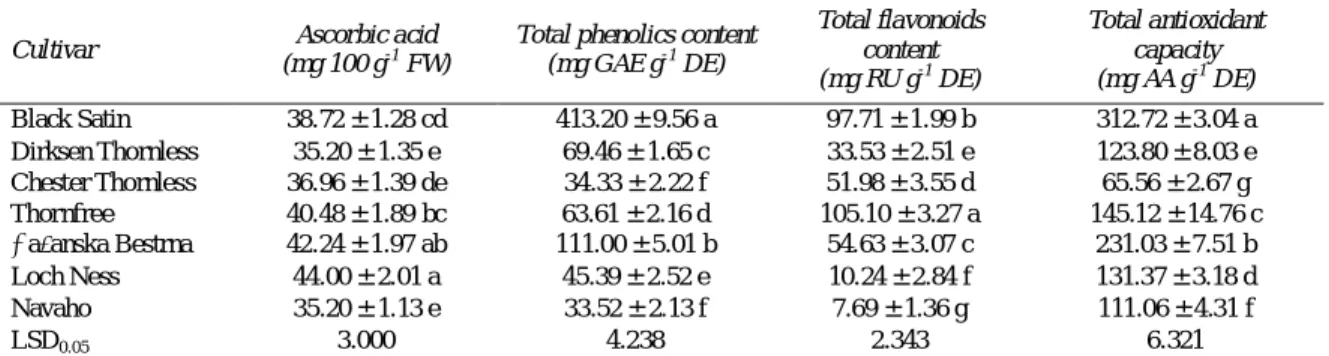
The AA or vitamin C is considered to be one of the most typical, least toxic natural antioxidants. In the present study, significant differences in AA among different cultivars were recorded (Table 4).
The highest value was observed in ‘Loch Ness’, and the lowest in ‘Navaho’ and ‘Dirksen Thornless’. Basaran & Kepenek (2011) reported that AA changed between 25.6 mg g-1 to 69.2 mg g-1 in some blackberries. According to Tamer (2012), ascorbic acid content significantly varied among cultivars and ranged from 13.76 mg 100 g-1 to 15.58 mg 100 g-1 FW, whereas Pantelidis et al (2007) found this parameter
between 14.3 mg 100 g-1 and 17.5 mg 100 g-1 FW. Kafkas et al (2006) observed great variations in the ascorbic acid contents of the cultivars. The highest ascorbic acid content was detected in ‘Loch Ness’ (14.9 mg g-1), while no ascorbic acid was detected in ‘Navaho’ and ‘Jumbo’ cultivars (Kafkas et al 2006). Data from above authors for AA were much lower than results in the present study. The differences between the results may be due to the using different measuring methods, cultivars, ecological conditions and harvesting time (Basaran & Kepenek 2011; Tamer 2012).TPH, TFC and TAC were determined in the methanol extract of blackberry cultivars. Data presented in the Table 4 showed that ‘Black Satin’
contained the highest TPH, whereat ‘Chester
Thornless’ and ‘Navaho’ had the lowest TPH. According to our results, ratio between maximal and minimal TPH recorded were exceed 12, indicating very high variability among cultivars. Clark et al (2002) and Cho et al (2005) found that ‘Loch Ness’ had a higher amount of total phenolics than ‘Navaho’, which confirmed our results. Very high variations and discrepancy among cultivars were observed by other authors (Tosun et al 2008). The discrepancy in our data and TPH from literature could be due to the several factors such as genetic differences, maturity at harvest, cultural practices, different extraction and laboratory methods employed, and tissue type (whole fruit vs. puree or juice extract) (Clark et al 2002).
Data in Table 4 indicated that TFC significantly varied among cultivars, being higher in ‘Thornfree’ and lower in ‘Navaho’, and reflecting a 1.4-tenfold difference among blackberries. Greater variability among blackberry cultivars has been previously reported (Wang 2007; Siriwoharn et al 2004; Siriwoharn et al 2004). The differences could be related to the ecological factors, cultivation conditions and harvest time of the berries (Cho et al 2005).The wide variations were observed among cultivars regarding antioxidant capacity (Table 4). Berries of ‘Black Satin’ had the highest TAC, whereas the lowest value was found in ‘Chester Thornless’. Tamer (2012) found antioxidant activity between 34.32% and 41.89% (the extracts for antioxidant activity were tested at a concentration of 0.3 mg ml-1 on dry basis in their study). According to our results, ‘Black Satin’, ‘Čačanska Bestrna’, somewhat ‘Thornfree’, ranks highest in terms of antioxidant capacities due to their high acidity content (Wang 2007). Previous studies also reported high variability among cultivars and reported that genotypes, other than climate and region, was a major factor affecting antioxidant capacity in ripen blackberries (Prange & De Ell 1997; Clark et al 2002; Siriwoharn et al 2004; Cho et al 2005; Tamer 2012).
Table 4 - Ascorbic acid, total phenolic and total flavonoid content and total antioxidant capacity of blackberry cultivars
Çizelge 4 - Askorbik asit, toplam fenolik ve toplam flavonoit içerikleri ve böğürtlen çeşitlerinin toplam antioksidan kapasitesi
Cultivar Ascorbic acid
(mg 100 g-1 FW)
Total phenolics content (mg GAE g-1 DE) Total flavonoids content (mg RU g-1 DE) Total antioxidant capacity (mg AA g-1 DE) Black Satin 38.72 ± 1.28 cd 413.20 ± 9.56 a 97.71 ± 1.99 b 312.72 ± 3.04 a Dirksen Thornless 35.20 ± 1.35 e 69.46 ± 1.65 c 33.53 ± 2.51 e 123.80 ± 8.03 e Chester Thornless 36.96 ± 1.39 de 34.33 ± 2.22 f 51.98 ± 3.55 d 65.56 ± 2.67 g Thornfree 40.48 ± 1.89 bc 63.61 ± 2.16 d 105.10 ± 3.27 a 145.12 ± 14.76 c Čačanska Bestrna 42.24 ± 1.97 ab 111.00 ± 5.01 b 54.63 ± 3.07 c 231.03 ± 7.51 b Loch Ness 44.00 ± 2.01 a 45.39 ± 2.52 e 10.24 ± 2.84 f 131.37 ± 3.18 d Navaho 35.20 ± 1.13 e 33.52 ± 2.13 f 7.69 ± 1.36 g 111.06 ± 4.31 f LSD0.05 3.000 4.238 2.343 6.321
Data are the means of three replications ± standard error (SE).
Values within column followed by the same letter(s) are not significantly different at P ≤ 0.05 by LSD test.
3.3. Relationship among variables and principal component analysis
The interdependence of the variables was investigated by the analysis of correlation (Table 5).
Data showed that BW had negative correlation to TAC. This relationship indicated that larger berries had lower antioxidant activity, which is in agreement with previous study on blackberry (Wu et al 2010). Very strong correlations were observed between DM and MM, SSC, RS or TS. These data are in agreement with previous study who reported that total dry matter contents and Brix values were positively related (Tamer 2012). Absence of relationship between MM and other variables was associated with strong cultivar effect on these traits (Kafkas et al 2006; Tosun et al 2008). The SSC was positively correlated with RS and TS, therefore, this parameter can be used to predict each others (Türemiş et al 2003). Also, SSC negatively correlated with TA or pH, demonstrating the typical physicochemical changes with acid converting to sugar in berries during ripening (Thompson 1996; Wu et al 2010), although relationships between these variables were not significant. TA was negatively related to pH, RI or SC, which could be explained by the loss of acidity content corresponded with increase of these parameters in the berries (Kafkas et al 2006). The correlation matrix also revealed a high positive correlation between RI and SC, TS or IS, indicating the high SSC/TA rate increase sugar contents and “sweet” eating experience (Clark & Finn 2011).
Additionally, RS positively related to TS or IS, whereas SC and TS also significantly correlated with IS. These parameters can be used to predict each other (Türemiş et al 2003; Kafkas et al 2006). Finally, it is well established that a strong and positive relationship exists between TPH and TFC and antioxidant activity, although correlation among TPH and TFC was not significant. Cho et al (2005) reported that levels of total flavonols and total phenolic content did not correlate, which is not surprising considering that total flavonols accounted for only 2.4-4.0% of the total soluble phenolics in the blackberries. The strong correlation between TPH and TAC confirmed that phenolic compounds, including flavonoids, are the major sources of antioxidants in blackberries (Wang 2007; Wu et al 2010).
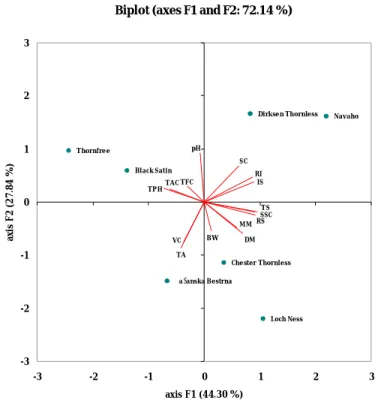
Data from Table 6 showed that more than 87% of the variability observed was explained by the first three components. PC1 represents mainly DM, MM, SSC, RI, RS, TS, IS, TPH and TFC. Positive values for PC1 indicated higher DM, MM, RI, RS, TS and IS. Negative values for PC1 corresponding to higher TPH and TFC (Figure 1). PC2 represent TA, pH, SC and AA. Positive values for PC2 explained SC and pH, while negative values for PC2 indicated the highest AA. PC3 represent smaller BW and low TAC (Figure 1). In general, PCA may help in segregation of blackberries with high nutritional value and antioxidant activity, which were observed in ‘Navaho’ and ‘Loch Ness’, somewhat in ‘Chester Thornless’ and ‘Black Satin’.
Table 5 - Pearson’s correlation matrix among different fruit physical and chemical variables in blackberry cultivars
Çizelge 5 - Böğürtlen çeşitlerinde farklı meyve fiziksel ve kimyasal değişkenleri arasındaki Pearson korelasyon matrisi
Variable BW DM MM SSC TA pH RI RS SC TS IS TPH TFC TAC AA BW 1 0.131 0.258 -0.071 0.245 -0.262 -0.225 0.085 -0.123 0.075 -0.116 -0.701 -0.316 -0.769 0.471 DM 1 0.826 0.891 0.328 -0.627 0.342 0.839 -0.065 0.816 0.381 -0.475 -0.214 -0.277 0.016 MM 1 0.687 0.232 -0.392 0.245 0.666 0.004 0.653 0.288 -0.434 0.157 -0.325 0.012 SSC 1 -0.116 -0.307 0.725 0.957 0.315 0.957 0.742 -0.492 -0.201 -0.315 -0.306 TA 1 -0.779 -0.766 -0.171 -0.878 -0.226 -0.732 0.132 -0.097 0.233 0.647 pH 1 0.331 -0.342 0.615 -0.293 0.242 0.121 0.401 0.131 -0.713 RI 1 0.733 0.809 0.771 0.987 -0.410 -0.104 -0.361 -0.645 RS 1 0.304 0.998 0.792 -0.541 -0.211 -0.475 -0.131 SC 1 0.364 0.763 -0.440 -0.193 -0.436 -0.731 TS 1 0.826 -0.559 -0.218 -0.493 -0.178 IS 1 -0.461 -0.131 -0.459 -0.518 TPH 1 0.577 0.895 0.120 TFC 1 0.536 -0.127 TAC 1 -0.134 AA 1
Abbreviations: BW; berry weight, DM; dry matter, MM; mineral matter, SSC; soluble solids content, TA; titratable acidity, pH; juice pH, RI; ripening index, RS; reducing sugars, SC; sucrose, TS; total sugars, IS; index of sweetness, TPH; total phenolics content, TFC; total flavonoids content, TAC; Total antioxidant capacity, AA; ascorbic acid
In bold, significant values (except diagonal) at the level of significance P ≤ 0.05.
Table 6 - Component loadings for berry quality variables and component scores for 7 blackberry cultivars Çizelge 6 -Böğürtlen kalite değişkenleri ve 7 böğürtlen çeşidi için bileşen değerleri
Variable Component loadings Cultivar Component scores PC1 λ = 44.3 λ = 27.8 PC2 λ = 15.5 PC3 PC1 PC2 PC3 BW 0.136 -0.542 0.722 Black Satin -2.417 0.829 2.408 DM 0.696 -0.580 -0.379 Dirksen Thornless 1.471 2.314 -0.046 MM 0.589 -0.476 -0.313 Chester Thornless 0.643 -1.607 -2.205 SSC 0.900 -0.186 -0.369 Thornfree -4.269 1.356 -1.886 TA -0.415 -0.854 -0.198 Čačanska Bestrna -1.169 -2.075 1.435 pH -0.069 0.924 0.167 Loch Ness 1.865 -3.067 0.106 RI 0.865 0.473 -0.091 Navaho 3.876 2.249 0.190 RS 0.924 -0.236 -0.236 SC 0.616 0.682 0.295 TS 0.944 -0.185 -0.211 IS 0.896 0.374 -0.039 TPH -0.714 0.256 -0.582 TFC -0.300 0.298 -0.542 TAC -0.624 0.241 -0.714 AA -0.379 -0.755 0.167
Figure 1 - Segregation of seven blackberry cultivars according to their fruit quality attributes determined by principal component analysis (PCA). Vectors represent the loadings of quality traits data along with the principal component scores. For abbreviations in biplot see Table 5.
Şekil 1 -Yedi böğürtlen çeşidinin temel bileşenler analizi (PCA) ile belirlenmiş meyve kalite özelliklerine göre ayrılması.
Vektörler temel bileşen değerleri kalite özellikleri ile birlikte veri yükleri temsil eder. Grafikteki kısaltmalar için Tablo 5'e bakınız.
4. Conclusions
In this study, blackberries are an important source of dry and mineral matter, soluble solids content, acidity, sugars, phenolics and flavonoids content, ascorbic acids and antioxidant activity. These phytochemicals varied greatly among blackberry cultivars used in this study and some of them significantly correlated, especially total phenolic content and total antioxidant activity. The PCA was successfully used for grouping cultivars according to similar evaluated physico-chemical features. ‘Čačanska Bestrna’ and ‘Loch Ness’ had the largest berries, while ‘Navaho’ had better eating quality and the highest sugars content. ‘Loch Ness’ is an extremely rich source of ascorbic acid, whereas ‘Black Satin’ underscored for its high total phenolic content and antioxidant capacity. Berries of ‘Thornfree’ were rich source of total flavonoid compounds. Finally, all blackberries evaluated had a good potential for fresh and processing usage, and further breeding programs.
References
Ames B M, Shigena M K & Hagen T M (1993). Oxidants, antioxidants and the degenerative diseases of aging.
Proceedings of the National Academy of Sciences of the United States of America 90: 7915-7922
Basaran P & Kepenek K (2011). Fruit quality attributes of blackberry (Rubus sanctus) mutants obtained by 60Co gamma irradiation. Biotechnology and Bioprocess
Engineering 16: 587-592
Brighente I M C, Dias M, Verdi L G & Pizzolatti M G (2007). Antioxidant activity and total phenolic content of some Brazilian species. Pharmaceutical Biology 45: 156-161
Chaira N, Mrabet A & Ferchichi A (2009). Evaluation of antioxidant activity, phenolics, sugar and mineral contents in date palm fruits. Journal of Food
Biochemistry 33: 390-403
Cho M J, Howard L R, Prior R L & Clark J R (2005). Flavonoid glycosides and antioxidant capacity of various blackberry, blueberry and red grape genotypes determined by high-performance liquid chromatograph/mass spectrometry. Journal of the Science Biplot (axes F1 and F2: 72.14 %)
Navaho Loch Ness Čačanska Bestrna Thornfree Chester Thornless Dirksen Thornless Black Satin BW DM MM SSC TA pH RI RS SC TS IS TPHTACTFC VC -3 -2 -1 0 1 2 3 -3 -2 -1 0 1 2 3 axis F1 (44.30 %) ax is F 2 (2 7. 84 %)
of Food and Agriculture 84: 1771-1782
Clark J R & Finn C E (2011). Blackberry breeding and genetics. Fruit, Vegetable and Cereal Science and
Biotechnology 5: 27-43
Clark J R, Howard L & Talcott S (2002). Antioxidant activity of blackberry genotypes. Acta Horticulturae 585: 475-480
Eyduran S P, Eyduran E & Agaoglu Y S (2008). Estimation of fruit weight by cane traits for eight American blackberries (Rubus fructicosus L.) cultivars. Journal of
Biotechnology 7: 3031-3038
Gerçekcioglu R & Esmek I (2005). Comparison of different blackberry (Rubus fruticosus L.) cultivars in Tokat, Turkey. Journal of Applied Sciences 5: 1374-1377 Gutfinger T (1981). Polyphenols in olive oils. Journal of the
American Oil Chemists’ Society 58: 966-968
Joo M J, Lewandowski N, Auras R, Harte J & Almenar E (2011). Comparative shelf life study of blackberry fruit in bio-based and petroleum-based containers under retail storage conditions. Food Chemistry 126: 1734-1740 Kafkas E, Koşar M, Türemiş N, Başer K H C (2006).
Analysis of sugars, organic acids and vitamin C contents of blackberry genotypes from Turkey. Food Chemistry
97: 732-736
Miletić R, Žikić M, Mitić N & Nikolić R (2006). Pomological and technological features of certain blackberry cultivars in agro-ecological conditions of east Serbia. Voćarstvo
40: 331-339
Milosevic T & Milosevic N (2010). Genetic variability and selection in natural populations of vineyard peach (Prunus persica ssp. vulgaris Mill.) in the Krusevac region (Central Serbia). Agrociencia 44: 297-309 Milosevic T, Milosevic N & Glisic I (2011). Influence of
stock on the early tree growth, yield and fruit quality traits of apricot (Prunus armeniaca L.). Tarım Bilimleri
Dergisi 17: 167-176
Pantelidis G E, Vasilakakis M, Manganaris G A & Diamantidis Gr (2007). Antioxidant capacity, phenol, anthocyanin and ascorbic acid contents in raspberries, blackberries, red currants, gooseberries and cornelian cherries. Food Chemistry 102: 777-783
Perkins-Veazie P, Clark J R, Huber D J & Baldwin E A (2000). Ripening physiology in ‘Navaho’ thornless blackberries: color, respiration, ethylene, production, softening, and compositional changes. Journal of the
American Society for Horticultural Science 125: 357-363
Prange R K & De Ell J R (1997). Preharvest factors affecting postharvest quality of berry crops. HortScience 32: 824-829
Prieto P, Pineda M & Aguilar M (1999). Spectrophotometric quantification of antioxidant capacity through the formation of a phosphomolybdenum complex: specific application of vitamin E. Analytical Biochemistry 269: 337-341
Schneider F (1979). Sugar Analysis. Official and tentative methods recommended by the International Commission for Uniform Methods of Sugar Analysis. ICUMSA, Peterborough, pp 41-73
Seeram N P, Adams L S, Zhang Y J, Lee R, Sand D, Scheuller H S & Heber D (2006). Blackberry, black
raspberry, blueberry, cranberry, red raspberry, and strawberry extracts inhibit growth and stimulate apoptosis of human cancer cells in vitro. Journal of Agricultural
and Food Chemistry 54: 9329-9339
Siriwoharn T, Wrolstad R E, Finn C E & Pereira C B (2004). Influence of cultivar, maturity, and sampling on blackberry (Rubus L. Hybrids) anthocyanins, polyphenolics, and antioxidant properties. Journal of
Agricultural and Food Chemistry 52: 8021-8030
Strik B C, Clark J R, Finn C E & Bañados P (2007). Worldwide production of blackberries, 1995 to 2005 and predictions for growth. HortTechnology 17: 205-213 Strohecker R & Henning H M (1967). Analisis de vitaminas:
métodos comprobados. Paz Montalvo, Madrid, p 428 Šturm K, Koron D & Štampar F (2003). The composition of
fruit of different strawberry varieties depending on maturity stage. Food Chemistry 83: 417-422
Tamer C E (2012). A research on raspberry and blackberry marmalades produced from different cultivars. Journal of
Food Processing and Preservation 36: 74-80
Thompson A K (1996). Fruit ripening conditions. In: Postharvest technology of fruit and vegetables, pp 170-178. Thompson A K (Eds). Blackwell Science Ltd., Oxford, UK
Tosun I, Ustun N S & Tekguler B (2008). Physical and chemical changes during ripening of blackberry fruits.
Scientia Agricola 65: 87-90
Türemiş N, Kafkas S, Kafkas E & Onur C (2003). Fruit characteristics of nine thornless blackberry genotypes.
Journal of the American Pomological Society 57:
161-165
Vrhovsek U, Giongo L, Mattivi F & Viola R (2008). A survey of ellagitannin content in raspberry and blackberry cultivars grown in Trentino (Italy). European Food
Research and Technology 226: 817-824
Wang S Y (2007). Antioxidant capacity and phenolic content of berry fruits as affected by genotype, preharvest conditions, maturity, and handling. In: Berry fruit: value-added products for health promotion, pp 147-186. Zhao Y (Eds). CRC Press, Taylor & Francis Group, Boca Raton, NW, USA
Wu R, Frei B, Kennedy J A & Zhao Y (2010). Effects of refrigerated storage and processing technologies on the bioactive compounds and antioxidant capacities of ‘Marion’ and ‘Evergreen’ blackberries. LWT - Food
Science and Technology 43: 1253-1264
Yılmaz K U, Zengin Y, Ercisli S, Serce S, Gunduz K, Sengul M & Asma B M (2009). Some selected physico-chemical characteristics of wild and cultivated blackberry fruits (Rubus fruticosus L.) from Turkey. Romanian Biotechnological Letters 14: 4152-4163