Tar. Bil. Der.
Dergi web sayfası: www.agri.ankara.edu.tr/dergi
Journal homepage: www.agri.ankara.edu.tr/journal
Effect of Various Agro-Residues on Nutritive Value of
Pleurotus eryngii
(DC. ex Fr.) Quel. var. ferulae Lanzi
Mehmet AKYÜZa, Sevda KIRBAĞba
Bitlis Eren University, Faculty of Arts and Science, Department of Biology, 13000, Bitlis,TURKEY
b
Fırat University, Faculty of Arts and Science, Department of Biology, 23119, Elazığ,TURKEY
ARTICLE INFO
Research Article Crop Production
Corresponding author: Mehmet AKYÜZ, e-mail: [email protected], Tel: +90(434) 228 51 70-1116 Received: 15 December 2008, Received in revised form: 05 April 2010, Accepted: 23 May 2010
ABSTRACT
In this study, the effect of various compost medium on the nutritive value of P. eryngii var. ferulae were determined. Dry matter, moisture, crude ash, protein, fat and organic matter were determined as 91.7-92.7, 7.3-8.3, 5.4-6.1, 8.5-19.7, 2.5-4.1 and 85.8-86.9% of air-dried weight, respectively. There were no significant differences in crude ash and organic matter content for P. eryngii var. ferulae grown on various agro-residues. Crude protein and fat contents varied significantly, the lowest protein content was obtained in natural wild sample (8.5%), whereas the highest were obtained in WS + 10% RB (18.0%), WS-CS (1:1) + 10% RB (18.5%), WS + 20% RB (18.9%) and WS-CS (1:1) + 20% RB (19.7%). Minimum crude fat content was 2.5% in WS-CS (1:1), maximum was 3.9-4.1% in WS + 10% RB, WS + 20% RB, WS-CS (1:1) + 10% RB and WS-CS (1:1) + 20% RB. Mineral contents varied significantly, their contents were determined to be 14.3-22.6 for K, 0.12-0.70 for Ca and 0.1-0.3 for mg g-1 Na as macro elements, 519.5-1142.3 for Fe, 33.5-102.5 for Zn, 41.6-64.6 for Mn, 25.8-48.5 for Cu and 1.3-2.3 for mg kg-1 Cr as micro elements. Pb, Co, Ni and Cd concentrations were under the detection limit of the metod used.
Keywords: Agro-residues; Crude fat; Crude protein; Element; P. eryngii var. ferulae
Değişik Tarımsal Artıkların Pleurotus eryngii (DC. ex Fr.) Quel.
var. ferulae Lanzi’nin Besin Değerleri Üzerine Etkisi
ESER BĐLGĐSĐ
Araştırma Makalesi Bitkisel Üretim
Sorumlu Yazar: Mehmet AKYÜZ, e-posta: [email protected], Tel: +90(434) 228 51 70-1116 Geliş tarihi: 15 Aralık 2008, Düzeltmelerin gelişi: 05 Nisan 2010, Kabul: 23 Mayıs 2010
ÖZET
Bu çalışmada; değişik compost ortamlarının P. eryngii var. ferulae’nin besin değerleri üzerine etkileri belirlenmiştir. Kuru madde, nem, ham kül, ham protein, ham yağ ve organik madde içerikleri; kuru ağırlığın %91.7-92.7, %7.3-8.3, %5.4-6.1, %8.5-19.7, %2.5-4.1 ve %85.8-86.9 olarak bulunmuştur. Değişik tarımsal artıklar üzerinde yetiştirilen P. eryngii var. ferulae’nin; ham kül ve organik madde içeriklerinde istatistiksel olarak önemli bir fark bulunmamıştır. Ham protein ve yağ içeriklerinin değişken olduğu, en düşük ham protein içeriği; doğa’dan sağlanan yabani örnekte (% 8.5) elde edilirken, en yüksek ise; BS + %10 PK (%18.0), BS + %20 PK (%18.9), BS-PS (1:1) + %10 PK (%18.5) ve BS-PS (1:1) + %20 PK (%19.7) ortamlarında elde edilmiştir. Minimum ham yağ içeriği; BS-PK (1:1)
T
A
R
IM
B
İL
İM
LE
R
İ
D
E
R
G
İS
İ
J
O
U
R
N
A
L
O
F
A
G
R
IC
U
LT
U
R
A
L
S
C
IE
N
C
E
S
16 ( 20 10 ) 8 3-8 8
%3.9-4.1’dir. Element içeriklerinin değişken olduğu ve 14.3-22.6 K, 0.12-0.70 Ca ve 0.1-0.3 mg kg-1 Na gibi makro elementler, 519.5-1142.3 Fe, 33.5-102.5 Zn, 41.6-64.6 Mn, 25.8-48.5 Cu ve 1.3-2.3 mg kg-1 Cr gibi mikro elementler olarak belirlenmiştir. Ayrıca; Pb, Co, Ni ve Cd konsantrasyonları kullanılan metodun belirleme limitinin altında bulunmuştur.
Anahtar sözcükler: Tarımsal artıklar; Ham yağ; Ham protein; Element; P. eryngii var. ferulae
© Ankara Üniversitesi Ziraat Fakültesi
1. Introduction
More than 2000 species of mushrooms exist in nature, but approximately 22 species are intensively cultivated (Manzi et al 2001). In most countries, there is a well-established consumer acceptance for cultivated mushrooms such as Agaricus bisporus,
Lentinus edodes, Pleurotus spp., Volvariella
volvacea, Auricularia spp. (Diez & Alvarez 2001).
Cultivation of Pleurotus spp. has become a large-scale production in the last thirty years. In the world’s mushroom production Pleurotus spp. are in the third place after the white button mushroom and
shiitake. Production techniques for these
basidiomycetes are well developed, and are relatively simple, compared with those used for the most commonly cultivated mushroom (Ragunathan
& Swaminathan 2003). They may be cultivated on a
large number of substrates, according to local availability in different regions of the world. The majority of these substrates has been used as animal feed. However, their low digestibility, low protein content and high lignin content render them unpopular and unacceptable (Cohen et al 2002). Mushroom culture is a biotechnological process that recycles lignocellulosic wastes, since these are converted to a food for human. Its popularity has been increasing due to its ease of cultivation, high yield potential and high nutritional value (Mau et al 1998; Manzi et al 1999; Guo et al 2007). This type of biotechnological aproach results in the conversion of agricultural wastes into food of high fructification and nutritive value or into good quality fodder by enriching the waste protein content and by improving their digestibility as stated by Philippoisis et al (2001) and Cohen et al (2002).
The purpose of this study is to determine effects of various composts on the nutritive value of P.
eryngii var. ferulae.
2. Materials and Methods
2.1. Obtained of mushroom samples
The mushroom samples used in this study were obtained from the previous culture work (Kirbag & Akyüz 2008).
Wheat straw (WS) and mixture of wheat straw-cotton stalk (CS) at a ratio of 1:1 were used in preparing two different types of compost. All composts were supplemented with rice bran (RB) at a rate of 10% or 20%, therefore, 6 types of compost were prepared. The mushroom fructification obtained after culture were harvested in sterile conditions and labeled. The mushroom samples were dried at room temperature for 15 days and then stored in loced bags. These samples were used in this study.
2.2. Proximate analysis
The proximate composition of P. eryngii var.
ferulae, including moisture, dry matter, crude
protein, crude fat, crude ash and organic matter, were determined according to AOAC (1990) methods. Total nitrogen (N) was determined by the Kjeldahl method. Crude protein was calculated as N x 6.25 (Diez & Alvarez 2001). Crude fat was determined using the soxhlet extraction method with ether as solvent and total ash by incineration at 550°C. Organic matter was calculated as % dry matter - % ash.
2.3. Element analysis
Each sample of air-dried mushroom was dried at 105°C overnight and crushed in a mortar and pestle. Digestion of mushroom samples was performed
using mixture of HNO3 : H2SO4 : H2O2 (10:1:1, 12
ml for 1 g sample) and heating 100°C for about 10-15 min. After cooling, 50 ml deonized water was added and filtered. All sample solutions were clear. While amounts of Fe, Zn, Mn, Cu, Cr, Cd, Co, Ni
and Pb were determined by atomic absorption spectrometer (Perkin-Elmer, model: 370 made by:
The Perkin-Elmer Corporation Norwalk
Connecticut, USA), those of K, Ca and Na were performed by atomic emission spectrometer (Eppendorf Geratebau, Netheler + HINZ GMBH Hamburg, GERMANY) (Anonymous 1990).
2.4. Statistical analysis
All data collected were analysed by the analysis of variance. The least significant differences among means were determined through Tukey’s Honest Significant Difference (HSD) multiple comparison test at 0.05 level, with Statistical Package for the Social Sciences (SPSS) 13.0 computer program (SPSS, Chicago, Illinois, USA). After multiple comparisons, the means were interpreted as follows: Tables were followed with diffferent small letters ‘’a–f’’ based on their values and statistical differences. Means followed by the same letter (s) are not significantly different but means followed by different letter(s) are significantly different at 0.05. The experiments were repeated 3 times (n=3).
3. Results and Discussion
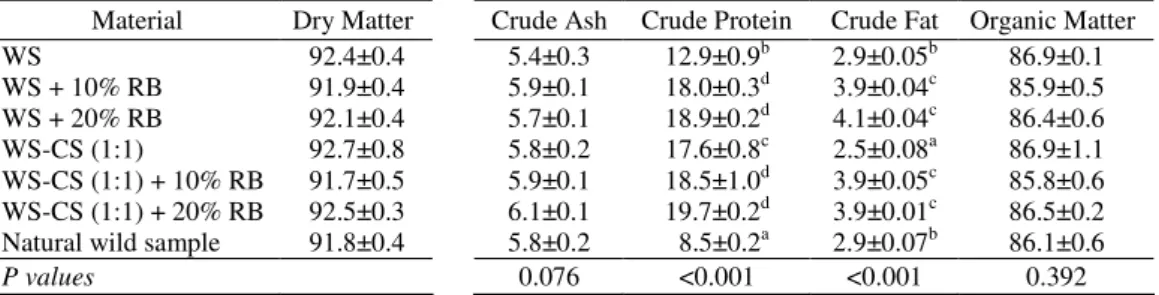
There were, however, no significant differences in crude ash and organic matter contents for P. eryngii var. ferulae grown on various agro-residues (Table 1).
Crude ash content ranged from 5.4-6.1%, and organic matter ranged from 85.8-86.9% see in Table 1. The reported ash contents were 4.96% in
P. eryngii var. ferulae (Guo et al 2007), 5.15-7.21%
in P. eryngii (Mau et al 1998), 9.16-10.55% in P.
eryngii and 8.61% in P. eryngii var. ferulae (Manzi
et al 1999). Ash contents are similar to that reported in similar studies (Mau et al 1998), lower than that reported earlier (Manzi et al 1999), and higher than previously reported (Guo et al (2007).
The lowest crude protein content was found to be 8.5% on natural wild sample, while the highest were 18.0% on WS + 10% RB, 18.5% on WS-CS (1:1) + 10% RB, 18.9% on WS + 20% RB and 19.7% on WS-CS (1:1) + 20% RB in Table 1. In order to enriched the protein content of P. eryngii var. ferulae, rice bran sould be combined with WS and WS-CS (1:1). Adding 10% RB to compost led
to an increase in protein contents of mushroom for WS and WS-CS (Table 1). Adding 10% RB to WS and WS-CS (1:1) increased crude protein content of mushroom, but in respect of 10% RB, 20% RB addition rate was not found important. The crude protein contents of P. eryngii var. ferulae which was obtained from WS + 10% RB, WS + 20% RB, WS-CS (1:1) + 10% RB and WS-CS (1:1) + 20% RB were observed to be very similar statisticaly. The reported crude protein contents were 30.3% in
P. eryngii var. ferulae (Guo et al 2007),
20.71-22.15% in P. eryngii (Mau et al 1998), 22.74-22.89% in P. eryngii and 23.21-25.41% in P.
eryngii var. ferulae (Manzi et al 1999). Protein
contents of P. eryngii var. ferulae are lower than those reported earlier (Mau et al 1998; Manzi et al 1999; Guo et al 2007). The chemical composition of the substrates used in cultivation has a direct effect on the chemical composition of the fruiting bodies (Table 1).
Minumum crude fat content was 2.5% on WS-CS (1:1) and maximum were 3.9% on WS + 10% RB, WS-CS (1:1) + 10% RB and WS-CS (1:1) + 20% RB, and 4.1% on WS + 20% RB see in Table 1. With the additon of 10% RB to WS and WS-CS (1:1), crude fat content of mushroom was increased, but in respect of 10% RB, 20% RB addition rate was not found important statisticaly. The crude fat contents of P. eryngii var. ferulae which was obtained from WS + 10% RB, WS + 20% RB, WS-CS (1:1) + 10% RB and WS-WS-CS (1:1) + 20% RB were observed to be very similar statisticaly. The reported crude fat contents were 5.71% in P.
eryngii var. ferulae (Guo et al 2007), 1.57-1.81% in
P. eryngii (Mau et al 1998). The levels of crude fat
determined in P. eryngii var. ferulae are lower than that in previous report (Guo et al 2007), and higher than previously reported (Mau et al 1998). The differences between the values obtained might arise from the biological structure of substrat and additive materials (Table 1).
The lowest potassium contents were found to be
14.3 mg g-1 on WS + 10% RB, 15.3 mg g-1 on WS,
while the highest were 21.5 mg g-1 on WS-CS (1:1),
21.6 mg g-1 on WS-CS (1:1) + 10% RB, and 22.6
mg g-1 on natural wild sample as seen in Table 2.
No statistical difference was found with the potassium rate of mushroom samples which was
Table 1-Nutritional composition of P. eryngii var. ferulae grown on various agro-wastes (%, air-dried basis)
Çizelge 1-Değişik tarımsal atıklar üzerinde yetiştirilen P. eryngii var. ferulae’nin besin bileşimleri (%, havada kuru esasında)
Material Dry Matter Crude Ash Crude Protein Crude Fat Organic Matter WS WS + 10% RB WS + 20% RB WS-CS (1:1) WS-CS (1:1) + 10% RB WS-CS (1:1) + 20% RB Natural wild sample
92.4±0.4 91.9±0.4 92.1±0.4 92.7±0.8 91.7±0.5 92.5±0.3 91.8±0.4 5.4±0.3 5.9±0.1 5.7±0.1 5.8±0.2 5.9±0.1 6.1±0.1 5.8±0.2 12.9±0.9b 18.0±0.3d 18.9±0.2d 17.6±0.8c 18.5±1.0d 19.7±0.2d 8.5±0.2a 2.9±0.05b 3.9±0.04c 4.1±0.04c 2.5±0.08a 3.9±0.05c 3.9±0.01c 2.9±0.07b 86.9±0.1 85.9±0.5 86.4±0.6 86.9±1.1 85.8±0.6 86.5±0.2 86.1±0.6 P values 0.076 <0.001 <0.001 0.392
Each value is expressed as mean ± SD of three replicate analyses (n=3)
Values with different small letters in the same column are significantly different at the level of 0.05 (P < 0.05) Wheat straw (WS), cotton stalk (CS), rice bran (RB), Natural wild sample: Icme-Elazıg
Table 2-Element contets of P. eryngii var. ferulae grown on various agro-wastes (air-dried basis)
Çizelge 2-Değişik tarımsal atıklar üzerinde yetiştirilen P. eryngii var. ferulae’nin element içerikleri (havada kuru esasında)
Macro elements Micro elements (mg kg-1) Material K (mg g-1) Ca (mg g-1) Na (mg kg-1) Fe Zn Mn Cu Cr WS WS + 10% RB WS + 20% RB WS-CS (1:1) WS-CS (1:1) + 10% RB WS-CS (1:1) + 20% RB Natural wild sample
15.3±0.3ab 15.9±0.3b 14.3±0.3a 21.5±0.9d 21.6±0.4d 18.8±0.8c 22.6±0.7d 0.51±0.01c 0.59±0.02d 0.12±0.02a 0.30±0.02b 0.70±0.03e 0.17±0.02a 0.57±0.02d 100.0±1.2a 174.1±4.0c 152.5±2.5b 307.5±5.6f 227.8±2.5d 240.0±5.0e 168.5±4.9c 620.7±2.7e 521.1±4.9a 589.3±1.4c 540.3±2.0b 519.5±5.5a 607.5±7.5d 1142.3±5.5f 33.5±1.5a 40.5±1.5b 102.5±4.5d 53.5±1.5c 50.5±2.1c 53.0±1.4c 43.5±3.5b 52.2±1.2d 50.0±1.0cd 47.1±1.0b 64.6±1.8e 41.6±1.5a 47.5±3.5b 49.9±2.8c 34.1±0.3b 34.0±0.9b 41.4±0.7c 48.5±0.2d 40.9±1.5c 40.7±1.8c 25.8±1.3a 2.1±0.04a 1.7±0.17a 1.6±0.02a 2.0±0.04a 1.3±0.06a 2.3±0.13a - b P values <0.001 <0.001 <0.001 <0.001 <0.001 <0.001 <0.001 <0.001
Each value is expressed as mean ± SD of three replicate analyses (n=3),
Values with different small letters in the same column are significantly different at the level of 0.05 (P < 0.05) Wheat straw (WS), cotton stalk (CS), Rice bran (RB), Natural wild sample: Icme-Elazıg
Pb, Co, Ni and Cd: analysized, but not detected (the concentrations were under the detection limit of the metod used) The limits are 5-25, 1-5, 1-5 and 0.4-2 mg kg-1, respectively
obtained from WS and WS-CS (1:1) + 20% RB, also WS and WS-CS (1:1) + 20% RB. Besides, difference in WS-CS (1:1), WS-CS (1:1) + 10% RB and natural wild sample was not considered statisticaly important (Table 2). The reported
potassium contents were 16.2 mg g-1 in P. eryngii
var. ferulae (Guo et al 2007), 26.1 mg g-1 in P.
eryngii var. ferulae and 30.9-40.5 mg g-1 in P.
eryngii (Manzi et al 1999). The levels of potassium
on WS + 10% RB and WS are higher than that in previous report (Guo et al 2007), and levels on WS-CS (1:1), WS-WS-CS (1:1) + 10% RB and natural wild sample are lower than previously reported (Manzi et al 1999). The differences between the values obtained might arise from the biological structure of substrat and additive material (Table 2).
The highest calcium content was 0.70 mg g-1 on
WS-CS (1:1) + 10% RB, whereas the lowest were
0.12 mg g-1 on WS + 20% RB and 0.17 mg g-1 on
WS-CS (1:1) + 20% RB (Table 2). Addition of 10% RB to WS and WS-CS (1:1) medium increased the calcium level, but in the addition rate 20% RB was decrease in respective of 10% addition rate. No statistical difference was found with the calcium content of mushroom samples which was obtained from WS + 10% RB and natural wild sample, also WS + 20% RB and WS-CS (1:1) + 20% RB, but the difference was considered important in the other trial groups (Table 2). The reported calcium
contents were 28.4 mg g-1 in P. eryngii var. ferulae
and 33.7-35.3 mg g-1 in P. eryngii (Manzi et al
et al 2003), 96.8 mg kg-1 in P. eryngii var. ferulae
(Shi & Shao 2003) and 0.23 mg g-1 in P. eryngii
var. ferulae (Guo et al 2007). The level of calcium on WS-CS (1:1) + 10% RB is higher than that in previous report (Manzi et al 1999; Gong et al 2003; Shi & Shao 2003; Guo et al 2007), and levels on WS + 20% RB and WS-CS (1:1) + 20% RB are lower than previously reported (Manzi et al 1999; Guo et al 2007). According to data obtained, the main reason for different results is due to the use of different material in culture medium (Table 2).
Minumum sodium content was 0.1 mg g-1 on
WS, and maximum was 0.3 mg g-1 on WS-CS (1:1)
as seen in Table 2. Addition of 10% RB to WS and WS-CS (1:1) increased the sodium level, but in the addition rate 20% RB was variable in respective of 10% addition rate. The reported sodium contents
were 0.44 mg g-1 in P. eryngii var. ferulae and
0.50-0.76 mg g-1 in P. eryngii (Manzi et al 1999).
Sodium contents of P. eryngii var. ferulae which was obtained from various compost medium are low compared to an earlier published report (Manzi et al 1999).
The iron concentration was high on natural wild
sample (1142.3 mg kg-1) and ranged from 100.0 to
307.5 mg kg-1 (Table 2). Iron content of P. eryngii
var. ferulae which was obtained from natural wild sample was found higher than that in culture medium. Adding 10% RB to WS and WS-CS (1:1) decreased iron level of mushroom, but with 20% RB addition rate increased it in respect of 10% RB addition rate (Table 2). The reported iron content
were 33 mg kg-1 in P. eryngii var. ferulae (Gong et
al 2003), 887 mg kg-1 in P. eryngii var. ferulae (Shi
& Shao 2003) and 0.07 mg g-1 in P. eryngii var.
ferulae (Guo et al 2007). Iron contents of P. eryngii
var. ferulae which was obtained from various compost medium are higher compared to an earlier published report (Gong et al 2003; Guo et al 2007), but that data (Shi & Shao 2003) is different from
the data in our work (from 100.0 to 307.5 mg kg-1).
This difference probably was due to the use of mushroom samples obtained from different growing media.
Maximum zinc content was 102.5 mg kg-1 on
WS + 20% RB, while the lowest were 40.5 mg kg-1
on WS + 10% RB and 43.5 mg kg-1 on natural wild
samples seen in Table 2. Adding 10% and 20% RB to WS increased zinc level, but in WS-CS (1:1) was
stable. The reported zinc content were 78 mg kg-1 in
P. eryngii var. ferulae (Gong et al 2003), 190 mg
kg-1 in P. eryngii var. ferulae (Shi & Shao 2003)
and 0.08 mg g-1 in P. eryngii var. ferulae (Guo et al
2007). The level of zinc on WS + 20% RB is higher than that in previous report (Gong et al 2003; Guo et al 2007), and levels on WS, WS + 10% RB, WS-CS (1:1), WS-WS-CS (1:1) + 10% RB, WS-WS-CS (1:1) + 20% RB and natural wild sample are lower than previously reported (Shi & Shao 2003; Guo et al 2007). The differences between the values obtained might arise from the biological structure of substrat and additive material.
The highest manganese content was 64.6 mg kg
-1 in WS-CS (1:1), the lowest was 41.6 mg kg-1 in
WS-CS (1:1) + 10% RB (Table 2). Adding 10% RB to WS did not change manganese content of mushroom statistically, but in 20% RB addition rate change similar to 10% RB was found. On the other hand, no statistical difference was found for the manganese rate of mushroom samples which was obtained from WS + 20% RB and WS-CS (1:1) + 20% RB. The reported manganese content was 143
mg kg-1 in P. eryngii (Dogan et al 2006). The level
of manganese content of P. eryngii var. ferulae which was obtained from various compost medium is lower compared to an earlier published report (Dogan et al 2006).
The lowest and highest copper values were
found on natural wild sample (25.8 mg kg-1) and
WS-CS (1:1) (48.5 mg kg-1) as seen in Table 2.
Adding 10% RB to WS had no significant effect, but 20%RB level increased copper content of the mushroom. Contrary to WS, both 10 and 20% RB addition to WS-CS (1:1) material reduced mushroom copper content. Besides, the lowest copper level was found in natural wild sample (Table 2). The reported copper values for P. eryngii
was 16.5 mg kg-1 (Dogan et al 2006). Manganese
contents of P. eryngii var. ferulae which was obtained from various compost medium are higher compared to an earlier published report (Dogan et al 2006). The differences between reported and obtained values might arise from the biological structure of substrat and additive material (Table 2).
When compared with other wastes, the
chromium concentration (1.3-2.3 mg kg-1 was not
significantly affected by various composts (Table 2). In natural wild samples, chromium had not been detected. The reported chromium content was 46.7
mg kg-1 in P. eryngii (Dogan et al 2006). Chromium
contents of P. eryngii var. ferulae harvested from various compost medium in this study are lower compared to an earlier published report (Dogan et al 2006). This difference probably was due to the use of mushroom samples obtained from different growing media.
Other information on toxic metals, such as lead, cobalt, nickel and cadmium in this study has been studied, and those heavy metal levels were not detected. Hence, those value are relatively compared to previously published report (Dogan et al 2006). The uptake of metal ions in mushrooms is many respects different from plants; the concentration of metals depends on mushroom species, their ecosystems and soil (Dogan et al 2006).
4. Conclusion
In this study, it was found that products including low lipid and high protein can be produced using various plants materials. Crude protein contents of
P. eryngii var. ferulae obtained from WS + 10%
RB, WS + 20% RB, WS-CS (1:1) + 10% RB and WS-CS (1:1) + 20% RB were higher than those of WS and WS-CS. Natural wild sample had lowest crude protein content. Element contents of P.
eryngii var. ferulae, in different manner, were also
affected by WS, WS-CS and RB addition. However, heavy metals have not been detected in mushroom samples. Mentioned plant materials and additive matter had proved to be a good substrate for the high protein content of P. eryngii var.
ferulae. Mixtures of various agro-residues in a ratio
of 1:1 should be used and combined with rice bran to produce nutritionaly enriched P. eryngii var.
ferulae.
Acknowledgements
This study was financially supported by Fırat University (Project No: FÜBAP-1446). The authors also wish to thank the reviewers for their valuable comments.
References
AOAC (1990). Official Methods of Analysis (15th ed.). Washington, DC: Association of Official Analytical Chemists
Cohen R, Persky L & Hadar Y (2002). Biotechnological applications and potential of wood degrading mushrooms of the genus Pleurotus. Applied Microbiology and Biotechnology 58: 582-594 Diez V A & Alvarez A (2001). Compositional and
nutritional studies on two wild edible mushrooms from Northwest Spain. Food Chemistry 75: 417-422 Dogan H H, Sanda M A, Uyanoz R, Oztürk C & Cetin U
(2006). Contents of metals in some wild mushrooms: Its impact in human health. Biological Trace Element Research 110 : 79–94
Gong Z Y, Yu S F & Qu L (2003) Nutrient analysis of Pleurotus eryngii and Pleurotus ferulae cultivated with cotton seed hull compost. Acta Edulis Fungi 10: 21–24
Guo L-Q, Lin J-Y & Lin J-F (2007). Non-volatile components of several novel species of edible fungi in China. Food Chemistry 100: 643-649
Kirbag S & Akyüz M (2008). Evaluation of agricultural wastes for the cultivation of Pleurotus eryngii (DC. ex Fr.) Quel. var. ferulae Lanzi. African Journal of Biotechnology 7 (20): 3660-3664
Manzi P, Gambelli L, Marconi S, Vivanti V & Pizzoferrato L (1999). Nutrients in edible mushrooms: an inter-species comparative study. Food Chemistry 65: 477-482
Manzi P, Aguzzi A & Pizzoferrato L (2001). Nutritional value of mushrooms widely consumed in Italy. Food Chemistry 73: 321-325
Mau J L, Lin Y P, Chen PT, Wu Y H & Peng J T (1998). Flavor compounds in king oyster mushrooms Pleurotus eryngii. Journal of Agricultural and Food Chemistry 46: 4587-4591
Philippoussis A, Zervakis G & Diamantopoulou P (2001). Bioconversion of agricultural lignocellulosic wastes through the cultivation of the edible mushrooms Agrocybe aegerita, Volvariella volvacea and Pleurotus spp. World Journal of Microbiology and Biotechnology 17: 191-200
Ragunathan R & Swaminathan K (2003). Nutritional status of Pleurotus spp. grow on various agro-wastes. Food Chemistry 80: 371-375
Shi QY & Shao WP (2003) Determination of nutritive components of eight edible fungi. Journal of Gansu Agricultural University 38: 336–339